Contents lists available atScienceDirect
Agriculture, Ecosystems and Environment
journal homepage:www.elsevier.com/locate/agee
E
ff
ects of diet and manure storage method on carbon and nitrogen dynamics
during storage and plant nitrogen uptake
Mutian Niu
a, Jayasooriya A.D.R.N. Appuhamy
b, Robert S. Dungan
c, Ermias Kebreab
a,
April B. Leytem
c,⁎aDepartment of Animal Science, University of California, Davis, CA 95616, USA bDepartment of Animal Science, Iowa State University, Ames, IA 50011, USA
cUSDA-Agricultural Research Service, Northwest Irrigation and Soils Research Laboratory, Kimberly, ID 83341, USA
A R T I C L E I N F O
Keywords:
Dairy Manure Nitrogen Carbon Storage
A B S T R A C T
Altering dairy cattle diets to reduce both enteric methane (CH4) production and nitrogen (N) excretion are valuable tools for mitigating the environmental impact of dairy production. We examined the impact of altering diets on changes in physicochemical properties of manure during storage and short term plant N availability. Manure collected from cattle fed diets with differing forage and crude protein (CP) content were stored via two methods (slurry and static pile) for 29 weeks and sampled at week 0, 1, 2, 3, 4, 9, 14, 19, 24, and 29. There was no effect of diet on C and N dynamics during storage for either storage treatment. Mass losses of total carbon (C) were 10% greater for the static pile manure treatment than the slurry (P <0.01). Total N losses ranged from were approximately 46% with no treatment differences. The soil 2-week plant available N was 67% less in the static pile than the slurry treatment, while the short-term plant N use efficiency was similar for both the static pile and slurry treatments (22–24%). Due to the high inorganic N content of slurry following storage, greater care may be needed to ensure that environmental losses do not occur.
1. Introduction
Milk production is the third largest agricultural industry in the United States, with California and Idaho being two of the top three dairy-producing states (USDA, 2016a,b). While dairy cows are able to convert human inedible substrates into valuable food products for human consumption, they can also have a negative impact on en-vironmental quality. Dairy production systems contribute to green-house gas (GHG) emissions through enteric methane (CH4) production as well as production of CH4and nitrous oxide (N2O) from manure storage, grazing, and forage production. According to 2013 estimates, dairy cattle generated approximately 13% of all U.S. agricultural GHG emissions via enteric CH4production and manure management alone, equating to 84 Mt Carbon dioxide (CO2) equivalent (USDA, 2016a,b). Dairy production also contributes to the release of reactive nitrogen (N) into the environment which can have negative impacts on water quality and alter the physical structure of ecosystems which can have cascading effects in the environment (Pardo et al., 2015). Reactive N generated from dairy production consists mainly of ammonia (NH3) losses from cattle housing, manure storage, and land application of manures, as
well as losses of nitrate (NO3, via leaching) and emissions of N2O from forage production systems (Rotz and Leytem, 2015).
Mitigation strategies to reduce both CH4and reactive N from dairy production include managing cattle diets. For example, modifications in quantity and quality of dietary forage are potential enteric CH4 miti-gation strategies (Kebreab et al., 2006). Research has also shown that reducing protein consumption in excess of the animal’s requirement can reduce N excretion to the environment (Colmenero and Broderick, 2006; van der Stelt et al., 2008). By reducing N excretion and enhan-cing N use efficiency in the animal, less reactive N is available for losses via emissions or leaching post excretion and following land application of manures. These dietary strategies aimed at reducing potential ne-gative environmental impacts of dairy production can also affect carbon (C) and N losses during manure storage and the utilization of nitrogen when used as a fertilizer source for forage/crop production.
There have been several studies that have evaluated the effects of manipulating dairy diets on manure composition and plant utilization of manure nutrients with a focus onPowell et al. (2011)found that changes in dietary crude protein (CP) level affected the losses of NH3 from dairy slurry applied to soils (48 h) with high CP (16.8% dry matter
http://dx.doi.org/10.1016/j.agee.2017.08.034
Received 21 February 2017; Received in revised form 29 August 2017; Accepted 30 August 2017
⁎Corresponding author.
E-mail addresses:[email protected](M. Niu),[email protected](J.A.D.R.N. Appuhamy),[email protected](R.S. Dungan),[email protected](E. Kebreab),
[email protected](A.B. Leytem).
0167-8809/ Published by Elsevier B.V.
[DM]) diets producing 2.1 times more NH3than low CP (15.5% DM) diets. The slurry resulting from the high CP diets also had 1.6 times as much soil extractable NH4and 1.5 times as much extractable inorganic N than the low CP diets which could affect plant nutrient uptake and N leaching. van der Stelt et al. (2008) reported that NH3 losses from stored manure slurries were 10 times greater from high CP (19.0% DM) diets vs. low CP (10.8% DM) diets. When compared to fertilizer N as a plant nutrient source, studies have indicated that slurry from dairy cattle with high CP diets have a higher mineral fertilizer equivalent compared to low CP diets (Sørensen et al., 2003; Reijs et al., 2007). N. In contrast,Wu and Powell (2007)found that manure N use efficiency was greatest from low CP (13.4% DM) diets compared to diets with high CP contents (17.1 and 19.4% DM) for an oat-sorghum-sorghum ratoon rotation. In all instances, these data were from manure slurries that, in most cases, did not undergo long term storage prior to use in nutrient uptake studies.
Dairy cattle housing in the western United States (U.S.) is unique, in that 30% of lactating cows are housed in dry lots, which represents most of the dry lot housing in the country (USDA, 2009). Manure handling and storage at dry lot dairies is somewhat unique, as the majority of manure is deposited on the lot surface, scraped and piled, and remains in the lots until it is later removed for composting or land application. Manures can be stored like this for more than a year in some cases. In addition to dry lot dairies, another typical western U.S. housing system consists of freestall dairies that utilize aflush system to handle manure, which is stored in lagoons for up to six months in many cases, and later applied through irrigation systems on surrounding cropland. Therefore, previous studies that have evaluated the effects of dietary manipulation on fresh dairy slurry composition and plant nu-trient uptake may not be as relevant to western dairy production sys-tems. Hence our objectives were to: 1. Evaluate the effect of dietary mitigation strategies to reduce both enteric CH4production and N ex-cretion on nutrient dynamics of stored manures; and 2. Evaluate the short term nutrient availability and uptake, by barley, in soil amended with these manures following storage.
2. Materials and methods
2.1. Feeding trial and collection of manure
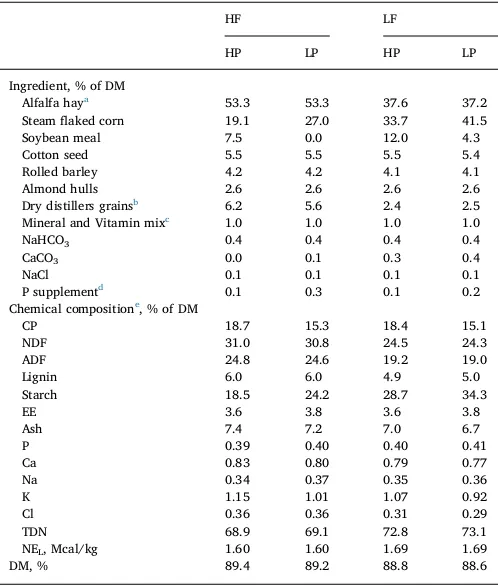
All procedures were approved by Institutional Animal Care and Use Committee at the University of California-Davis. The feeding trial was conducted from July to September of 2014 at the Teaching and Research Facilities of the Department of Animal Science at the University of California-Davis. Feces and urine were collected from 12 Holstein cows fed 4 diets consisting of two dietary forage levels [low forage (LF) and high forage (HF), 37.4 vs. 53.3% of DM] and two dietary CP levels [low protein (LP) and high protein (HP), 15.2 vs. 18.5% of DM]. The rations offered to cows in the feeding trial are shown inTable 1. The diets were mainly comprised of alfalfa hay and steamedflaked corn with the high forage diets having 53% alfalfa while the low forage diets had 37%. The high forage diets had 29% greater NDF, 30% greater ADF and 20% greater lignin than the low forage diets. The CP in the diets varied from 15% for the low protein diets to 18% for the high protein diets. The feeding trial was a 4 × 4 Latin square design with four 18 d periods with each period consisting of a 15-d adaptation followed by 3-d sample collection (Niu et al., 2016). Cows were individually fed a total mixed ration prepared once a week (Table 1). Cows were fed ad libitum twice a day at 105% of previous daily intakes, 60% of which was offered at 0800 h and the balance was offered at 2000 h according toNiu et al. (2014). Refused feed was re-moved and weighed before feed delivery in the morning.
Feces and urine were individually collected from d 16 to 18 of period 2, 3 and 4 of the feeding trial for use in the manure storage study described below. Feces were scraped out from the rubber mat im-mediately after defecation using long handle metal scrapers. Scraped
feces were stored in a plastic container assigned to each cow. Feces weight was recorded every two hours from 0900 to 2100 h and every 3 h after 2100 h. Urine from individual cows was collected using an indwelling Foley catheter (24 French, 75-cc ballon; C. R. Bard, Covington, GA) connected to 2–3 m of Tygon tubing (Tygon S E-3603 Flexible Tubings; Fisher Scientific, Waltham, MA) running to a 25 L plastic urine collection jar (Nalgene HDPE Jerricans; Fisher Scientific, Waltham, MA), which was placed in a plastic bucketfilled with ap-proximately 75% ice. Tubes were switched to an empty jar placed on ice at 0900, 1500, 2100, and 0300 h and urine weights were recorded.
2.2. Manure storage study
The manure storage experiment was conducted from August of 2014 to March of 2015 at the Teaching and Research Facilities of the Department of Animal Science at the University of California-Davis. For each period (2–4) of the feeding trial, feces were collected from all cattle on each diet and thoroughly mixed using D-shape drain spade shovel. Manure was then divided into two parts and stored in 2 con-tainers (Rubbermaid Commercial Products LLC, Winchester, VA) which were then transported to the site for the manure storage study on a daily basis. The two different storage treatments were: 1.slurry, which would representflush water from a freestall dairy; and 2.static pile, Table 1
Ingredient and chemical composition of the experimental diets.
HF LF
HP LP HP LP
Ingredient, % of DM
Alfalfa haya 53.3 53.3 37.6 37.2
Steamflaked corn 19.1 27.0 33.7 41.5
Soybean meal 7.5 0.0 12.0 4.3
Cotton seed 5.5 5.5 5.5 5.4
Rolled barley 4.2 4.2 4.1 4.1
Almond hulls 2.6 2.6 2.6 2.6
Dry distillers grainsb 6.2 5.6 2.4 2.5
Mineral and Vitamin mixc 1.0 1.0 1.0 1.0
NaHCO3 0.4 0.4 0.4 0.4
CaCO3 0.0 0.1 0.3 0.4
NaCl 0.1 0.1 0.1 0.1
P supplementd 0.1 0.3 0.1 0.2
Chemical compositione, % of DM
CP 18.7 15.3 18.4 15.1
NDF 31.0 30.8 24.5 24.3
ADF 24.8 24.6 19.2 19.0
Lignin 6.0 6.0 4.9 5.0
Starch 18.5 24.2 28.7 34.3
EE 3.6 3.8 3.6 3.8
Ash 7.4 7.2 7.0 6.7
P 0.39 0.40 0.40 0.41
Ca 0.83 0.80 0.79 0.77
Na 0.34 0.37 0.35 0.36
K 1.15 1.01 1.07 0.92
Cl 0.36 0.36 0.31 0.29
TDN 68.9 69.1 72.8 73.1
NEL, Mcal/kg 1.60 1.60 1.69 1.69
DM, % 89.4 89.2 88.8 88.6
aContained 91.5% DM and 17.6% CP, 44.2% NDF, 2.5% starch, and 16.3% tdNDF on a
DM basis.
bDried distillers grains (DDGS) = dried byproducts of whiskey and fuel ethanol
pro-duction; contained 90.4% DM and 32.2% CP, 28.3% NDF, 6.2% starch on a DM basis.
cMineral and Vitamin mix compositions (DM basis): 0.49% CP; 0.185% fat; 0.72%
NDF; 11.8% Ca; 5.33% P; 9.16% Na; 0.08% K; 0.005% Cl; 4.27% Mg; 2.11% S; 4,466.7 mg/kg of Zn; 208.1 mg/kg of Fe; 2,666.7 mg/kg of Mn; 666.7 mg/kg of Cu; 58.7 mg/kg of I; 25.1 mg/kg of Co; 22.7 mg/kg of Se; 0.22% Methionine; 0.01% Lysine; 533,874 IU/kg of Vitamin A (retinyl acetate); 184,800 IU/kg of Vitamin D (Activated 7-dehydrocholesterol); 4180 IU/kg of Vitamin E (dl-αtocopheryl acetate); 58.674 mg/kg of biotin; 933.3 mg/kg of Monensin (Elanco, Greenfield, IN).
dPhosphorus supplement; ICL Performance Products LP, St. Louis, MO. contained: 26%
of P; 19.3% of Na; 0.03% of S; 30 mg/kg of F; 50 mg/kg of Fe.
which would represent manure from the lots that was scraped and stacked in a dry lot system. Only feces were included in the static pile treatments as cows typically urinate on the dry lot surface and much of this N is volatilized quickly or soaks into the soil surface, therefore the majority of N in the piles is likely from feces that are scraped from the lot surfaces. The slurry treatment was replicated by mixing feces and urine in a ratio that represented what was excreted by the cows. This manure mixture was then put into 379 L poly-tuf open containers (Freeland Industries, Inc., Portage, WI) and mixed with well water to reach the target feces: urine: water ratio of 1:1:1.5. The target feces to urine ratio was determined based on the ratio excreted from the cows (Niu et al., 2016) with water added to reach a target of 6% solids content which is within the range of a “slurry”defined as 4 to 10% solids (Lorimor et al., 2004). The approximate surface area: volume ratio of the slurry manure was 1: 379 (m2/L), and the depth of the slurry manure ranged from 0.5 to 0.6 m. The static pile treatment was created by stacking manure (approximately 120 kg) in open plastic containers (1.1 m in diameter) and left without any further movement. The depth of the stacking manure ranged from 0.2 to 0.3 m. Manure from each of the three collection periods were treated as replicates for each diet/manure storage combination treatment. Hence there were 8 treatments (4 diets × 2 manure storages) for each period replicated 3 times for a total of 24 manure containers. The total weight of manure going into each container was recorded and a sample was immediately taken to represent time“0”.
Manures were stored for 29 weeks. Water was added to the slurry treatments once a week to maintain the initial volume. Starting at time “0” the ambient air temperature and temperature of each manure treatment was recorded every 15 min using a temperature probe with data logger (HOBO U23 Pro v2 External Temp Data Logger; Onset Computer Corp., Bourne, MA). Temperature sensors were placed in the middle of the pile (for static piles) or slurry tank (for slurries). Subsamples of manure were collected from each manure treatment at week 0, 1, 2, 3, 4, 9, 14, 19, 24, and 29. Approximately 150 g of manure was collected from the static pile treatment using a spatula and placed in a clean plastic bag. The hard surface of the static pile treatments were cut open and four samples were collected at different locations and then composited after which the hard manure pieces were put back in place to re-seal the static piles. Slurry treatments were mixed for 30 s prior to sampling and a 200 mL composite sample was collected from each tank and placed into a wide-mouth sample bottle (Fisher Scientific, Waltham, MA). The composite sample consisted of 4 subsamples that were collected at various locations/depths using a 50-mL open-mouth polystyrene serological pipette (Falcon transfer pipettes; Corning, New York). Samples were placed in a styrofoam cooler with ice, then im-mediately brought to the laboratory and stored at−20 °C.
At the end of the experimental period, the slurry was brought to volume, thoroughly mixed and afinal sample was taken for analysis. Slurry was then pumped into 190 L (50 gal) plastic drums for transport. The static pile manures were weighed and thoroughly mixed and a composite sample collected. The manures from the static pile treat-ments were then loaded into plastic containers for transport. All man-ures were transported to the USDA-ARS Northwest Irrigation and Soils Research Laboratory in Kimberly, ID for use in a greenhouse study.
2.3. Greenhouse study
A greenhouse study was conducted from July to August of 2015 at the Northwest Irrigation and Soils Research Laboratory in Kimberly, ID. The soil used in this study was a Portneuf silt loam (coarse-silty, mixed, superactive, mesic Durinodic Xeric Haplocalcids) from 0- to 20- cm depth located at the Northwest Irrigation and Soils Research Laboratory in Kimberly, ID. The bulk soil had a NH4-N and NO3-N concentration of 13 and 33 mg N kg−1, respectively and a bicarbonate extractable P value of 19 mg kg−1. The bulk soil was collected and air-dried, then sieved through a 7-mm screen and analyzed prior to use in the
greenhouse study. There were two mixtures prepared for use in the study: 250 g soil + amendment for sampling after 2 weeks incubation (for soil analysis post treatment application), and 2.5 kg soil + amendment for the plant growth study. For the two week incubation, manure was added to 250 mL polyethylene containers containing soil and thoroughly mixed with a spatula. For the plant uptake study, 4L closed bottom pots lined with plastic were used and manures were surface applied and immediately incorporated into the top 2 inches of soil using a hand rake. Each of the manure sources was incorporated (4 replicates of each source) at a rate of 135 mg N kg−1 (303 kg ha−1) based on the University of Idaho fertilizer recommendations for irri-gated barley, assuming an average of 30% availability of manure N for solid manures. Although the slurry would be expected to have greater N availability, for comparison we applied the same amount of total N across treatments. After incorporation, amended soils were brought to approximately 80% field capacity using simulated irrigation water (1:1 v/v tap and deionized water) and incubated in a completely ran-domized design in the greenhouse for two weeks. Soil moisture content was maintained by adding water to the cups or to the pots every other day.
After two weeks of incubation, soils from the polyethylene con-tainers (250 g) were collected for analysis and six barley seeds (Hordeum vulgare) were planted into the 2.5 kg soil pots. Greenhouse photoperiod was approximately 12/12 h (day/night) using additional lighting when necessary (368μmol s−1m−2). After emergence, plants were thinned to four per pot, and were grown for 25 days. At harvest, whole plant samples were cut 1 cm above the soil surface, dried in an oven at 60 °C, with wet and dry weights obtained before and after drying, and ground for analysis.
2.4. Chemical analyses
Frozen samples from the static pile treatments were shipped to Cumberland Valley Analytical Services Inc. (Maugansville, MD) for analysis of dry matter (DM; 135 °C; AOAC, 2000; method 930.15), ash (535 °C; AOAC, 2000; method 942.05), neutral detergentfiber (NDF; Van Soest et al., 1991), non-fiber carbohydrates (NFC;Hall, 2008), and minerals (AOAC, 2000; method 985.01). Organic matter (OM) was determined based on ash content (OM = 100% − ash%). Frozen samples of all storage treatments were shipped to the USDA-ARS La-boratory in Kimberly, ID. Slurry samples were defrosted and allowed to come to room temperature and the pH was measured using a Jenway 4330 conductivity and pH meter (Jenway, Stafforshire, UK). Slurries were analyzed for total and volatile solids using Standard Methods 2540B and 2540 E, respectively (Eaton et al., 2005), DM (135 °C; AOAC, 2000; method 930.15), and ash (535 °C; AOAC, 2000; method 942.05). The solid manures and slurries were then freeze dried and ground with total N and C determined by combustion of a 25 mg sample in a FlashEA1112 (CE Elantech, Lakewood, NJ).
Olsen et al. (1954) with P analysis performed with the phosphomo-lybdate blue method ofMurphy and Riley (1962). Dried plant samples were analyzed for total N and C via combustion of a 50 mg sample in a FlashEA1112 (CE Elantech, Lakewood, NJ).
2.5. Calculations
Total mass balances were conducted on each manure treatment to determine the total loss of C and N over the storage period using Eq.(1). Average mass reduction of C, N, and total solids were calculated as:
= −
Mass reduction
Initial DM mass kg C End DM mass kg C
Initial mass DM kg C
(%)
[ ( )* ] [ ( )* ]
( )* *100
f 0
0 (1)
Where C0is the concentration of nutrient at time “0” and Cfis the concentration of the nutrient at thefinal sampling. Total solids were determined via difference in DM content.
Plant nitrogen uptake (PNU) was calculated as follows: =
PNU plant biomass g DM tissue concentration( )* (% DM) (2)
Nitrogen use efficiency was calculated as follows:
= −
NUE PNU treatment PNU control
nitrogen added with treatment
( ) ( )
*100
(3) The percentage of soil inorganic N (IN, IN = NO3-N + NH4-N) as total N applied was calculated as follows:
= −
IN of TN Soil IN treatment soil IN control
nitrogen added with treatment
% ( ) ( )*100
(4)
2.6. Statistical analysis
Mass reductions of nutrients in manure during storage were ana-lyzed for effects of manure storage, dietary CP, and forage, and their interactions in 3-way factorial ANOVA using aov (“stats” package) procedure of R statistical language (version 3.3.1; The R Manuals. R Foundation, Vienna, Austria). Slurry pH was analyzed using a sub-model which did not include the manure storage effect. In all analyses, interaction terms were removed from the model if they were not sta-tistically significant. Changes in the C, N, and C:N ratio over the entire storage period were analyzed for manure storage effect tested at each time point in linear mixed-effect models with repeated measures (Time) using lmer (“lme4”package) procedure of R statistical language. The mixed-effect model was:
= + + + + + + × + +
Yijklm μ Mi CPj Fk Tl Pm Mi Tl MT eijklm,
whereYis the response of interest,μis the overall mean,Miis thefixed effect of manure storage (i= 1–3),CPjis thefixed effect of dietary CP content (j= 1–2), Fk is the fixed effect of dietary forage content (k= 1–2),Tlis thefixed effect of time (l= 1–10),Pmis the random effect of manure pool (m= 1–3),Mi×Tlis the interactions between manure storage and time,MTis the covariate of manure temperature, and eijklmis the residual error. Similarly, changes in organic matter (OM), neutral detergent fiber (NDF), and non-fiber carbohydrates (NFC) over time were analyzed for manure storage effect only for static pile manure treatments. Data points with Studentized residuals outside of ± 3.5 were considered outliers and were removed from analysis. Statistically significant differences were declared atP < 0.05.
In the greenhouse study, all data were analyzed using SAS statistical software version 9.2 (SAS Institute Inc., 2008. SAS user’s guide: Statistics. SAS Inst., Cary, NC). Statistical analyses of the data were performed with a factorial analysis of variance (ANOVA) using the PROC GLM (general linear models) procedure with dietary forage, dietary CP, manure storage and their interactions as main effects in the model. Initial analysis indicated that there was no effect of dietary CP
and forage on plant nutrient utilization, while there were significant effects of manure storage, and interaction terms were not significant. Therefore, we averaged manures across dietary treatment and used a one way ANOVA to determine the effect of storage type on plant nu-trient utilization. Means separation was performed using the Ryan-Einot-Gabriel-Welsch multiple range test, with aP <0.05.
3. Results and discussion
3.1. C and N dynamics during manure storage
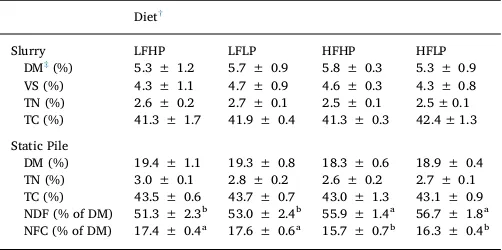
The chemical characteristics of manures at the start of the storage study are shown inTable 2. The reported values are similar to those reported in the literature (Sørensen et al., 2003; Powell et al., 2006; Wu and Powell, 2007; Shah et al., 2015). The only effect of diet on manure physicochemical parameters at the start of the study was the effect of dietary forage level on NDF and NFC (static pile treatment only). Manure NDF was slightly higher in the high forage diets (56% of DM) compared with the low forage diets (52% of DM), while the opposite trend was noted in the NFC contents. The ratio of NDF to NFC was 17% greater in the high forage diets than the low forage diets. These dif-ferences persisted throughout the storage study. The remainder of the manure physicochemical properties did not differ. The average DM for the static pile treatment (19%) was 3.5 times that of the slurry treat-ment (5.5%). The volatile solids content of the slurry was 80% of the total solids content. Average total N and C (both treatments) were 2.7% and 43% of DM, respectively.
While diet did have an effect on urinary N excreted (Appendix A; Niu et al., 2016), there was no effect of diet on manure chemical properties at the start of the storage study. The solid manure treatment did not have urine added to it as the majority of urinary N would have volatilized prior to manure storage on a typical farm, so the N con-centrations were driven by fecal N which was not affected by diet. Although there was urine mixed with feces in the slurry treatment, there were no significant differences in manure total N at the start of the storage study. It is likely that the rapid volatilization of NH3during transport, preparation, and very onset of storage lead to losses of ur-inary N prior to monitoring of the slurry. The majority of NH3 loss usually occurs within 48 h of excretion (Paul et al., 1998; Misselbrook et al., 2005), therefore, by the time the urine and feces were mixed, transported to the storage site and then mixed with water, a large amount of the urinary N could have already been lost through volati-lization.
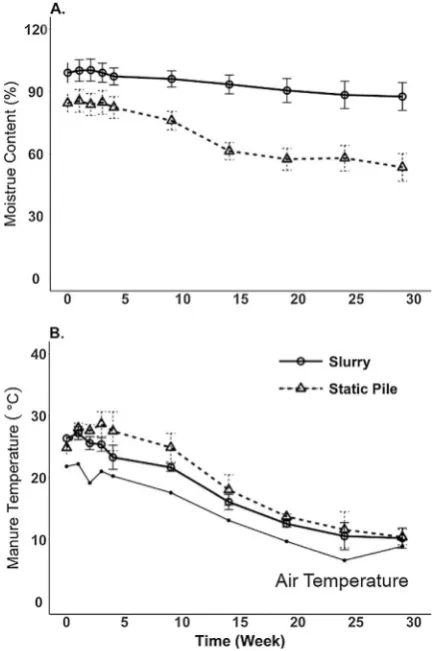
During the manure storage study, the moisture content varied with storage treatment over time (Fig. 1a). The slurry moisture content was maintained at 95.8% by the weekly addition of water to compensate for losses through evaporation. The moisture content of the static pile Table 2
Physicochemical properties of manures at start of storage study.
Diet†
Slurry LFHP LFLP HFHP HFLP
DM‡(%) 5.3 ± 1.2 5.7 ± 0.9 5.8 ± 0.3 5.3 ± 0.9 VS (%) 4.3 ± 1.1 4.7 ± 0.9 4.6 ± 0.3 4.3 ± 0.8 TN (%) 2.6 ± 0.2 2.7 ± 0.1 2.5 ± 0.1 2.5 ± 0.1 TC (%) 41.3 ± 1.7 41.9 ± 0.4 41.3 ± 0.3 42.4 ± 1.3
Static Pile
DM (%) 19.4 ± 1.1 19.3 ± 0.8 18.3 ± 0.6 18.9 ± 0.4 TN (%) 3.0 ± 0.1 2.8 ± 0.2 2.6 ± 0.2 2.7 ± 0.1 TC (%) 43.5 ± 0.6 43.7 ± 0.7 43.0 ± 1.3 43.1 ± 0.9 NDF (% of DM) 51.3 ± 2.3b 53.0 ± 2.4b 55.9 ± 1.4a 56.7 ± 1.8a
NFC (% of DM) 17.4 ± 0.4a 17.6 ± 0.6a 15.7 ± 0.7b 16.3 ± 0.4b
†LFHP = low forage and high protein diet, LFLP = low forage and low protein diet,
HFHP = high protein and high protein diet, HFLP = high forage and low protein diet. ‡DM = dry matter, VS = volatile solids, TN = total nitrogen, TC = total carbon,
treatment decreased by 19.4% over the storage period. The temperature in both manure treatments decreased over time from approximately 25.5 to 10.5 °C and was within 5 °C of ambient air temperature over this period (Fig. 1b). Initially, the slurry temperatures were slightly lower than the solid manure treatment at weeks 3–6, which may be due to enhanced microbial activity in the solid manure treatment generating more heat than the slurry.Petersen et al. (1998)reported little heat production in solid stacked (3 months) dairy cattle manure during the spring or autumn with manure temperatures being, on average, within 3 °C of ambient air temperature suggesting little biodegradation ac-tivity. The lack of heat generation in the stacked manure may also be a
function of pile size, increased microbial activity in larger piles could generate more heat than what was seen here. The pH of the slurry decreased over thefirst four weeks from 7.5 to 7.2 and then remained fairly stable over the duration of the storage period (Fig. 2). It is likely that the loss of N as NH3lead to a slight decrease in the pH as the conversion of NH4to NH3is an acid producing reaction. It has been shown that the greatest NH3losses from manure storages occur within thefirst few weeks of storage (Petersen et al., 1998; Sommer et al., 2001) and then level off. The changes in pH in the slurry treatments followed a typical NH3loss pattern.
The characteristics of the C in the solid manure treatment also changed over time. Overall, OM as a percent of DM decreased (3.8%) with time in the static pile treatments (Fig. 3a.)Luebbe et al. (2011) reported an average OM loss of 37% in cattle manure that had been static piled for 104-111 days. Manure NDF, composed mainly of lignin, hemicellulose and cellulose, increased over the first three weeks of storage and then remained fairly constant (Fig. 3b). In contrast, manure NFC, composed mainly of starch, simple sugars and solublefiber, de-creased over thefirst three weeks of storage (Fig. 3c). This suggests that over time as the simple C compounds are degraded the manure is comprised of a more resistant C fraction when it is eventually land applied. This change in C fraction can also effect N mineralization and crop utilization. For example, it has been demonstrated that there is a negative relationship between NDF and utilization of N in barley (Sørensen et al., 2003).
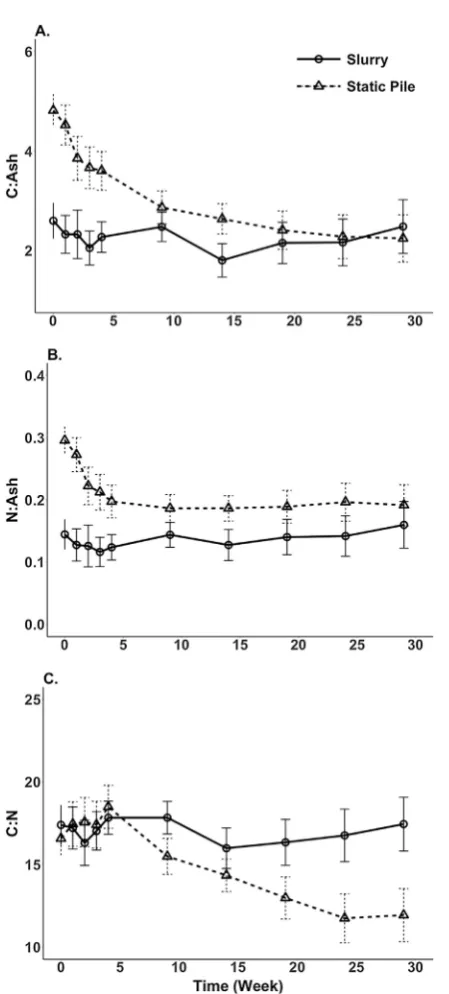
The changes in manure C and N were represented as a ratio of nu-trient to ash content as the ash should be conserved during manure storage; this allows examination of nutrient changes over time in-dependent of losses of DM. The N: ash ratio over the storage period decreased over thefirst 3 weeks of storage and then leveled offfor the remaining time period (Fig. 4a). There was also a decrease in the total C: ash ratio over the storage period, with the greatest decrease Fig. 1.Moisture content (Panel A) and manure temperature (Panel B) over the entire
storage period for the different manure storage treatments. Error bars represent the 95% confidence interval at each time point for each manure treatment.
Fig. 2.The pH of manure slurry over the entire storage period. Error bars represent the 95% confidence interval at each time point.
occurring in thefirst 3 weeks (Fig. 4b). The C:N ratio of the manures was below 19 (Fig. 4c), suggesting that the N in these manures would be more likely to mineralize than become immobilized once applied to soils (Calderon et al., 2004). The slurry treatment had an increasing C:N ratio over the first 5 weeks after which it stabilized, while the solid manure storage treatment had a decline in the C:N ratio over time. A decline in C: N ratio during the composting of cattle manure has also been observed in other studies (e.g.,Larney and Olsen, 2006; Larney et al., 2008).
The overall mass of C lost over the storage period was 10% greater in the static piled manure compared to the slurry (Table 3). Literature values of C losses during storage of solid cattle manure in static piles range from 13 to 47%, with C losses increasing with storage length (Petersen et al., 1998; Larney et al., 2006; Larney and Olsen, 2006; Luebbe et al., 2011). The values from the present study fall within this
range and are similar to the longer term storage losses of 47% seen in studies with manure stored for 6 months. The mass loss of N over the storage period was similar between the slurry (47%) and static pile (45%) treatments. Literature values of N losses during storage of solid cattle manure range from 7 to 39% (Petersen et al., 1998; Sommer, 2001; Larney et al., 2006, 2008; Larney and Olsen, 2006; Luebbe et al., 2011). However, greater loss estimates have been reported. For ex-ample,Dewes et al. (1990)reported total losses of N from liquid cattle manure stored for 180 days to range from 32 to 54%. It is important to note that the solid manure in the literature studies would have also included urine, and in many cases bedding, which could affect overall N losses. The values in the present study are close to the top end of the literature estimates, but are in line with values for longer storage per-iods.
3.2. Plant nutrient utilization
As there was no effect of diet but an effect of storage on the manure chemical composition at the end of the manure storage study, the characteristics of the manure used in the greenhouse study are shown by manure storage treatment only (Table 4). The manure DM ranged from 36 g kg−1in the slurry treatment to 269 g kg−1in the static pile treatment. The total N and C of the static pile treatment was 27 and 385 g kg−1, respectively. The majority of N in the static piled manure was in an organic form (97% of total N) with < 1 g kg DM−1as NO
3-N + NH4-N. Literature values for% organic N in stockpiled manures range from 68 to 97% (Petersen et al., 1998; Larney et al., 2006; Luebbe et al., 2011; Moral et al., 2012; Shah et al., 2012). The slurry N and C Fig. 4.Changes in the carbon (C; Panel A), nitrogen (N; Panel B), and carbon to nitrogen
(C: N; Panel C) ratio over the storage period for the manure storage treatments. Error bars represent the 95% confidence interval.
Table 3
Main effects of manure storage on mass reduction of carbon, nitrogen, and total solids.
Estimates (mean ± SD)
Manure Property SL† SP
Carbon
Initial mass, kg 8.0 ± 0.3 8.2 ± 0.4
End mass, kg 4.8 ± 0.8 4.1 ± 0.9
Mass reduction‡, % 40.4 ± 9.5b 50.4 ± 9.6a
Nitrogen
Initial mass, kg 0.50 ± 0.04 0.53 ± 0.06
End mass, kg 0.26 ± 0.04 0.29 ± 0.07
Mass reduction, % 46.8 ± 8.2a 45.0 ± 9.9a
Total Solids
Initial mass, kg 19.2 ± 0.8 18.9 ± 0.8
End mass, kg 11.5 ± 1.7 10.6 ± 2.3
Mass reduction, % 40.0 ± 9.4a 44.3 ± 11.5a
†SL = slurry, SP = static pile.
‡All pairwise contrasts were tested using Tukey multiple comparison.
Table 4
Properties of manure used in the greenhouse study.
Estimates (mean ± SD)
Static Pile Slurry
DMa, g kg−1 269 ± 18 36 ± 11
C, g kg DM−1 385 ± 5 380 ± 2
N, g kg DM−1 26.6 ± 4 35.0 ± 2
NH4-N g kg DM−1 0.27 ± 0.11 NA
NO3-N g kg DM−1 0.64 ± 0.88 NA
TAN, g kg DM-1 NA 21 ± 2
% IN of TN 3.3 ± 3.2 60 ± 5
C:N 14.8 ± 2.1 10.0 ± 1.9
N added, mg 337.5 ± 0 335.4 ± 5
C added, mg 4976 ± 753 3388 ± 750
aDM = dry matter, N = nitrogen, C = carbon, NH
4-N = ammonium nitrogen, NO3
concentrations on a DM basis were slightly higher in N (35 mg kg−1) but similar in C (380 mg kg−1) compared to the static pile treatment. In contrast to the static piled manure treatment, the majority of N in the slurry was ammoniacal N (60% of total N) which is consistent with literature values that range from 48 to 67% (Sørensen et al., 2003; Wu and Powell, 2007; Powell and Grabber, 2009). The C: N ratios ranged from 10 to 14.8, which is below the ratio where N immobilization in soils amended with manures would be expected (Calderon et al., 2004). The N added in the treatments was approximately 337 mg, while the C added was lower for the slurry treatment (3388 mg) compared to the static piled manure treatment (4976 mg).
Following two weeks of incubation, the soil NO3-N concentrations were similar for the control, and static pile treatments (52–59 mg kg−1; Fig. 5). The soil NO3-N concentration for the slurry treatment was 2.7 times this amount at 145 mg kg−1. As the soil NH
4concentrations were very low at this point (< 3 mg kg−1) for both treatments, the total inorganic N concentration (NO3-N plus NH4-N) was similar to that of NO3-N. The amount of added N that was plant available after two weeks of incubation was low in the stacked pile treatment (6%). However, there was a large amount of plant available N in the slurry treatment, with 70% of the added N being in a form that would be immediately plant available.
As the average NH4-N content of the dairy slurries was 60% and this N source can be readily converted to NO3in soils, therefore, it is not surprising that there was a large amount of NO3-N present at planting. The lower C: N ratio of the slurry (10) compared to the solid manure (14.8) should also enhance the mineralization of N in this treatment. Jansen (1996)demonstrated a negative linear relationship between the C: N ratio of soil amendments and the fraction of N that is mineralized. The mineral fertilizer equivalent of dairy slurry applied to grassland fields was also shown to be negatively correlated to the C: N ratio of the slurry (Sørensen et al., 2003; Reijs et al., 2007). This high availability of N in the slurry treatment indicates that slurry N may behave more si-milarly to fertilizer N as opposed to the solid manure treatment where N may be slowly released over time. However, if this slurry N is not uti-lized quickly by the growing crops, it could be lost due to leaching through the soil profile, especially with irrigation, or lost as N2O due to denitrification. As slurries tend to be applied either in early spring or late fall when plant demand for N is low, this could indicate that manure slurry may be a larger concern from a leaching standpoint than solid manures.
Barley DM production was affected by manure storage treatment with the static pile having the highest DM production (5694 g DM, Table 5). Both manure treatments had greater DM production than the control (3750 mg). The N uptake was greater in both the static piled (145 mg) and slurry (151 mg) treatments than the control (69 mg). Overall the NUE was similar in the static pile and slurry treatment with
an average of 23% even though the slurry had greater soil IN at planting compared to the solid manure treatment. These results are similar to those found in the literature.Shah et al. (2016)reported a NUE of 29% for stockpiled cattle manure stored for 5 months, which is similar to the NUE found in the present study.Powell et al. (2006)reported N uptake from dairy manure ranging from 4 to 21% for oats, sorghum and sor-ghum ratoon. WhilePowell and Grabber (2009)reported dairy slurry N recoveries of 29 to 34% for spring applied slurry with corn.
4. Conclusions
Altering cattle diets to reduce enteric CH4production and reduce N excretion had very little effect on manure physicochemical properties at the start of the storage study. One exception to this was that manure generated from low forage diets had lower NDF and greater NFC than manure generated from high forage diets, with this difference persisting throughout the storage period. There was a 10% greater mass reduction of C in the static pile manure treatment vs the slurry treatment, while there was no difference in mass losses of N. The soil N availability prior to planting barley was 2.7 fold greater in the slurry treatment vs the static pile treatment although this did not translate to greater DM production or NUE in the slurry treatment. Due to the rapid release of NO3 in the slurry treatment following land application, greater care may be necessary in order to reduce potential losses of N due to leaching of NO3or gaseous losses of N2O via denitrification.
Acknowledgments
We sincerely thank Tekeste Tewoldebrhan, Sagor Biswas, and Jasmin Bardales who helped with the labor intensive sample collection and analysis. We also like to thank Luis Moraes for data analysis sup-port. We gratefully acknowledge thefinancial support for this experi-ment provided by the USDA-ARS, Northwest Irrigation and Soils Research Laboratory, Kimberly, ID.
Fig. 5.Soil nitrate (NO3), inorganic nitrogen (IN) and% IN of total
ni-trogen applied to soils following two weeks of incubation. Error bars re-present the standard deviation of the mean.
Table 5
Dry matter production, nitrogen uptake and nitrogen use efficiency (NUE) of barley in the greenhouse study.
Treatment DM† N uptake NUE, %
mg
Static Pile 5694 ± 247a 144.6 ± 8.9a 22.1 ± 2.6a
Slurry 4681 ± 539b 151.3 ± 8.0a 24.2 ± 2.1a
Control 3750 ± 580c 68.6 ± 6.1c
Appendix A. Effect of dietary forage and CP content on nitrogen (N) intake, and urinary and fecal N excretion in lactating cows fromNiu et al. (2016).
Foragea Proteina P-value
Item HF LF HP LP SEb Forage Protein Forage × Protein
NcIntake, g/d 543 545 601 486 19 0.79 < 0.01 0.47
Urinary and fecal excretions
Urine output, kg/d 25.3 22.9 26.6 21.6 1.4 < 0.01 < 0.01 0.26
Urine N, g/d 204 181 237 149 12 0.04 < 0.01 0.52
% of N intake 36.1 33.0 39.5 29.6 1.4 0.11 < 0.01 0.67
Urea N, g/d 141 121 165 96 3.0 < 0.01 < 0.01 0.61
Fecal output, kg/d 35.8 33.5 34.6 34.7 1.4 < 0.01 0.95 0.85
Fecal N, g/d 164 169 167 166 7 0.19 0.92 0.55
% of N intake 30.6 31.3 27.8 34.2 0.8 0.31 < 0.01 0.23
Urinary and fecal N excretion, g/d 370 349 403 315 16 0.09 < 0.01 0.50
% of N intake 67.9 64.2 67.4 64.8 1.5 0.09 0.22 0.72
aHF = high forage diet (53.3% forage of DM); LF = low forage diet (37.4% forage of DM); HP = high protein diet (18.5% CP of DM); LP = low protein diet (15.2% CP of DM).
bSE = standard error. cN = nitrogen.
References
Calderon, F.J., McCarty, G.W., Van Kessel, J.S., Reeves III, J.B., 2004. Carbon and ni-trogen dynamics during incubation of manured soil. Soil Sci. Soc. Am. J. 68, 1592–1599.
Colmenero, J.J.O., Broderick, G.A., 2006. Effect of dietary crude protein concentration on milk production and nitrogen utilization in lactating dariy cows. J. Dairy Sci. 89, 1704–1712.
Dewes, T., Schmitt, L., Valentin, U., Ahrens, E., 1990. Nitrogen losses during the storage of liquid livestock manures. Biol. Wastes 31, 241–250.
Eaton, A.D., Clesceri, L.S., Rice, E.W., Greenberg, A.E. (Eds.), 2005. Standard Methods for the Examination of Water & Wastewater, 21st ed. American Public Health Association, American Water Works Association, Water Environment Federation. Port City Press, Baltimore, MD.
Hall, M.B., 2008. Determination of starch, including maltooligosaccharides, in animal feeds: comparison of methods and a method recommended for AOAC collaborative study. J. AOAC Int. 92, 42–49.
Jansen, B.H., 1996. Nitrogen mineralization in relation to C:N ratio and decomposability of organic materials. Plant Soil 181, 39–45.
Kebreab, E., Clark, K., Wagner-Riddle, C., France, J., 2006. Methane and nitrous oxide eimissions from Canadian animal agriculture: a review. Can. J. Anim. Sci. 86, 135–157.
Larney, F.J., Olsen, F., 2006. Windrow temperature and chemical properties during active and passive aeration composting of beef cattle feedlot manure. Can. J. Soil Sci. 86, 783–797.
Larney, F.J., Buckley, K.E., Hao, X., McCaughey, W.P., 2006. Fresh, stockpiled, and composted beef cattle feedlot manure: nutrient levels and mass balance estiates in Alberta and Manitoba. J. Environ. Qual. 35, 1844–1854.
Larney, F.J., Olsen, F., DeMaere, P.R., Handerek, B.P., Tovell, B.C., 2008. Nutrient and trace element changes during manure composting at four southern Alberta feedlots. Can. J. Soil Sci. 88, 45–59.
Lorimor, J., Powers, W., Sutton, A., 2004. Manure Characteristics. Manure Management System Series. Mid West Plan Service, Iowa, USA.http://msue.anr.msu.edu/uploads/
files/ManureCharacteristicsMWPS-18_1.pdf(verified July, 2017).
Luebbe, M.K., Erickson, G.E., Klopfenstein, T.J., Greenquist, M.A., Benton, J.R., 2011. Composting or stockpiling of feedlot manure in Nebraska: nutrient concentration and mass balance. Prof. Anim. Sci. 27, 83–91.
Misselbrook, T.H., Powell, J.M., Broderick, G.A., Grabberm, J.H., 2005. Dietary manip-ulation in dairy cattle: laboratory experiments to assess the influence on ammonia emisisonsw. J. Dairy Sci. 88, 1814–1821.
Moral, R., Bustamante, M.A., Chadwick, D.R., Camp, V., Misselbrook, T.H., 2012. N and C transformations in stored cattle farmyard manure, including direct estimates of N2 emissions. Resour. Conserv. Recycl. 63, 35–42.
Murphy, J., Riley, J.P., 1962. A modified single solution method for determination of phosphates in natural waters. Anal. Chim. Acta. 27, 31–33.
Niu, M., Ying, Y., Bartell, P.A., Harvatine, K.J., 2014. The effects of feeding time on milk production, total-tract digestibility, and daily rhythms of feeding behavior and plasma metabolites and hormones in dairy cows. J. Dairy Sci. 97, 7764–7776.
Niu, M., Appuhamy, J.A.D.R.N., Leytem, A.B., Dungan, R.S., Kebreab, E., 2016. Effect of
dietary crude protein and forage contents on enteric methane emissions and nitrogen excretion from dairy cows simultaneously. Anim. Prod. Sci. 56, 312–321.
Olsen, S.R., Cole, C.V., Watatanabe, F.S., Dean, L.A., 1954. Estimation of available phosphorus in soils by extraction with sodium bicarbonate. USDA Circ 939. USDA, Washington, DC.
Pardo, L.H., Blett, T., Clark, C.M., Geiser, L.H., 2015. Impacts of nitogen pollution on terrestrial ecosisytems in the United States. EM Magazine. Air & Waste Management Association, pp. 24–30 (September Issue).
Paul, J.W., Dinn, N.E., Kannangara, T., Fisher, L.J., 1998. Protein content in dairy cattle diets affects ammonia losses and fertilizer nitrogen value. J. Environ. Qual. 27, 528–534.
Petersen, S.O., Lind, A.M., Sommer, S.G., 1998. Nitrogen and organic matter losses during storage of cattle and pig manure. J. Agric. Sci. 130 (1), 69–79.
Powell, J.M., Grabber, J.H., 2009. Dietary forage impacts on dairy slurry nitrogen availability to corn. Agron. J. 101, 747–753.
Powell, J.M., Wattiaux, M.A., Broderick, G.A., Moreira, V.R., Casler, M.D., 2006. Dairy diet impacts on fecal chemical properties and nitrogen cycling in soils. Soil Sci. Soc. Am. J. 70, 786–794.
Powell, J.M., Aguerre, M.J., Wattiaux, M.W., 2011. Dietary crude protein and tannin impact dairy manure chemistry and ammonia emissions from incubated soils. J. Environ. Qual. 40, 1767–1774.
Reijs, J.W., Sonneveld, M.P.W., Sørensen, P., Schils, R.L.M., Groot, J.C.J., Lantinga, E.A., 2007. Effects of different diets on utilization of nitrogen from cattle slurry applied to grassland on a sandy soil in The Netherlands. Agric. Ecosyst. Environ. 118, 65–79.
Rotz, C.A., Leytem, A.B., 2015. Reactive nitrogen emissions from agricultural operations. EM Magazine. Air & Waste Management Association, pp. 12–17 (September Issue).
Sørensen, P., Weisbjerg, M.R., Lund, P., 2003. Dietary effects on the composition and plant utilization of nitrogen in dairy cattle manure. J. Agric. Sci. 141, 79–91.
Shah, G.M., Shah, G.A., Groot, J.C.J., Oenema, O., Raza, A.S., Lantinga, E.A., 2016. J. Agric. Sci. 154, 58–71.
Sommer, S.G., 2001. Effect of composting on nutrient loss and nitrogen availability of cattle deep litter. Eur. J. Agron. 14, 123–133.
USDA, 2009. Dairy 2007 Part IV: Reference of Dairy Cattle Health and Management Practices in the United States, 2007. (https://www.aphis.usda.gov/animal_health/ nahms/dairy/downloads/dairy07/Dairy07_dr_PartIV.pdf).
USDA, 2016a. Milk Production. (http://usda.mannlib.cornell.edu/usda/current/ MilkProd/MilkProd-11-18-2016.pdf).
USDA, 2016b. Agriculture and Forestry Greenhouse Gas Inventory 1990–2013. Technical Bulletin Number 1943. Office of the Chief Economist, Climate Change Program Office (http://www.usda.gov/oce/climate_change/AFGG_Inventory/USDA_GHG_Inventory_ 1990-2013_9_19_16_reduced.pdf).
van der Stelt, B., van Vliet, P.C.J., Reijs, J.W., Temminghoff, E.J.M., van Riemsdijk, W.H., 2008. Effects of dietary protein and energy levels on cow manure excretion and ammonia volatilization. J. Dairy Sci. 91, 4811–4821.
Van Soest, P.J., Robertson, J.B., Lewis, B.A., 1991. Methods for dietaryfiber, neutral detergentfiber, and nonstarch polysaccharides in relation to animal nutrition. J. Dairy Sci. 74, 3583–3597.