IJPBCS
Effect of Nitrogen and Phosphorus Application on
Concentration and Uptake of Respective Element by
Wheat (Triticum aestivum L.) at North Shoa, Koticho
kebele, Central Highlands of Ethiopia
Alemu Dugassa Jorgo
Salale University, Department of Plant Science, Fiche, Ethiopia
Email: [email protected] Cell Phone: +251-912-214387 Fax: +251-111609320
Field study was conducted in 2015 cropping season in North Shoa, Central Highlands of Ethiopia. The objectives of the study were determining the N and P concentration in plant parts and their uptake by wheat. The treatment contained four level of N (0, 32, 64 and 96 kg/ha) and four level of P (0, 23, 46 and 69kg P2O5/ha) which were arranged in a randomized complete block design with three replications. The source of N and P were urea and TSP, respectively. Wheat variety, Digelu, was used as a test crop. Interaction of N by P produced highly significant difference on the concentration of N and P in the grain, concentration of P in the straw, P uptake by grain and total P uptake by wheat. Similarly, highly significant differences were observed on the concentration of N and P in the grain, concentration of N and P in the straw, P uptake by the grain, and total P uptake by wheat due to main effect N and P. Nitrogen uptake by straw and grain as well as total uptake were also highly significant only due to main effect N. Phosphorus uptake was only significant due to main effect N.
Key words: N concentration, P concentration, straw, grain, total uptake.
INTRODUCTION
Wheat is one of the most important cereal crops globally and is a staple food for about one third of the world’s population (Hussain et al., 2002). In Ethiopia, it is grown annually on 1.68 million ha with a total production of 3.08 million tons which makes the country the largest wheat producer in sub-Saharan Africa (CSA, 2010). However, low soil fertility, especially nitrogen (N) and phosphorus (P) deficiency, is one of the major constraints limiting wheat production in Ethiopian Highlands (Tanner et al., 1993; Teklu and Hailemariam, 2009).
Nitrogen is one of the most yield-limiting nutrients for crop production in the world. It is also the nutrient element applied in the largest quantity for most annual crops
(Huber and Thompson, 2007). Use of inorganic N fertilizers has had its most substantial beneficial effect on human health by increasing the yield of field crops and nutritional quality of foods needed to meet dietary requirements and food preferences for growing world populations (Galloway and Cowling, 2002; Galloway et al., 2002). Nitrogen plays a vital role in increasing the yield of a crop (Minale et al., 2005). High N supply favors the conversion of carbohydrates into proteins, which in turn, promotes the formation of protoplasm (Arnon, 1972). Nitrogen comprises 7% of total dry matter of plants and is a constituent of many fundamental cell components, such as nucleic acids, amino acids, enzymes, and photosynthetic pigments (Bungard et al., 1999).
International Journal of Plant Breeding and Crop Science
Vol. 5(1), pp. 335-343, February, 2018. © www.premierpublishers.org. ISSN: XXXX-XXXX
Phosphorus is the second most essential element for crop production and it is deficient in most soils around the world (Brady and Weil, 2002). It has been shown that adequate P enhances many aspects of plant physiology like fundamental process of photosynthesis, flowering, seed formation and maturation (Brady and Weil, 2002; Salisbury and Ross, 1992).
Nitrogen and P are considered as the most deficient nutrients in soils of Ethiopia (Asnakew et al., 1991; Anonymous, 2000). This indicates that N and P are the most yield limiting factors of cereals including wheat production.
Soil fertility status varies among adjacent farms or plots mainly due to individual farmer’s soil management practices. Productivity of the crop in the country is generally low compared to the potential of this crop. According to FAO (2002), declining of soil fertility has been identified as one of the most important constraints to limit food production in Ethiopia, in particular and in Africa in general. This low productivity can be enhanced through improved crop management practices, including application of fertilizers. Fertilizers play a pivotal role in increasing yield and improving the quality of crops. High yielding wheat varieties demand adequate nutrient supply to produce maximum grain yield (Ali and Yasin, 1991). Best experiences in some bread wheat producing areas of Ethiopia like Bale and Arsi zones showed that the yield of bread wheat can be maximized beyond 4 t/ha by using N and P fertilizers as high as 6-8 t/ha integrated with other better crop management options.
In view of the above findings, information related to N and P fertilizer recommendation in the study area is limited. Therefore, the objectives of this research were;
• To determine N and P concentration in wheat and their uptake by grain and straw
MATERIALS AND METHODS
Site Description
The experiment was conducted in 2015 cropping season at Koticho Kebele, central highlands of Ethiopia. It is located at 2,738 m above sea level. The soil of the experimental site is slightly acidic and has high organic matter content. The soil texture of an area is clayey. Eight years data from Ethiopian Meteorological Agency (2007- 2014) indicated that the area receives average annual rainfall of 1179.36 mm and has minimum and maximum temperatures of 8.29 and 20.50°C, respectively.
Experimental Materials
Improved variety of wheat, Digelu, released in 2005 by Kulumsa Agricultural Research Center, was used as a test
crop. Nitrogen and P fertilizers were applied in the form of urea and triple super phosphate (TSP), respectively.
Treatments and Experimental Design
The treatments consisted of factorial combinations of four levels of N (0, 32, 64 and 96 kg/ha) and four levels of P (0, 23, 46 and 69 P2O5 kg/ha) arranged in RCBD with three replications. Each plot consisted of 7 rows which are 20 cm apart and 3 m in length. Full dose of P (23, 46 and 69 P2O5 kg/ha) and half rate of N (16, 32 and 48 kg/ha) were applied to the soil at the time of sowing and the remaining half of N was applied at tillering stage.
Plant Sampling and Laboratory Analysis
Five plants along with their grains were taken from each treatment and placed in to separate plastic bag. It was then, labeled and transported to laboratory for further preparation. Surface contaminants, such as dust, were removed from the sample by washing it with 0.3% detergent solution. It was allowed to dry at a temperature of 60 to 70oC for 24 hours.
Concentration of N in grain and straw (%)
Kjeldahl procedure was used to determine total N in plant parts (straw and grain). Half gram finely ground sample was taken and placed in to digester. Then, it was digested with NaOH. Acid digest was transferred to micro-kjeldahl flasks using distilled water. Twenty ml boric acid solution was measured and transferred to erlenmeyer flask. Two drops of indicator solution was added to it and placed under condenser to prevent loss of ammonia. Seventy five ml of 40% NaOH was poured in to distillation flasks containing digests and mixed gently. It was immediately closed and then distillation started by heating the flask. After about 80 ml had collected, receiver flask was removed. Finally, the receiver flask solution was titrated with 0.1 N H2SO4 from green to a pink end point and the reading of the burette was recorded.
Concentration of P in grain and straw (%)
vanadate solution was added to it and kept for 10 minutes for the color to develop, finally, observance using spectrophotometer was read at a wave length of 460 nm.
Total uptake, grain uptake and straw uptake of N
Nitrogen uptake by plant parts was calculated by multiplying the dry weight of plant parts with their N concentration in those parts. Algebraically, it was represented as fallow;
NU (kg/ha) = dry weight of grain (kg/ha) x CNG (%) CNG- is the ratio of N accumulated in grain to dry weight of the grain
Where, NUG= N uptake by grain, CNG= concentration of N in grain.
NUS (kg/ha) =dry weight of straw (kg/ha) x CNS (%) CNS- is the ratio of N accumulated in straw to dry weight of the straw
Where, NUS= Nitrogen uptake by straw, SNC= Concentration of N in straw
TNU (kg/ha) = NUG (kg/ha) + NUS (kg/ha) Where, TNU= Total N Uptake
Total uptake, grain uptake and straw uptake of P Phosphorus uptake by plant parts was calculated by multiplying the dry weight of plant parts with their P concentration in those parts. Algebraically, it was represented as fallow;
PUG (kg/ha) = dry weight of grain (kg/ha) x CPG (%) Where, PUG= Phosphorus uptake by grain, CPG= Concentration of P in grain.
PUS (kg/ha) =dry weight of grain (kg/ha) x CPS (%) Where, PUS= P uptake by straw, CPS= Concentration of P in straw
TPU (kg/ha) = PUG (kg/ha) + PUS (kg/ha) Where, TPU= Total P Uptake
Data Analysis
Analyses of variances for the data recorded were done using GenStat program to determine the relationship
between yield and yield components due to application of N and P fertilizer rates. Least significant difference (LSD) test at 5% probability was used for mean separation when the analysis of variance indicated the presence of significant differences.
RESULTS AND DISCUSSION
Soil Physico-Chemical Properties of the Experimental Site
The soil of the study area is dominated by the clay fraction. High clay content might indicate better water and nutrient holding capacity of the soil in the study area. Soil reaction of the experimental site is moderately acidic, which is suitable range for most crops. The study area also has medium/moderate OM content and moderate total N and available P. Generally, the soil of the study area is found to be suitable for wheat production.
Concentration of nitrogen in wheat grain
The mean squares due to main effects and N × P interaction were highly significant (P < 0.01) for the concentration of N in wheat grains (Table 9).
Mean comparison indicated that highest N accumulation in grains (2.75%) was attained at 64/23 kg N/P2O5/ha, which was statistically similar with treatment combinations of 0/46 and 64/0 kg N/P2O5/ha. On the other hand, the lowest N accumulation was recorded for treatment combination of 0/69 kg N/P2O5/ha. This was also not significantly different from treatments supplied with 0/23, 32/23, 32/46,64/46 and 96/0 kg N/P2O5/ha (Table 1). This implies a positive response of grain N concentration to N and P rate, which might be due to NP supply resulted in increased uptake by root which increases its concentration in plant parts. In line with this, Dash et al. 2015 reported that grain N concentration was increased with NP application. Other studies have also found increased protein at greater NP application rates (Olesen et al., 2000; Campbell et al., 1977). Moreover, Halvorson et al., (2004) have indicated that grain protein content generally increased with increasing N rate.
Table 1: Concentration of N in wheat grains (%) as affected by interaction of Nand Prates
N (kg/ha)
P2O5 (Kg/ha)
Mean
0 23 46 69
0 2.26cd 2.07abc 2.65f 1.92a 2.23
32 2.39de 2.07abc 2.06abc 2.15bc 2.17
64 2.60ef 2.75f 2.00ab 2.38d 2.43
96 2.10abc 2.37d 2.13bc 2.22cd 2.21
Mean 2.34 2.32 2.21 2.17
LSD (5%) 0.21
CV (%) 5.60
SEM (±) 0.07
Table 2: Concentration of N in wheat straw as affected by N and P application
N (Kg/ha) Concentration of N in straw (%)
0 0.31a
32 0.43b
64 0.489bc
96 0.494c
P2O5 (kg/ha)
0 0.38a
23 0.41ab
46 0.48c
69 0.45bc
LSD (5%) 0.06
CV (%) 16.20
SEM (±) 0.02
Means followed by the same letters for a variable are not significantly different (P < 0.05).
Table 3: Concentration of P (%) in wheat grains as affected by interaction of N and Prates
N (kg/ha)
P2O5 (Kg/ha)
Mean
0 23 46 69
0 0.28a 0.48f 0.47f 0.36d 0.40
32 0.30b 0.44e 0.60h 0.48f 0.46
64 0.32c 0.52g 0.48f 0.64i 0.49
96 0.28a 0.28a 0.28a 0.66j 0.38
Mean 0.30 0.43 0.46 0.54
LSD (5%) 0.02
CV (%) 2.20
SEM (±) 0.01
Means followed by the same letters are not significantly different (P < 0.05).
Concentration of nitrogen in straw of wheat
There were highly significant (P<0.01) differences due to main effects, but non-significant differences were observed due to N x P interaction on N concentration in straw (Table: 9).
The concentration of N in straw increased significantly with the increase in N and P2O5 application, over the control. The N concentration of straw varied from 0.31% to 0.49% due to N application. The highest straw N concentration (0.494%) due to main effect of N was observed in treatment of 96 kg N/ha. The next highest straw N concentration (0.489%) was obtained at 64 kg N/ha and both were significantly higher than 0 N application. The lowest straw N concentration (0.31%) was obtained from 0 N treatments. The straw N concentration ranged from 0.38% to 0.48% due to main effect of P. The highest N content (0.48%) was observed for 46 P2O5 kg/ha, which was statistically the same with 69 kg P2O5/ha. The lowest N concentration (0.38%) was found for treatment with 0 P2O5/ha (Table 2). This implies that concentrations of N in the wheat straw varied in relation to the amount of N and P applied to the soil. This might be due to the fact that increase in N supply resulted in increased uptake by root which increases its concentration in plant parts and increase in P level also resulted in increase in N in plant parts due to synergetic relation between the two elements. The result was in agreement with the findings of Parvez et al. (2008) who showed that maximum N concentrations in straw was 6.13 g/kg when the crop was supplied with 180 kg N/ha and the lowest N concentration (1.6 g/kg) in straw was, however, recorded for the control treatment. Raghbir et al. (2004) have also observed that N concentration of
wheat grain and straw increased significantly and subsequently with increasing doses up to 40 mg P/kg soil application. Similar results were also reported by Rahman et al. (2005) and Yohannes (2014).
Concentration of P in wheat grains
The concentration of P in wheat grain was significantly (P<0.01) affected by the main effects and interactions of N and P (Table: 9).
Table 4: Concentration (%) of P in wheat straw as affected by the interaction of N and P
N (kg/ha)
P2O5 (Kg/ha)
0 23 46 69
0 9.33x10⁻²abcd 17.67x10⁻²g 12.00x10⁻²cde 7.67x10⁻²a
32 11.00x10⁻²bcde 14.00x10⁻²ef 16.00x10⁻²fg 14.00x10⁻²ef
64 8.33x10⁻²ab 14.00x10⁻²ef 8.00x10⁻²ab 8.67x10⁻²ab
96 9.00x10⁻²abc 8.67x10⁻²ab 12.33x10⁻²de 8.67x10⁻²ab
LSD (5%) 3.12x10⁻²
CV (%) 16.70
SEM (±) 1.08x10⁻²
Means followed by the same letters are not significantly different (P < 0.05).
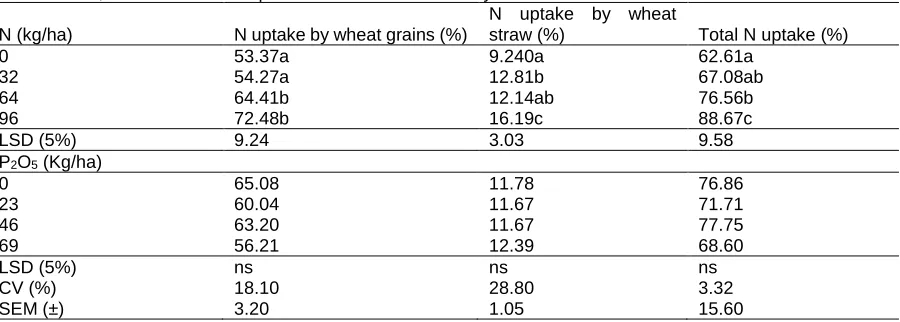
Table 5: Grain, straw and total N uptake of wheat as affected by N and P rates
N (kg/ha) N uptake by wheat grains (%)
N uptake by wheat
straw (%) Total N uptake (%)
0 53.37a 9.240a 62.61a
32 54.27a 12.81b 67.08ab
64 64.41b 12.14ab 76.56b
96 72.48b 16.19c 88.67c
LSD (5%) 9.24 3.03 9.58
P2O5 (Kg/ha)
0 65.08 11.78 76.86
23 60.04 11.67 71.71
46 63.20 11.67 77.75
69 56.21 12.39 68.60
LSD (5%) ns ns ns
CV (%) 18.10 28.80 3.32
SEM (±) 3.20 1.05 15.60
ns= non significant differences among treatment means; Means followed by the same letters with in a column for a given treatment level are not significantly different (P < 0.05).
Concentration of P in straw of wheat
The main effect of N and P as well as their interaction resulted in highly significant (P < 0.01) differences in concentration of P in wheat straw (Table: 9).
The concentration of P was the highest (17.67x10⁻²%) in straws for 0/23 kg/ha N/P2O5,which was not statistically different from treatments supplied with 32 kg N and 46 kg P2O5/ha. On the other hand, lowest concentration (7.67x10⁻²%) was recorded for plots fertilized with 0 N and 69 kg P2O5/ha. However, the results obtained from treatment combinations of 64/46, 64/69, 96/69, 96/23, 96/0 and 64/0 kg/ha N/ P2O5 and control (0/0) were not significantly different from the lowest value and from each other (Table 4). In agreement with this result, the findings of Kabir et al. (2011) indicated that highest P concentration in wheat straw was observed for treatments fertilized with 40/20 kg N/P /ha and the lowest P concentration in straw was found in the control treatment. Dash et al. (2015) also reported that content of P varied from 0.12% to 0.18% in straw with fertilizers containing N and P whereas skipping the P application, although the soil is rich in available P, influence its accumulation.
Nitrogen uptake by wheat grains
Nitrogen uptake by grains was significantly (P<0.01) affected by N fertilizer application. However, there was no significant effect due to P and interaction between N and P (Table: 9).
The highest (72.48 kg/ha) and lowest (53.37 kg/ha) N uptake was obtained due to 96 and 0 kg N/ha, respectively. Uptake by 64 and 96 kg N/ha was significantly higher than 0 and 32 kg N/ha. Grain N uptake of wheat with 96 kg N/ha was 26.37% more than those with 0 kg N/ha. However, the result was par with the next higher level of N (64 kg N/ha). Similarly, 0 and 32 kg N/ha also did not significantly differ from each other. The result further illustrated that increased N rates resulted in increased N uptake by grains (Table 5). Since the grain is the main sink for N after anthesis, the sources of grain N are the vegetative organs which accumulate N prior to grain filling and N uptake during the grain-filling period (Cox et al., 1985). In line with this, N uptake was significantly decreased in absence of N as compared to P. Muhammad et al. (2011) and Genene (2003) obtained similar results showing that N uptake by wheat genotype was enhanced varying from 36.5 to 139.8 kg/ha as N application rate increased from 120 to 180 kg/ha.
Nitrogen uptake by wheat straw
Nitrogen uptake due to main effect of N was highly significant (P<0.01). However, there was non-significant difference due to main effect of P and its interaction with N (Table: 9).
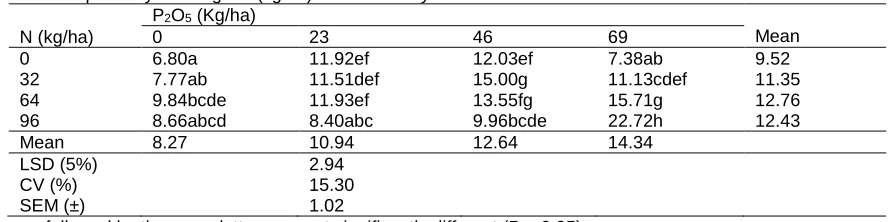
Table 6: P uptake by wheat grain (kg/ha) as affected by interaction of N and P
N (kg/ha)
P2O5 (Kg/ha)
Mean
0 23 46 69
0 6.80a 11.92ef 12.03ef 7.38ab 9.52
32 7.77ab 11.51def 15.00g 11.13cdef 11.35
64 9.84bcde 11.93ef 13.55fg 15.71g 12.76
96 8.66abcd 8.40abc 9.96bcde 22.72h 12.43
Mean 8.27 10.94 12.64 14.34
LSD (5%) 2.94
CV (%) 15.30
SEM (±) 1.02
Means followed by the same letters are not significantly different (P < 0.05).
par with 64 kg N/ha (Table 5). Muhammad et al (2011) have reported that N uptake by a wheat genotype was enhanced varying from 36.5 to 139.8 kg/ha as N application rate increased from 120 to 180 kg/ha. Similarly, Yohannes (2014) reported that the uptake of N by wheat and concentration in the tissues were increased by increase in N levels.
Total N uptake by wheat
The main effect of N fertilizer was highly significant (P<0.01) for total N uptake. However, P application and its interaction with N did not affect this parameter (Table: 9). The range of total N uptake by wheat due to main effect of N was 62.61 to 88.67 kg/ha. The highest total N uptake (88.67 kg/ha) was recorded for 96 kg N /ha, while the lowest value (62.61 kg/ha) was found for 0 N/ha (Table 5). The result showed that total N uptake both by grain and straw was more significantly increased with increased application of N fertilizer. Osaki et al. (1992) and Shinano et al. (1994) reported that the amount of N accumulated in cereal and legume species showed a highly positive correlation with the total dry matter production at harvest. These authors further reported that N accumulation is one of the most important factors in improving yield of field crops. This may probably be due to application of N creates concentration gradients inside and outside plant system which force it to move from the soil in to plant system and then increases its uptake by plant. This result is also supported by the findings of Bereket et al. (2014) who reported that total N and P uptakes of wheat increased with increasing rates of N and P, respectively. Similar result has also been reported by Willington and Biscoe (1984) who indicated that as the N rate increases to the level of 138 kg/ha the total uptake of N by plant also increased.
Phosphorus uptake by wheat grains
The main effects and their interaction produced highly significant differences (<0.01) in phosphorus uptake by grains (Table: 9).
The results presented in Table 6 showed that P uptake of grains differed significantly due to different treatment combinations, with the range varied from 6.8 to 22.7 kg P2O5/ha. The highest P uptake (22.7 kg P2O5/ha) was
recorded for the treatment with 96 kg N and 69 kg P2O5/ha, and was statistically different from the rest of treatment combinations. The lowest P uptake was recorded from control treatment (Table 6). It was found that each additional level of P along with N had increased its uptake by wheat grains. This result was also closely related to the findings of Kabir et al. (2011) who reported that the highest P uptake (8.14 kg/ha) by grain was recorded for the treatment receiving N/P of 100/30 kg/ha, whereas the lowest P uptake was recorded for the control treatment. It is also in agreement with those findings reported by Van Keulen and Stol (1991).
Phosphorus uptake by wheat straw
Phosphorus uptake due to main effect of N showed significant (P<0.05) difference. However, application of P and its interaction with N did not affect this parameter (Table: 9).
The highest P uptake (4.06 kg/ha) was recorded from 32 kg N/ha, which was statistically at par with the values recorded for the control and 96 kg N /ha. On the other hand, the lowest P uptake (2.42kg/ha) was recorded from 64 kg N/ha, which was also not significantly different from 96 kg N/ha. Even though total P uptake by straw of wheat was non-significant due to main effect of P, compared to the control treatment, the uptake was a little bit higher at higher P level except for 69 kg P2O5/ha (Table 7). In line with this, Bereket et al. (2014) indicated N and P uptakes of wheat increased with an increasing rate of respective nutrients. Similarly, Muhammad et al. (2011) also reported that uptake of both N and P was significantly affected by their respective fertilizer rates.
Table 7: Phosphorus uptake by wheat straw (kg/ha) as affected
by N and P application
N Rate (kg/ha) P uptake by wheat straw (kg/ha)
0 3.35b
32 4.06b
64 2.42a
96 3.26ab
LSD (5%) 0.92
CV (%) 33.70
SEM (±) 0.32
Total P uptake by wheat
The analysis of variance indicated that total P uptake (straw + grain uptake) was significantly (P<0.01) affected by N or P as well as with the interaction of N and P fertilizers (Table: 9).
Total P uptake by both grain and straw ranged from 9.45 to 25.22 kg/ha. The greatest quantity of P uptake (25.22 kg/ha) was recorded for 96/69 kg N/P2O5/ha which was significantly different from other treatment combinations. The lowest total P uptake by wheat was recorded for the
control plot, which was statistically at par with treatment combinations of 0/69, 96/46, 64/0, 96/23, 32/0 and 96/0 kg N/P2O5/ha (Table 8). The results further revealed that P uptake by wheat was higher at higher N and P combinations. This might probably be attributed to the fact that synergetic relation of P and N in uptake by the plant. In agreement with the present result, Kabir et al. (2011) have reported that the highest total P uptake by wheat was recorded in treatment receiving N/P of 140/40 kg/ha whereas the lowest value was recorded for the control treatment.
Table 8: Total P uptake (kg/ha) by wheat as affected by interaction of N and P fertilization
N (kg/ha)
P2O5 Rate (kg/ha)
Mean
0 23 46 69
0 9.45a 16.21efg 16.16efg 9.69a 12.88
32 11.03ab 15.69def 19.43g 15.5cdef 15.41
64 11.99abc 15.53def 15.6def 17.6fg 15.18
96 12.36abcd 11.16ab 14.04bcde 25.22h 15.70
Mean 11.21 14.65 16.31 17.00
LSD (5%) 3.531
CV (%) 14.3
SEM (±) 1.222
Variable means followed by the same letters are not significantly different (P < 0.05) according to LSD Tests.
Table 9: ANOVA showing mean squares for grain and straw N and P concentration and uptake (x10-2)
Characters (a) N (3) P(3) N X P (9) Error (30)
CNG 16.831** 8.16** 21.81** 1.61
CPG 33.32** 11.60** 3.85** 0.01
CNS 9.23** 2.64** 1.01ns 0.49
CPS 0.45** 0. 47** 0. 19** 0.06
NUS 9776.00** 2162.00ns 993.00ns 1319.00
NUG 98760.00** 18120.00ns 23390.00ns 12280.00
TNU 159670.00** 22570.00ns 25210.00ns 13210.00
PUS 144124.00* 44054.00ns 28753.00ns 5874.00
PUG 2540.80** 7808.60** 4437.60** 310.60
TPU 136230.00** 848810.00** 619020.00** 39330.00
**, *= highly significant (P<0.01) and significant (P< 0.05) respectively, ns= non-significant; (a) = Number in parenthesis shows degree of freedom for respective source of variation; CNG= Concentration of N in wheat grain, CPG= Concentration of P in wheat grain, CNS= Concentration of N in wheat straw, CPS= Concentration of P in wheat straw, NUG= Nitrogen uptake by wheat grain, PUG= Phosphorus uptake by wheat grain, NUS= Nitrogen uptake by wheat straw, PUS= Phosphorus uptake by wheat straw, TNU= Total N uptake, TPU= Total P uptake.
CONCLUSIONS
Analysis of variance for N concentration revealed that there were highly significant (P < 0.01) differences among the treatment combinations for concentration of N and P in grains. Main effect of N or P also showed highly significant (P<0.01) differences for N concentration in the straw, but non-significant differences was observed due to interaction. Similarly, there were highly significant (P<0.01) differences for grain P concentration due to treatment combinations. But, non-significant difference was observed for straw P content due to interaction as well as main effect of N or P.
There were also highly significant (P<0.01) differences for total N uptake, grain N uptake and straw N uptake due to main effect of N. The main effect of P and its interaction with N had no significant difference for those parameters. Highly significant (P<0.01) differences were also observed in P uptake by wheat grain due to interaction between N
and P and significant (P<0.05) difference in total P uptake by straw due to main effect of P. However, there was non-significant difference in P uptake by straw due to treatment interaction and main effect of P.
Based on the results of this study, it could be concluded that application of N fertilizer at the rate of 96 kg/ha resulted in the highest N uptake. The highest total P uptake was recorded from 96 kg N/ha by 69kg P2O5/ha.
ACKNOWLEDGMENTS
REFERENCES
Ali, R. and M. Yasin. 1991. Response of wheat to nitrogen and phosphorus Chhonkar P.K. and Tilak B.R.1997. Biofertilizers for sustainable agriculture gaps and future needs. In: Efficiency and Policy Issues, Pp: 52–66. Plant Nutrient Needs and Supply, 2000– 2025.
Anonymous. 2000. Agro-Ecological Zonation of Ethiopia. Ministry of Agriculture A.A, Ethiopia. January, 2014. Arnon I. 1972. Plant Population and Distribution Patterns
in Corp Production in Dry Regions. Vol. 1. Islamabad, Pakistan: National Book Foundation;. pp. 359–360.pp. 443–456.
Asnakew Woldeab, Tekalign Mamo, Mengesha Bekele and Tefera Ajamo. 1991. Soil fertility management studies on wheat in Ethiopia. pp.137-172. In: Hailu Gebre Mariam, D.G. Tanner and Mengistu Hulluka (eds.). Wheat Research in Ethiopia: A historical perspective. Addis Ababa, IAR/CIMMYT.
Bereket Haileselassie, Dawit Habte, Mehretab Haileselassie and Gebremedhin Gebremeskel. 2014. Effects of mineral nitrogen and phosphorus fertilizers on yield and nutrient utilization of bread wheat (Tritcum aestivum) on the sandy soils of Hawzen District, Northern Ethiopia. Agriculture, Forestry and Fisheries. 2014; 3(3): 189-198.
Brady, N.C. and Weil, R.R. 2002. The Nature and Properties of Soils. 13th Edition, Prentice Hall, New Jersey. Pp. 543-596.
Brady, N.C. and Weil, R.R. 2004. The nature and properties of soil. (13th ed.). Person Education Ltd, USA.621p.
Bungard, RA, Wingler A., Morton JD. and Andrews M. 1999. Ammonium can stimulate nitrate and nitrite reductase in the absence of nitrate in Clematis vitalba. Plant Cell and Environment. 22:859–866. doi: 10.1046/j.1365-3040.1999.00456.
Campbell, C.A., H.R. Davidson and Warder F.G. 1977. Effects of fertilizer and soil moisture on yield, yield components, protein content and N accumulation in the aboveground parts of spring wheat. Can. J. Soil. Sci. 57: 311-327.
Cox, M. C., C. O. Qualset and Rains, D. W. 1985. Genetic variation for nitrogen assimilation and translocation in wheat. I. Dry matter and nitrogen accumulation. Crop Sci. 25:430–435. Central Statistical Agency (CSA). 2010. Agricultural sample survey 2009/10. Report on area production of crops (private peasant holdings, Meher Season). The FDRE statistical bulletin Vol. 391, Addis Ababa, Ethiopia, 79 p.
Dash A.K., H.K. Singh, T. Mahakud, K.C. Pradhan and D. Jena. 2015. Effect of Nitrogen, Phosphorus, Potassium with Sulphur, Boron and Zinc on Yield and Nutrient Uptake by Rice Under Rice - Rice Cropping System in Inceptisol of Coastal Odisha. International Research Journal of Agricultural Science and Soil Science (ISSN: 2251-0044) Vol. 5(1) pp. 14-21.
FAO (Food and Agriculture Organization of the United Nations). 2002. FAO production yearbook 56.FAO Statistics Series, no 17. Rome. fertilization. Pakistan J. Agri. Res., 12: 130–3.
Galloway, J.N. and Cowling, E.B. 2002. Reactive nitrogen and the world: 200 years of change. Ambio. 31:64–71. Galloway, J.N., E.B. Cowling, S.P. Seitzinger and
Socolow, R.H. 2002. Reactive nitrogen: Too much of a good thing? Ambio 31:60–63.
Genene Gezu, 2003. Yield and quality response of bread wheat varieties to rate and time of nitrogen fertilizer application at Kulumsa, southern Ethiopia. MSc Thesis, Alemaya University, Alemaya Ethiopia.
Halvorson, AD., Nielson, DC. and Reule, CA. 2004. Nitrogen fertilization and rotation effects on notill dryland wheat production. Agron. J. 96:1196-1201. Huber, D.M. and Thompson, I.A. 2007. Nitrogen and plant
disease. pp. 31-44. In: L.E. Datnoff, W.H. Elmer, and D.M. Huber (eds.). Mineral nutrition and plant disease, St. Paul, MN: The American Phytopathological Society. Hussain, M. I., Shah, S. H. 2002. Growth, yield and quality
response of three wheat (Triticum aestivum L.) varieties to different levels of N, P and K. Int. J.of Agri. and Bio., 4(3), 362-364.
Kabir, M. H., N. M. Talukder, M. J. Uddin1, H. Mahmud1 and Biswas, B. K. 2011. Total Nutrient Uptake by Grain plus Straw and Economic of Fertilizer Use of Rice Mutation STL-655 Grown under Boro Season in Saline Area. Department of Agriculture Chemistry, BAU, Mymensingh, UAO, DAE. J. Environ. Sci. & Natural Resources, 4(2): 83-87, 2011.
Ma, B.L., W. Yan, L.M. Dwyer, J. Fregeau-Reid, H.D. Voldeng, Y. Dion and H. Nass. 2004. Graphic analysis of genotypes, Environment, Nitrogen Fertilizer and their interaction on spring wheat yield. Agron. J., 96: 169-180.
Minale Liben, Alemayehu Assefa and Tilahun Tadesse. 2005. The response of bread wheat to nitrogen and phosphorous fertilizer at different agro-ecologies of North Western Ethiopia. Pp 315-319.
Muhammad, Y.M., Parvez, K., Muhammad, I., Javaid, A.S. and Nizamuddin D. 2011. Response of candidate wheat variety ‘nia-8/7’ to different levels/ratios of nitrogen and phosphorus. Pak. J. Bot., 43(4): 1959-1963, 2011.
Olesen, J.E., J.V. Mortensen, L.N. Jørgensen and M.N. Andersen. 2000. Irrigation strategy, nitrogen application and fungicide control in winter wheat on a sandy soil. I. Yield, yield components and nitrogen uptake. J. Agric. Sci, Cambridge 134: 1-11.
Osaki, M., T. Shinano and T. Tadano. 1992. Carbon-nitrogen interaction in field crops production. Soil Sci. Plant Nutr. 38:553–564.
phosphorus ratios on the performance of wheat cultivar ‘khirman, Sarhad J. Agric. Vol.24, No.2: 233-239. PPI (Phosphate and Potash institute). 1995. International
Soil Fertility Manual. 655 Engg. Drive, Suite 110, Norcross, GA, 30092-2843, USA.
Raghbir, S., Bhadra, S. K., Mohinder, S. and Dixit, M. L. 2004. Effect of applied phosphorus on yield, elemental composition and establishment of its critical limit for wheat. Annals of Agri Bio Res. 9(1): 107-11.
Rahman, M. M., Sarker, M.N.H., Aktar, F.M.F. and Masood, M.M. 2005. Comparative yield performance of two high yielding rice varieties to different nitrogen’s levels, Bangladesh J. Crop. Sci., 16(1):73-78.
Salisbury, F.B. and C.W. Ross. 1985. Growth and development. In Plant Physiology. Wadsworth, Belmont, CA, pp. 290–308.
Salisbury, F.N. and C.W. Ross. 1992. Plant Physiology. 4th ed. Wads Worth Publishing Company, Belmant, California.
Shinano, T., M. Osaki, S. Yamada and T. Tadano. 1994. Comparison of root growth and nitrogen absorbing ability between gramineae and leguminosae during the vegetative stage. Soil Sci. Plant Nutr. 40:485–495. Tanner, D., Amanuel, G., Asefa, T. 1993. Fertilizer effect
on sustainability in the Wheat based smallholder-farming systems of southeastern Ethiopia. Field Crops Res. 33, 235-248.
Teklu, E., Hailemariam, T. 2009. Agronomic and economic efficiency of manure and urea fertilizers use on vertisols in ethiopian highlands. J.Agri. Sci. 8(3), 352-360. Tisdale, S.L., W.L. Nelson, J. D. Beaton and J.L. Havlin.
1993. Soil Fertility and Fertilizers (5th ed.). Macmillan Publishing Company, USA.
Van Keulen, H. and W. Stol. 1991. Quantitative aspects of nitrogen nutrition in crops. Fert. Res., 27: 151-160. Yohannes Erkeno. 2014. Effect of rates and time of
nitrogen application on growth, yield, and grain protein of bread wheat (Triticum aestivum L.) in Eastern Hararghe, Ethiopia. M.Sc. Thesis, Haramaya University, Ethiopia.
Willington, B.A. and Biscoe, P.V. 1984. Effects of N on the growth and development of winter wheat 131-132. In: the nitrogen requirement of cereals. MOA fishers and food reference book 385, London.
Accepted 16 October, 2017.
Citation: Jorgo AD (2018). Effect of Nitrogen and Phosphorus Application on Concentration and Uptake of Respective Element by Wheat (Triticum aestivum L.) at North Shoa, Koticho kebele, Central Highlands of Ethiopia. International Journal of Plant Breeding and Crop Science, 5(1): 335-343.