Vol.8 (2018) No. 4-2
ISSN: 2088-5334
Redefining Selection of Features and Classification Algorithms
for Room Occupancy Detection
Nor Samsiah Sani
#,
Illa Iza Suhana Shamsuddin
#,
Shahnorbanun Sahran
#, Abdul Hadi Abd Rahman
#,
Ereena Nadjimin Muzaffar
##
Center for Artificial Intelligence Technology, Faculty of Information Science and Technology, Universiti Kebangsaan Malaysia, Bangi, Selangor, Malaysia
E-mail: [email protected], [email protected], [email protected], [email protected], [email protected]
Abstract—The exponential growth of todays technologies has resulted in the growth of high-throughput data with respect to both dimensionality and sample size. Therefore, efficient and effective supervision of these data becomes increasing challenging and machine learning techniques were developed with regards to knowledge discovery and recognizing patterns from these data. This paper presents machine learning tool for preprocessing tasks and a comparative study of different classification techniques in which a machine learning tasks have been employed in an experimental set up using a data set archived from the UCI Machine Learning Repository website. The objective of this paper is to analyse the impact of refined feature selection on different classification algorithms to improve the prediction of classification accuracy for room occupancy. Subsets of the original features constructed by filter or information gain and wrapper techniques are compared in terms of the classification performance achieved with selected machine learning algorithms. Three feature selection algorithms are tested, specifically the Information Gain Attribute Evaluation (IGAE), Correlation Attribute Evaluation (CAE) and Wrapper Subset Evaluation (WSE) algorithms. Following a refined feature selection stage, three machine learning algorithms are then compared, consisting the Multi-Layer Perceptron (MLP), Logistic Model Trees (LMT) and Instance Based k (IBk). Based on the feature analysis, the WSE was found to be optimal in identifying relevant features. The application of feature selection is certainly intended to obtain a higher accuracy performance. The experimental results also demonstrate the effectiveness of Instance Based k compared to other ML classifiers in providing the highest performance rate of room occupancy prediction.
Keywords—feature selection; machine learning; classifications; algorithms; MLP; LMT; IBk.
I. INTRODUCTION
The evolution of IoT devices and wireless sensors today has brought a great impact in data collection, thus producing vast amount of raw data sets that are rich in information and sometimes contain far too many attributes or features for learning models to handle, therefore creates high dimensionality data[1]. Feature selection is an important task in machine learning especially when dealing with high dimensional space of features and noisy data [2]. Making the right or best selection about which features to choose to contribute the most to the prediction variable or target output is important in building an effective and efficient predictive model [3]. The importance of performing feature selection before modelling any data set can contribute towards improving modelling accuracy, less opportunity to make decisions based on noisy data and faster computational time to train models [4]. Furthermore, feature selection must not be confused with dimensionality reduction, where the latter
involves encoding mechanisms used to reduce the data set size[5]. The methods for feature subset selection algorithms can be divided into filters, wrappers and embedded approaches [6]. Filters based method depends on the general characteristics of the training data set to select or exclude features and is carried out as a preprocessing task that filters out irrelevant attributes, while wrapper method depends on the learning algorithm and uses the model to evaluate the subset of features for feature selection. On the other hand, embedded methods perform feature selection during the training process of the classifier by achieving model fitting and feature selection simultaneously.
classifiers such as neural network, decision tree and K-nearest neighbours. This paper is organized as follows. In Section 2, the general concept of machine learning and related works based on Occupancy Detection dataset are described. Next, Section 3 describes with detail the empirical methodology proposed to compare feature selection methods against the performance of classification algorithms chosen. Finally, Sections 4 and 5 describe the results and the conclusions reached, respectively.
Machine learning is a subfield of Artificial Intelligence (AI). Machine learning brings the promise to derive meaning from data generated not only by human, but also computers and other electronic devices. It offers tools and technology to be utilized to answer questions with data, create amazing products and user experiences which are prevalent in products like Google Search, Google Glass, conversational agents, recommender systems and many more. As the volume of data exceeds the ability of human to derive meaning of it, machine learning allows computer to learn from the data and more importantly, to identify the changes in data to discover new knowledge. Machine learning has empowered various smart applications in computers, and if a computer can improve how it performs a certain task based on past experience, then the machine has learned. Thus, machine learning is about using an automated system and learning to do better in the future based on what was experienced in the past ([7]-[12]). This study aims to investigate the performance of machine learning technique which includes feature selection and classification algorithms based on the use of the Occupancy Detection data set. A number of researches on the use of the data set has also been reported in literature. Brief summary of each work is described in this section.
In machine learning, dimensionality reduction can be divided into feature selection and feature extraction as the process of removing irrelevant or partially relevant features that can negatively impact model performance ([13], [14]). An alternative method of feature extraction using only the Occupancy Detection training set of 8143 instances has been proposed [15]. This method which is similar to Principal Component Analysis (PCA), extract features that minimizes the Bayes error rate instead of features that maximizes the variance. Experimental result showed that the proposed method is improved with accuracy of 96.1% compared to PCA with accuracy of 95.8% by extracting three discriminant features when using Linear Discriminant classifier.
In a study to determine the most suitable machine learning method, the main purpose was to validate the applicability and the success rate of Recurrent Extreme Learning Machines (RELM) built to improve the learning methodology in training recurrent type single hidden neural network in detecting occupancy in building management. RELM showed the highest accuracy levels compared to the results obtained by ELM and other reported results found in related literature [16].
In comparing classification models performance, it is reported that the highest accuracies, ranging from 95% to 99% of the occupancy room prediction have been obtained from training classification models using R program namely LDA (Linear Discriminant Analysis), CART (Classification
and Regression Trees), Gradient Boosting Machines (GBM) and RF (Random Forest) respectively [16]. However, the classification models (LDA, GBM, RF) employed were not compared with different approaches in which the models were not evaluated and reported in all the preceding literature. The researchers also reported that when logistic regression models were developed and tested, the algorithms however did not converge. When comparing results of CART models against the Decision Trees models reported in the preceding literature, it is not possible to fully compare the models’ performance as the experimental data from previous research is not available, along with the testing conditions, metering equipment and the model implementations are not the same. In conclusion of their work, it is stated that the measurement readings can be affected each time the sensors are relocated, thus resulting in the models needing to be retrained. The results show that an appropriate selection of features and classification models are significant on the accuracy prediction, and interestingly reported that by using only one predictor that is temperature, the LDA model was able to estimate the occupancy with accuracies of 85% and 83% in the two testing sets.
However, feature selection was not extensively investigated in studies mentioned above. Feature selection is considered to be an important criteria for machine learning accuracy. Thus, feature selection methods and comparative analysis on learning models are more comprehensively studied in this paper.
II. MATERIAL AND METHOD
An experimental design methodology is used in this study following the machine learning processes shown in Figure. 1.
Fig. 1 Machine learning processes
A. Data set Description
The Occupancy Detection data set is obtained from the UCI Machine Learning Repository website [17]. The source of the data set is contributed by Luis M. Candanedo, a researcher from Thermal Engineering and Combustion Laboratory, University of Mons, (UMONS) Belgium. The dataset is an experimental data used for binary classification to detect an office room occupancy based on the room’s temperature, humidity, light and carbon dioxide (CO2) level
The data set is organized into three sets in which one is used for training, and two are for testing the classification models during occupancy. The distribution of the data sets with its number of instances and binary classification are summarized in Table 2.
TABLEI DATA SET DESCRIPTION
Data set Characteristics Multivariate, Time-Series
Number of Instances 20560
Area Computer
Attribute
Characteristics Real
Number of Attributes 7
Date Donated 2/29/2016
Associated Tasks Classification
Missing Values N/A
Number of Web Hits 70017
TABLEII DATASET DISTRIBUTION
Dataset Number of Instances
Binary Classification
0 (Not Occupied)
1 (Occupied) Training
Set
8143 6414 (0.79 %)
1729 (0.21 %) Test Set 1 2665 1693
(0.64 %)
972 (0.36 %) Test Set 2 9752 7703
(0.79 %)
2049 (0.21 %)
B. Data Preprocessing
In this study, Weka is used as the data preprocessing and machine learning tool. Data preprocessing includes data cleaning, data normalization, data transformation, and data reduction as part of knowledge discovery process ([18]-[19]). For this study, three sets of files in which one used for training and two for testing have been merged for further use in this section.
1) Descriptive Data Summarization and Data Visualization in Weka: The Weka Explorer automatically
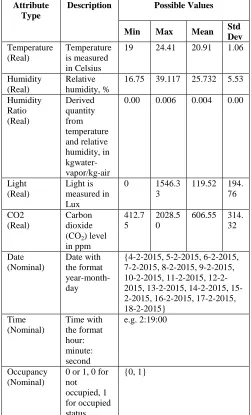
calculate descriptive statistics for numerical attributes which helps to identify the data properties and to highlight noise or outliers. The detailed description of the data set is provided in Table 3.
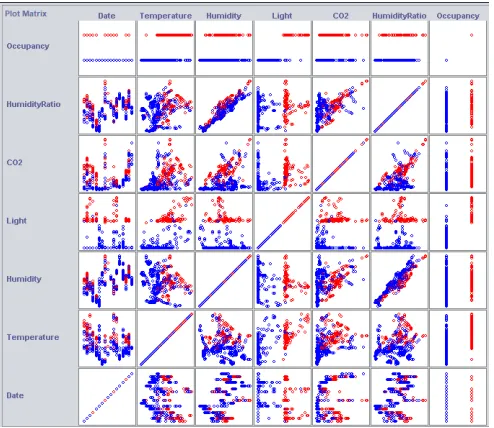
The scatter plot visualization in Figure 2 provides the analysis of the pairwise relationships between attributes. This is useful to identify any patterns in the relationship between the attributes, such as positive or negative correlations.
TABLEIII
DESCRIPTION OF THE ATTRIBUTES USED FOR CLASSIFICATION
Attribute Type
Description Possible Values
Min Max Mean Std Dev Temperature
(Real)
Temperature is measured in Celsius
19 24.41 20.91 1.06
Humidity (Real)
Relative humidity, %
16.75 39.117 25.732 5.53
Humidity Ratio (Real)
Derived quantity from temperature and relative humidity, in kgwater-vapor/kg-air
0.00 0.006 0.004 0.00
Light (Real)
Light is measured in Lux
0 1546.3 3
119.52 194. 76
CO2 (Real)
Carbon dioxide (CO2) level in ppm
412.7 5
2028.5 0
606.55 314. 32
Date (Nominal)
Date with the format year-month-day
{4-2-2015, 5-2-2015, 6-2-2015, 7-2-2015, 8-2-2015, 9-2-2015, 10-2-2015, 11-2-2015, 12-2-2015, 13-2-12-2-2015, 14-2-12-2-2015, 15-2-2015, 16-15-2-2015, 17-15-2-2015, 18-2-2015}
Time (Nominal)
Time with the format hour: minute: second
e.g. 2:19:00
Occupancy (Nominal)
0 or 1, 0 for not occupied, 1 for occupied status
{0, 1}
1) Noisy Data: In a measured numerical attribute, a random error or variance is considered as noisy data [20]. Based on Table 3, the Occupancy dataset might have values that seems to be an anomaly. The Unsupervised Attribute Interquartile Range filter is applied to detect the outliers. Table 4 shows the outlier and extreme values that can be removed.
Fig. 2 Occupancy dataset scatter plot matrix
TABLEIV OUTLIER AND EXTREME VALUES
Attribute Label Count
Outlier No Yes
20418 142 Extreme
Value
No Yes
20560 0
TABLEV NORMALIZED ATTRIBUTES
Attribute Possible Values
Min Max Mean StdDev
Temperature 0 1 0.352 0.20 Humidity 0 1 0.479 0.22 Humidity Ratio 0 1 0.409 0.20 Light 0 1 0.077 0.12
CO2 0 1 0.167 0.19
3) Feature Engineering: Feature engineering is the task of improving predictive modelling performance on unseen data by transforming raw dataset feature space to generate new ones [28]. Three features from the Occupancy dataset are identified to represent the best possible solution in the classification tasks mainly in performance measures and predictive modelling chosen. For example, the attribute Light is more likely to represent a room occupancy, such that either the room’s light is switch ‘on’ or ‘off’ respectively. Week status can determine either a room is occupied during ‘weekday’ or ‘weekend’, and Time Format can be represented as ‘PM’ or ‘AM’ during occupancy. Table 6 shows the possible solution for the feature engineering.
TABLEVI FEATURE ENGINEERING
Attribute Generated Attribute
Type Possible Values
Label Count
Light Light Status
Nominal ON OFF
7788 12772 Date Week
Status
Nominal Weekday Weekend
14800 5760 Time Time
Format
Nominal PM AM
10142 10418
4) Over-Sampling Imbalanced Data: From Table 2, the classification problem contains imbalanced data where the classes of binary classification are not represented equally. Though a small variance often does not matter as imbalanced classification data set is common, however when the ratio of Class-1 to Class-2 instances in Table 2 is almost 80:20 then this can cause problems during measuring classification accuracy when evaluating classification models employed. Nevertheless, there are classification problems where imbalanced data is expected. For example, the ratio of binary classification in Table 2 is expected to be imbalanced under the circumstances where majority of the detection will be in the “Not Occupied” class when the room’s light is turned off and the measurement is taken during weekend. To combat imbalanced data as mentioned in domain problem and to avoid misleading classification accuracy, a method to generate synthetic samples called SMOTE (Synthetic Minority Over-Sampling Technique) is applied. SMOTE algorithm works by randomly sampling the attributes from instances in the minority class [29]. The Supervised Instance SMOTE filter is applied to resample the data set. Table 7 shows that the occupancy minority class values have increased.
TABLEVII
RESULT OF GENERATING SMOTE Attribute Label Before
SMOTE
After SMOTE
Occupancy 0 15810 15810
1 4750 9500
Instances 20560 25310
C. Machine Learning Task
Three classification algorithms and three feature selection algorithms are employed in this task. The classification algorithms are Multi-Layer Perceptron (MLP), Logistic Model Trees (LMT) and Instance Based k (IBk). The feature selection algorithms are the Information Gain Attribute Evaluation (IGAE), Correlation Attribute Evaluation (CAE) and Wrapper Subset Evaluation (WSE)
Model Trees (LMT) is a classifier for building 'logistic model trees' based on logistic regression functions at the leaves [30-31]. The algorithm allows manipulation in binary and multi-class target variables, numeric and nominal attributes and missing values. Instance Based k (IBk) is a K-nearest neighbours classifier. The technique allows an appropriate value of k parameter to be selected based on cross-validation. Distance measure is another important parameter which controls how the training data is stored and searched [32] .
2) Feature Selection Algorithms: Information Gain Attribute Evaluation (IGAE) calculates the information gain or entropy for each attribute for the data set class. Values vary from 0, signifyin a “no information”, to 1 which represents “maximum information”. The gain function is applied to the existing attributes so that those that has a higher information gain can be discriminated from the low information gain attributes. Correlation Attribute Evaluation (CAE) calculates the correlation between two variables, either the correlation is in the same or different directions on the number line. The calculated correlation between each attribute and the output variable will show those attributes that have higher rank from a moderate-to-high positive or negative correlation (close to -1 or 1). Attributes with a low correlation (value close to zero) can be dropped from selection. Wrapper Subset Evaluation (WSE) uses a learning algorithm to evaluate the performance of the algorithm on the data set with different subsets of attributes selected. The subset that results in the best performance is taken as the selected subset.
III.RESULTS AND DISCUSSION
The classification performance is estimated using Correctly Classified and Kappa Statistic. Classification Accuracy is often presented as a percentage ratio of the number of correct predictions out of all predictions made, where 100% is the highest an algorithm can achieve. While the Kappa Statistic can be defined as measuring the degree of agreement of prediction between two sets of categorized data. Kappa statistics ranges between 0 to 1 intervals. The higher value indicates the strong agreement/bonding. Kappa results is interpreted as follows: kappa values less or equal to zero indicate no agreement, kappa values between 0.40 to 0.59 is considered a moderate agreement, 0.6 to 0.79 as substantial and values above 0.8-1.0 indicate as almost perfect agreement [33]. Statistical Test is also conducted in this study to determine whether a classifier’s performance is statistically different than another.
The procedure used in conducting the comparative experiment, generally consists of three general steps. First, the feature selection algorithms are compared to identify which irrelevant attributes can be removed, and which attributes are relevant to predict the room occupancy. The experiment of feature selection algorithms on the data set is conducted using the IGAE, CAE and WSE. The result of comparing the feature selection algorithms on the dataset is shown in Table 8. Table 8 shows the same top seven attributes for the IGAE, CAE methods which are Light, Temperature, CO2, Date, Humidity, Humidity Ratio and Time. Both methods also ranked Time attribute at the lowest.
However, WSE identified only four relevance features (Date, Humidity, Light and CO2). This means that the remaining features, which are Time, Humidity Ratio and Temperature were considered as irrelevant features in predicting room occupancy and features were automatically removed.
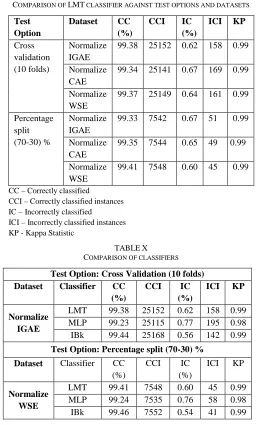
Second, three new data sets are generated after evaluating the result and removing irrelevant attributes that were identified as shown in Table 8. As shown in Table 9, LMT is selected as the initial classifier to be compared against two test options, cross validation and percentage split respectively with three new data sets (i.e., Normalize IGAE,
Normalize CAE, Normalize WSE) generated after employing feature selection algorithms. Result shows that the normalized data set using IGAE feature selection achieved higher accuracy of 99.38% for cross validation test option. As for percentage split, a higher accuracy of 99.41% was remarkably obtained using less features after employing a learner-based (i.e., WSE) feature selection.
Based on this result, the third experiment is deployed to compare against two other classifiers to further investigate the best classifier to solve the classification problem. In the third phase, LMT classifier is compared against MLP and IBk respectively for two test options along with two data sets that have achieved higher accuracy in the first experiment. Table 10 shows the result of comparing the accuracy performance for each classifier. Explicitly, the IBk classifier has succeeded to achieve relatively higher accuracy rate of 99.44% and 99.46% respectively for both test options and data sets. To further examine the accuracy rates, the results of IBk classifier is used to deploy the parameters tuning experiment.
TABLEVIII
COMPARISON OF FEATURE SELECTION ALGORITHMS Attribute Feature
Selection
Ranked Attributes
1 Date 2 Time 3 Temperature 4 Humidity 5 Light 6 CO2 7 Humidity Ratio
IGAE 0.90 0.49 0.45 0.23 0.20 0.17
0.13
5 Light 3 Temperature 6 CO2 1 Date 4 Humidity 7 Humidity Ratio
2 Time
CAE 0.93 0.62 0.54 0.29 0.12 0.05 0.01
5 Light 3 Temperature 6 CO2
7 Humidity Ratio 1 Date
4 Humidity
2 Time
WSE Search Method: Best first
TABLEIX
COMPARISON OF LMT CLASSIFIER AGAINST TEST OPTIONS AND DATASETS
Test Option
Dataset CC (%)
CCI IC (%)
ICI KP
Cross validation (10 folds)
Normalize IGAE
99.38 25152 0.62 158 0.99
Normalize CAE
99.34 25141 0.67 169 0.99
Normalize WSE
99.37 25149 0.64 161 0.99
Percentage split (70-30) %
Normalize IGAE
99.33 7542 0.67 51 0.99
Normalize CAE
99.35 7544 0.65 49 0.99
Normalize WSE
99.41 7548 0.60 45 0.99
CC – Correctly classified
CCI – Correctly classified instances IC – Incorrectly classified
ICI – Incorrectly classified instances KP - Kappa Statistic
TABLEX COMPARISON OF CLASSIFIERS
Test Option: Cross Validation (10 folds) Dataset Classifier CC
(%)
CCI IC (%)
ICI KP
Normalize IGAE
LMT 99.38 25152 0.62 158 0.99 MLP 99.23 25115 0.77 195 0.98 IBk 99.44 25168 0.56 142 0.99
Test Option: Percentage split (70-30) %
Dataset Classifier CC (%)
CCI IC (%)
ICI KP
Normalize WSE
LMT 99.41 7548 0.60 45 0.99 MLP 99.24 7535 0.76 58 0.98 IBk 99.46 7552 0.54 41 0.99
D. Parameters Tuning Experiment
The performance of classification algorithms can be improved by conducting the parameters tuning experiment, to refine the algorithms by its parameters. A controlled experiment in Weka is employed to tune the parameters of the machine learning algorithms. The experiment is an empirical process of trial and error as the machine learning algorithms can be configured to evoke different behaviour, tailored to the machine learning problem respectively. Such experiment is designed to evaluate the result of accuracy performance in phase three. Two parameters of the IBk were investigated: (i) the value of k, which is the number of neighbours to query to make a prediction, and (ii) the
distance metric, which is the way that neighbours are
determined in query to make predictions.
From Table 11, two primary parameters of the IBk were investigated, the value of k, for each k = 1, k = 3, k = 5 and the distance metrics which are either Euclidean or Manhattan distance respectively. Both training/test data set distribution, namely the cross validated and percentage split options were also measured here. Results show that the accuracy performance of both Euclidean and Manhattan distance metrics in cross validation test option have decreased as the
value of k increases. In contrary, the accuracy rate for percentage split test option using Euclidean distance metric increases as the value of k increases. It is worth mentioning of the noticeable performance of IBk algorithm with an accuracy rate of 99.55% when the parameters are tuned to Manhattan distance metric for k is 5.
TABLEXI
IBK PARAMETERS TUNING EXPERIMENT
Test Option: Cross Validation (10 folds)
Dataset Classification Algorithm
k Distance Metric
CC (%)
IC (%)
Normalize IGAE
IBk 1 Euclidean 99.44 0.57
3 99.43 0.577
5 99.43 0.577
1 Manhattan 99.48 0.52
3 99.44 0.56
5 99.43 0.57
Test Option: Split Percentage (70-30) % Dataset Classification
Algorithm
k Distance Metric
CC (%)
IC (%)
Normalize WSE
IBk 1 Euclidean 99.46 0.54
3 99.47 0.53
5 99.49 0.51
1 Manhattan 99.54 0.46
3 99.47 0.53
5 99.55 0.45
E. Statistical Test
Several statistical tests were performed to validate the chosen IBk classifier results.
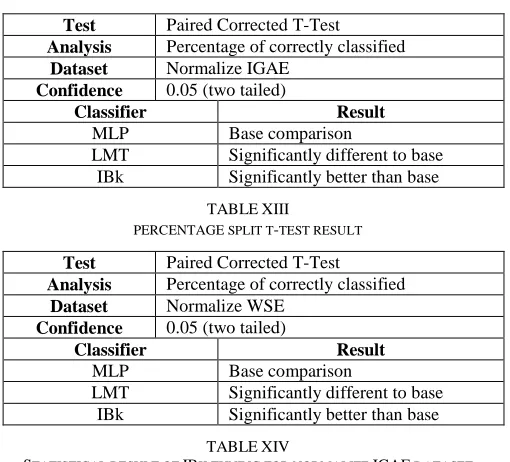
The paired corrected t-test was conducted to compare performance between learning methods for both the cross-validated and percentage-split data sets. This test measure paired samples to identify whether two learning models are statistically significantly different or whether one of them is better than another. MLP, LMT and IBk classifiers are evaluated on the Normalize IGAE and Normalize WSE data sets with a twin-tailed confidence of 0.05.
From Table 12, Cross-validation t-test was performed on the normalize IGAE data set instance. MLP was selected as the base comparison to the other two learning models. Based on the test, LMT was identified to be statistically significantly different than the MLP, but not better. The IBk classifier was instead proven to be statistically significantly better than the base MLP classifier.
Table 13 highlights the Percentage-split t-test performed on normalize WSE data set instance. Similar results were achieved to the cross-validated test, in which the LMT was again significantly different, while the IBk classifier was significantly better than the base MLP comparison.
These results indicate the superior performance of the IBk which is statistically significant to the 0.05 level. Furthermore, based on both the t-tests, it may be concluded that there are statistically significant differences between the performances of the classifier algorithms in this study.
corrected t-Tester. This statistical analysis was carried out to analyse the significance of tuned classifier instances as described in the parameters tuning experiment.
From Table 14, the IBk learning model performances for each instance, based on the Normalize WSE datasets were measured via the t-test. IBk classifier with k=1 and Euclidean metric was selected as the base comparator to the other models. Results highlighted that all other IBk classifier instances are significantly difference in terms of their performance, significant at the 0.05 level.
With regards to the Normalize IGAE datasets, Table 15 highlights results of the IBk learning model performances. From the base comparator that is IBk with k=1 and Euclidean distance metric, results show that all other learning model instances are not statistically significantly different to this base model, also significant at the 0.05 level.
TABLE XII
CROSS VALIDATION SPLIT T-TEST RESULT
Test Paired Corrected T-Test Analysis Percentage of correctly classified
Dataset Normalize IGAE Confidence 0.05 (two tailed)
Classifier Result
MLP Base comparison
LMT Significantly different to base IBk Significantly better than base
TABLEXIII
PERCENTAGE SPLIT T-TEST RESULT
Test Paired Corrected T-Test Analysis Percentage of correctly classified
Dataset Normalize WSE Confidence 0.05 (two tailed)
Classifier Result
MLP Base comparison
LMT Significantly different to base IBk Significantly better than base
TABLEXIV
STATISTICAL RESULT OF IBK TUNING FOR NORMALIZE IGAE DATASET
Test Paired Corrected T-Test Analysis Percentage of correctly classified
Dataset Normalize WSE Confidence 0.05 (two tailed) Classifier / k / Distance
metric
Result
IBk, k=1, Euclidean Base comparison
IBk, k=3, Euclidean Significantly different to base IBk, k=5, Euclidean Significantly different to base IBk, k=1, Manhattan Significantly different to base IBk, k=3, Manhattan Significantly different to base IBk, k=5, Manhattan Significantly different to base
TABLEXV
STATISTICAL RESULT OF IBK TUNING FOR NORMALIZE WSE DATASET
Test Paired Corrected T-Test Analysis Percentage of correctly classified
Dataset Normalize IGAE Confidence 0.05 (two tailed) Classifier / k / Distance
metric
Result
IBk, k=1, Euclidean Base comparison
IBk, k=3, Euclidean Not significantly different to base IBk, k=5, Euclidean Not significantly different to base IBk, k=1, Manhattan Not significantly different to base IBk, k=3, Manhattan Not significantly different to base IBk, k=5, Manhattan Not significantly different to base
F. Regularization in Machine Learning
The concept of regularization in machine learning is used to prevent the problem of overfitting for the learning model built from the training set. It is basically a parameter that is used by minimizing the error function in the classification problem. To address and limit the problem of overfitting in this study, a few techniques have been employed. The techniques mainly revolve on reducing the number of features used in this study by employing feature selection algorithms, using cross validation during test option and employing over-sampling method using SMOTE to generate more data to the training set.
IV.CONCLUSIONS
It can be concluded that in order to solve the classification problem of predicting room occupancy related to this study and data set available, WSE features selection algorithm was found to identify the most appropriate features. These are Date, Humidity, Light and CO2, out of the 8 features available. Using the chosen feature set, classification comparison results demonstrated the effectiveness of IBk classifier compared to MLP and LMT, in which there are statistically significant differences between the performances of the three classification algorithms. In addition, a fine-tuned IBk was specifically shown to be statistically significant from the other IBk instances when using the WSE data set. On the other hand, there is no statistical significance of a fine-tuned IBk using the IGAE data set to its relative tuning instance. This shows that such variability in performance for parameterized instances of learning models still exists based on its data condition, and should be made aware of when executing the learning models. Thus, when compared with previous research, the comparative results of the algorithm's performance by employing the feature selection and parameter tuning shows that the techniques are capable of improving the accuracy level of the machine learning classification algorithm using wrapper method compared to using ranking method.
ACKNOWLEDGMENT
The authors would like to thank Universiti Kebangsaan Malaysia (UKM) and Ministry of Education, Malaysia (MOE) under the Research University Grant (project code: GGPM288 2017-039) for funding and supporting this research.
REFERENCES
[1] Chandrashekar, G., & Sahin, F. (2014). A survey on feature selection methods q. Computers and Electrical Engineering, 40(1), 16–28. http://doi.org/10.1016/j.compeleceng.2013.11.024
[2] Reis, E. R., Castro, P. A. L. De, & Sichman, J. S. (2016). Enhancing Classification Accuracy Through Feature Selection Methods. [3] Pujari, P., & Gupta, J. B. (2012). Improving Classification Accuracy
[4] Arauzo-azofra, A., Luis, J., & Benítez, J. M. (2011). Expert Systems with Applications Empirical study of feature selection methods based on individual feature evaluation for classification problems. Expert Systems with Applications, 38(7), 8170–8177. http://doi.org/10.1016/j.eswa.2010.12.160
[5] Rahman, A. H. A., Ariffinv, K. A. Z., Sani, N. S., & Zamzuri, H. (2017). Pedestrian Detection using Triple Laser Range Finders. International Journal of Electrical and Computer Engineering (IJECE), 7(6), 3037-3045.
[6] Ć, J. N., Strbac, P., & Ć, D. B. (2011). Toward Optimal Feature Selection Using Ranking Methods and Classification Algorithms, 21(1), 119–135. http://doi.org/10.2298/YJOR1101119N
[7] Holliday, J. D., Sani, N., & Willett, P. (2015). Calculation of substructural analysis weights using a genetic algorithm. Journal of Chemical Information and Modeling, 55(2), 214-221.
[8] Sani, N.S. (2017). The Use of Data Fusion on Multiple Substructural Analysis Based GA Runs. J. Appl. Environ. Biol. Sci., 7(2S)30-36, 2017
[9] Holliday, J., Sani, N., & Willett, P. (2018). Ligand-based virtual screening using a genetic algorithm with data fusion. Match: Communications in Mathematical and in Computer Chemistry, 80, 623-638.
[10] Witten, I. H., Frank, E., Hall, M. A., & Pal, C. J. (2016). Data Mining: Practical machine learning tools and techniques. Morgan Kaufmann.
[11] Robert, C. (2014). Machine learning, a probabilistic perspective. [12] Sammour, M., & Othman, Z. (2016). An agglomerative hierarchical
clustering with various distance measurements for ground level ozone clustering in Putrajaya, Malaysia. International Journal on Advanced Science, Engineering and Information Technology, 6(6), 1127-1133.
[13] SamsiahSani, N., Shlash, I., Hassan, M., Hadi, A., & Aliff, M. (2017). Enhancing Malaysia Rainfall Prediction Using Classification Techniques. J. Appl. Environ. Biol. Sci, 7(2S), 20-29.
[14] de Carvalho, T. B. A., Sibaldo, M. A. A., Tsang, R., & da Cunha Cavalcanti, G. D. (2017). Principal Component Analysis for Supervised Learning: a minimum classification error approach. Journal of Information and Data Management, 8(2), 131. [15] Ertuğrul, Ö. F., Kaya, Y., & EminTağluk, M. Detecting Occupancy
of an Office Room by Recurrent Extreme Learning Machines. trees, 2(4), 17.
[16] Candanedo, L. M., & Feldheim, V. (2016). Accurate occupancy detection of an office room from light, temperature, humidity and CO2 measurements using statistical learning models. Energy and Buildings, 112, 28-39.
[17] Dua, D. and Karra Taniskidou, E. (2018). UCI Machine Learning Repository [http://archive.ics.uci.edu/ml]. Irvine, CA: University of California, School of Information and Computer Science.
[18] García, S., Luengo, J., & Herrera, F. (2016). Data preprocessing in data mining. Springer.
[19] Nawi, N. M., Hussein, A. S., Samsudin, N. A., Hamid, N. A., Yunus, M. A. M., & Ab Aziz, M. F. (2017). The Effect of Pre-Processing Techniques and Optimal Parameters selection on Back Propagation
Neural Networks. International Journal on Advanced Science, Engineering and Information Technology, 7(3), 770-777.
[20] Ahmad, S. R., Yaakub, M. R., & Bakar, A. A. (2016). Detecting Relationship between Features and Sentiment Words using Hybrid of Typed Dependency Relations Layer and POS Tagging (TDR Layer POS Tags) Algorithm. International Journal on Advanced Science, Engineering and Information Technology, 6(6), 1120-1126. [21] Aggarwal, C. C. (2015). Outlier analysis. In Data mining (pp.
237-263). Springer, Cham.
[22] Kurniawan, R., Nazri, M. Z. A., Irsyad, M., Yendra, R., & Aklima, A. (2015, August). On machine learning technique selection for classification. In Electrical Engineering and Informatics (ICEEI), 2015 International Conference on (pp. 540-545). IEEE.
[23] Al-Moslmi, T., Gaber, S., Al-Shabi, A., Albared, M., & Omar, N. (2015). Feature selection methods effects on machine learning approaches in Malay sentiment analysis. In Proc. 1st ICRIL-Int. Conf. Inno. Sci. Technol.(IICIST) (pp. 1-2).
[24] Das, S. N., Mathew, M., & Vijayaraghavan, P. K. (2011). An Approach for Optimal Feature Subset Selection using a New Term Weighting Scheme and Mutual Information.
[25] Ilangovan, S., Antonykumar, V., & Balamurugan, S. A. (2016). Comparison of Feature Ranking Methods for Effective Data Classification
[26] Han, J., Pei, J., & Kamber, M. (2011). Data mining: concepts and techniques. Elsevier.
[27] Ramdan, J., Omar, K., & Faidzul, M. (2017). A Novel Method to Detect Segmentation Points of Arabic Words Using Peaks and Neural Network. International Journal on Advanced Science, Engineering and Information Technology, 7(2), 625-631.
[28] Nargesian, F., Samulowitz, H., Khurana, U., Khalil, E. B., & Turaga, D. (2017, August). Learning feature engineering for classification. In Proceedings of the 26th International Joint Conference on Artificial Intelligence (pp. 2529-2535). AAAI Press.
[29] Fernández, A., Garcia, S., Herrera, F., & Chawla, N. V. (2018). SMOTE for Learning from Imbalanced Data: Progress and Challenges, Marking the 15-year Anniversary. Journal of Artificial Intelligence Research, 61, 863-905
[30] Lee, S., & Jun, C. H. (2018). Fast incremental learning of logistic model tree using least angle regression. Expert Systems with Applications, 97, 137-145.
[31] De Caigny, A., Coussement, K., & De Bock, K. W. (2018). A new hybrid classification algorithm for customer churn prediction based on logistic regression and decision trees. European Journal of Operational Research, 269(2), 760-772.
[32] Zhang, X., Li, Y., Kotagiri, R., Wu, L., Tari, Z., & Cheriet, M. (2017). KRNN: k Rare-class Nearest Neighbour classification. Pattern Recognition, 62, 33-44.