Impact of Vibration on a Computer Network Using Optical
Fibre Cables
*
1Minabai Maneke Igwele,
2Godwin Ebikabowei Ogobiri
1Department of Physics, Faculty of Science, Niger Delta University, Wilberforce Island, P. M. B. 071 Yenagoa, Bayelsa
State, Nigeria
2Department of Physics, Faculty of Physical Sciences, University of Benin, Benin City, Nigeria
This study was carried out to validate the negative impact of vibration on a computer network using optical fibre cables where the optical time–domain reflectometer (OTDR) of single mode configuration was employed to acquire signal losses on the network. The losses were categorized in three data sets such as that from a non–vibration (NV), a vibration source from a shaker and generator (SHG) and another source combining the shaker, generator, and a truck (SHGT). The impact of these results were compared on a column and area graph where we obtained a superimposed effect combining all data sets in the area graph that the vibration sources from SHGT had greater impact on the network as their reflected losses were 33.31dB, 33.29dB, and -33.34dB respectively for NV, SHG, and SHGT. The results further confirmed that signal losses on the network has a direct relationship with distance and also, vibration can as well help to normalize errors arising from poorly terminated cables and correct some splice faults as number of events an OTDR records are limited. This study also confirmed the possible use of this system to investigate underground movements likely to be earthquakes or road failure signs.
Keywords: Computer Network, Vibration, Optical Fibre Cable, Signal Loss, OTDR, Flask Shaker, Generator, Truck.
INTRODUCTION
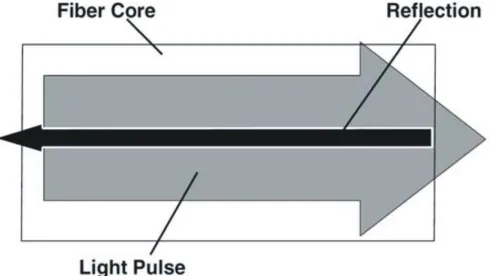
Among the enormous advantages of optical fibre cables, its sensing capability have been employed through the use of an optical time – domain reflectometer (OTDR) to measure signal losses on a computer network built on optical fibre cable by generating vibration from different machines on the cable path of the network within a locality. The OTDR which is a great device in studying the sensory ability of optical fibre cable as used in this study applies the reflectometry principle comprising Rayleigh scattering and Fresnel reflection as its two basic physical principles in actualizing these results, which would enable us understand the impact of vibration that in most cases leads to signal losses on a computer network of optical fibre cables. The system (OTDR) detects the presence and location of perturbations, which were affected by the intensity of the radiation (light) returned from the fibre, but do not respond to phase changes of the radiation (light) hence, the authors have designed a phase – sensitive OTDR to enhance coherent effects (Radim, Petr, et al., 2015).
The OTDR is also capable of acquiring data for both single and multimode optical fibre, but in this study, only the case of a single mode has been considered. This implies that sensors in itself have different types and definitions and we have defined sensors in this study as a device that uses optical fibre either as the sensing element (intrinsic sensors) for single mode optical fibres or as a means of relaying signals from a remote sensor to the electronics that process the signals (extrinsic sensors) for multimode optical fibres. In the former, optical fibres can be used as sensors to measure strain, temperature, pressure and other quantities by modifying a fibre so that the quantity to
*Corresponding Author: Minabai Maneke Igwele, Department of Physics, Faculty of Science, Niger Delta University, Wilberforce Island, P. M. B. 071 Yenagoa, Bayelsa State, Nigeria. E-mail: [email protected]; Tel: 08136407023, Co-Author Email: [email protected];
Tel: 08032749969
Vol. 5(1), pp. 087-093, February, 2019. © www.premierpublishers.org. ISSN: 9098-7709
Research Article
Journal of Physics and Astronomy Research
be measured modulates the intensity, phase, polarization and wavelength or transit time of light in the fibre. They provide distributed sensing over very large distances. For instance, temperature can be measured by using a fibre that has evanescent loss that varies with temperature or by analyzing the Rayleigh scattering, Raman scattering or the Brillouin scattering in optical fibre (Ghosh, Sarkar and Chakraborty, 2002). While in the latter, they use an optical fibre cable, normally a multimode one to transmit modulated light from either a non – fibre optical sensor or an electronic sensor connected to an optical transmitter. A major benefit of extrinsic sensors is their ability to reach places which are otherwise inaccessible as in the measurement of temperature inside aircraft jet engines by using a fibre to transmit radiation into a radiation pyrometer located outside the engine. They also provide excellent protection of measurement signals against noise corruption (Ghosh, Sarkar, Chakraborty and Dan, 2006). This study tends to validate the impact of vibration emanating from different vibration sources and combinations that could lead to signal losses on a computer network using optical fibre cables.
Figure 1: Rayleigh scattering
Figure 1 above illustrates Rayleigh scattering, which is the major loss factor in fibre optics. Longer wavelengths of light exhibit less scattering than shorter wavelengths. For example, light at 1550nm loses 0.2dB to 0.3dB per kilometer (dB/Km) of fibre length due to Rayleigh scattering, whereas light at 850nm loses 4.0dB to 6.0dB/Km from scattering. A higher density of dopants in a fibre will also create more scattering and thus higher levels of attenuation per kilometer.
Figure 2: Fresnel reflection
Again, figure 2 above defines Fresnel reflection, which is
like shining a flashlight at a window. Most of the light
passes through the window, but some of it reflects back at
you. The angle that the light beam hits the window determines whether or not the reflection will bounce back
into the flashlight, your eyes, or the ceiling. More so, an
evident change in the propagation of light in optical fibre makes light lose its property of total internal reflection
(Procedia Engineering, 2017).
METHODOLOGY
Below are the instruments used in carrying out this study and their respective images are shown, except for the truck that was not captured during the process.
a. Flask shaker (Gallenkamp brand)
Figure 3: Flask shaker
b. Gasoline generator
Figure 4: Generator and flask shaker connected
c. Heavy duty truck
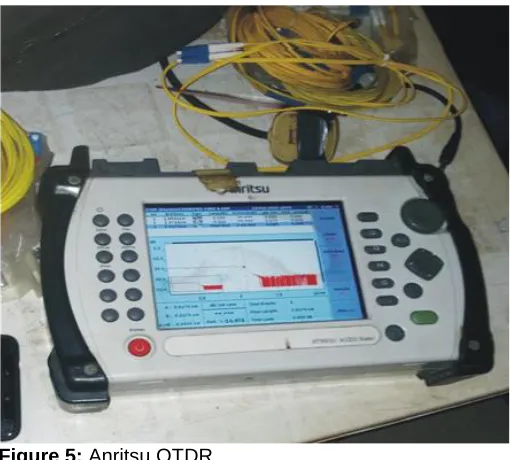
Figure 5: Anritsu OTDR
The instruments were setup in such a way that three sets of data comprising the respective signal losses would be achieved according to the categorization below, which also interpreted the readings obtained from the OTDR.
The first category is the non – vibration data set (NV) where we assumed there were no vibration within the premises in which the readings were obtained. A second category was the subjected vibration on the optical fibre cable from the combination of the shaker and generator abbreviated as (SHG) and a final category was the vibration combinations of the shaker, generator and truck, which have been abbreviated as (SHGT). Each of these three categories (NV, SHG, and SHGT) have been clearly described below as the methodology through which this study has been carried out. Though, for the first category (NV), the OTDR was directly connected to the path or route of interest on the network and its readings obtained, but we ensured there was minimal obstruction of passer – by vehicles within the vicinity to reduce the assumed natural vibration of the environment to the minimum.
THE FLASK SHAKER AND GASOLINE GENERATOR (SHG)
After the OTDR have been used to acquire the first set of readings without vibration (NV) as assumed, a second set of readings were also acquired from the combination of the flask shaker and gasoline generator (SHG) of which the generator was actually used to power the flask shaker. The generator and flask shaker were positioned at about 2m to the nearest splice joint, which was about 2m as well to the road side of the central administration junction where the field work for this study was concentrated. In essence, this vibration source (SHG) was positioned at about 4m to the road side (Note that the vibration source was mounted directly on the optical fibre cable line). The axial or
regulator of the flask shaker was adjusted to the maximum to give a possible greater degree of vibration impact.
THE FLASK SHAKER, GENERATOR AND TRUCK (SHGT)
A third and final set of readings of this study were acquired by combining the vibrations from the flask shaker, gasoline generator and heavy duty truck (SHGT). The flask shaker and generator was maintained at the same spot as in section The Flask Shaker and Gasoline Generator (SHG), whereas the truck, which could not directly access the optical fibre cable line was stationed on the road at 2m distance to the splice point (i.e. 4m to the flask shaker and generator) and the truck was repeatedly throttled for a period of about 10 – 15minutes at the spot while the readings were being acquired and recorded.
THE OTDR (OPTICAL TIME DOMAIN REFLECTOMETER)
The OTDR was used to acquire all the readings of signal loss generated from the vibration sources and as well that without vibration. Before taking the readings with the OTDR at the patch or server room, the OTDR ports were cleaned or sterilized with an alcohol as well as the fibre cable connectors to ensure dust free surfaces that may inhibit proper connection. After cleaning, the fibre cable connecting the line or route of the network (i.e. the central administration junction) was then connected to the OTDR and router or switch, the OTDR was then configured to the desired specification (in this case, only single mode was available) and finally, the OTDR was engaged to record the readings as used in this study.
RESULTS AND DISCUSSION
Table 1: Data set for non – vibration source (NV) S/N Feature/
Type
Location (Km)
Event–Event (dB)/ (dB/Km)
Loss (dB) Ref1 (dB) 1 1/N 0.0278 -0.13 -4.786 0.05(2P)
2 2/N 0.1941 -0.10 -0.584 0.20(2P)
3 3/N 0.4747 0.04 0.132 -0.13(2P)
4 4/N 0.6063 -0.00 -0.020 0.06
5 5/N 0.7595 0.02 0.161 0.19
6 6/N 1.1731 0.12 0.285 0.21
7 7/N 1.4683 0.08 0.255 0.05
8 8/N 1.4861 0.01 0.297 0.46(2P)
9 9/N 1.7644 0.03 0.092 0.04(2P)
10 10/N 1.8100 -0.01 -0.129 0.93(2P)
11 11/N 1.9015 0.01 0.148 0.24(2P)
12 12/N 2.3794 0.07 0.152 1.21(2P)
13 13/N 2.4937 0.02 0.135 -0.10(2P)
14 14/N 2.5288 0.02 0.464 0.33(2P)
15 15/E 2.6639 0.00 0.010 >3.00 -33.31
Figure 6: Line graph of data set NV
LOSSES WITHOUT VIBRATION (NV)
The result of figure 6 above was obtained directly from the data set of table 1, which represents same data set for non – vibration (NV). The result indicated shows a progressive signal loss over distance as light travels through the optical fibre cable. These losses are equivalent to the event points shown on the table (Table 1). Aside these progressive signal losses over distance along the optical cable path, the recorded losses also indicate splicing faults, bending losses, reflectance loss on the cable. Marginal signal losses, particularly the negative losses showed that there were greater splice joint faults due to poor alignment, poor or weak cable terminations, and avoidable bending losses that could arise from poor laying of the polyvinyl chloride (PVC) pipe carrying the optical fibre cable itself, hence the curvy and sharp peaks on the line graph trace indicating the various losses at each event point.
LOSSES WITH VIBRATION (SHG, SHGT)
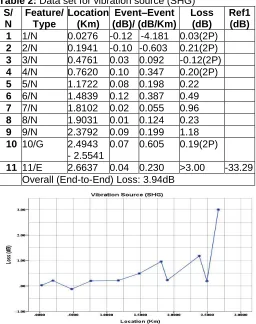
Comparing with the result of fig. 6 above, one can observe from figure 7 and figure 8 obtained from table 2 and table 3 below respectively that the line traces from the graphs followed a similar trend, but in these cases as in fig. 7 and fig. 8, there were fewer events recorded, which implies fewer signal losses. Though the losses recorded from these results were fewer, one can clearly see that higher losses were obtained from these cases as well due to the generation of vibration from the various combinations of a shaker and generator on one hand and shaker, generator and truck on the other hand. These vibration sources may have eliminated some of the topographic challenges and corrected in part the splicing faults, but still posed a greater degree of signal loss on the network within the confine of this study (Igwele and Ogobiri, 2018).
More so, the results of fig. 7 and fig. 8 respectively tends to give us a better slope or gradient to illustrate the direct relationship between the signal loss and distance, but we could observe that fig. 8, which was expected to generate a better result by this relationship due to the addition of the truck as a vibration source to increase the degree of vibration tend to be poorer making the results of fig. 7 more preferable. This is because the truck size could not access a closer proximity to the cable path as well as the suspected splice joint within the field where this study was
carried out, rather the position of the truck created a surrounding vibration against the signal loss, which lead to more event points compared to the ones obtained from the shaker and generator (SHG). Furthermore, the vibration from the shaker, generator and truck (SHGT) showed no significant difference when compared with the first two results of fig. 6 above and fig. 7 below as this result fell in between these two in terms of end – to – end loss, reflected loss and number of event points.
Table 2: Data set for vibration source (SHG)
S/ N
Feature/ Type
Location (Km)
Event–Event (dB)/ (dB/Km)
Loss (dB)
Ref1 (dB) 1 1/N 0.0276 -0.12 -4.181 0.03(2P)
2 2/N 0.1941 -0.10 -0.603 0.21(2P)
3 3/N 0.4761 0.03 0.092 -0.12(2P)
4 4/N 0.7620 0.10 0.347 0.20(2P)
5 5/N 1.1722 0.08 0.198 0.22
6 6/N 1.4839 0.12 0.387 0.49
7 7/N 1.8102 0.02 0.055 0.96
8 8/N 1.9031 0.01 0.124 0.23
9 9/N 2.3792 0.09 0.199 1.18
10 10/G 2.4943 - 2.5541
0.07 0.605 0.19(2P)
11 11/E 2.6637 0.04 0.230 >3.00 -33.29
Overall (End-to-End) Loss: 3.94dB
Figure 7: Line graph of data set SHG
Table 3: Data set for vibration source (SHGT)
S/N Feature/ Type
Location (Km)
Event–Event (dB)/ (dB/Km)
Loss (dB)
Ref1 (dB) 1 1/N 0.0278 -0.12 -4.294 0.02(2P)
2 2/N 0.1929 -0.12 -0.706 0.24(2P)
3 3/N 0.4769 0.02 0.060 -0.13(2P)
4 4/N 0.6073 0.01 0.041 0.08(2P)
5 5/N 0.7593 0.02 0.124 0.20(2P)
6 6/N 1.1729 0.08 0.186 0.22
7 7/N 1.4855 0.13 0.407 0.49
8 8/N 1.8098 0.02 0.069 0.94(2P)
9 9/N 1.9017 0.03 0.379 0.23(2P)
10 10/N 2.3796 0.08 0.172 1.24(2P)
11 11/G 2.4928 - 2.5235
0.04 0.376 -0.12(P2)
12 12/N 2.5288 -0.01 -0.291 0.32(2P)
13 13/E 2.6639 -0.01 -0.094 >3.00 -33.34
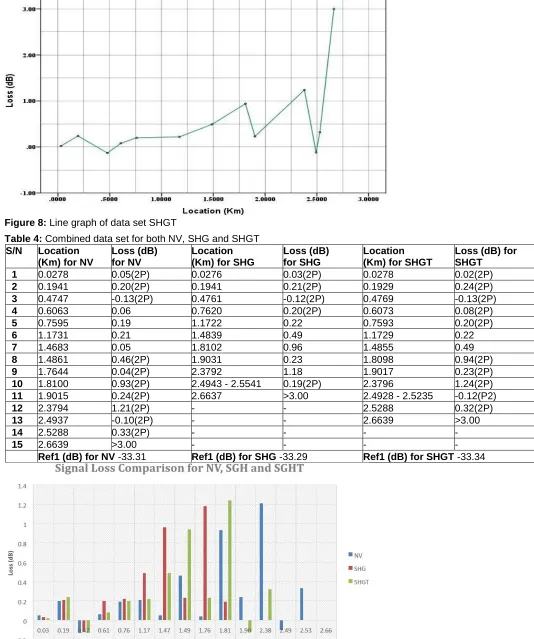
Figure 8: Line graph of data set SHGT
Table 4: Combined data set for both NV, SHG and SHGT
S/N Location (Km) for NV
Loss (dB) for NV
Location (Km) for SHG
Loss (dB) for SHG
Location (Km) for SHGT
Loss (dB) for SHGT
1 0.0278 0.05(2P) 0.0276 0.03(2P) 0.0278 0.02(2P)
2 0.1941 0.20(2P) 0.1941 0.21(2P) 0.1929 0.24(2P)
3 0.4747 -0.13(2P) 0.4761 -0.12(2P) 0.4769 -0.13(2P)
4 0.6063 0.06 0.7620 0.20(2P) 0.6073 0.08(2P)
5 0.7595 0.19 1.1722 0.22 0.7593 0.20(2P)
6 1.1731 0.21 1.4839 0.49 1.1729 0.22
7 1.4683 0.05 1.8102 0.96 1.4855 0.49
8 1.4861 0.46(2P) 1.9031 0.23 1.8098 0.94(2P)
9 1.7644 0.04(2P) 2.3792 1.18 1.9017 0.23(2P)
10 1.8100 0.93(2P) 2.4943 - 2.5541 0.19(2P) 2.3796 1.24(2P)
11 1.9015 0.24(2P) 2.6637 >3.00 2.4928 - 2.5235 -0.12(P2)
12 2.3794 1.21(2P) - - 2.5288 0.32(2P)
13 2.4937 -0.10(2P) - - 2.6639 >3.00
14 2.5288 0.33(2P) - - - -
15 2.6639 >3.00 - - - -
Ref1 (dB) for NV -33.31 Ref1 (dB) for SHG -33.29 Ref1 (dB) for SHGT -33.34
Figure 10: Area graph of combined data set for NV, SHG and SHGT
COMPARED LOSSES FROM NV, SGH, AND SHGT
In order to validate the impact of vibration on a computer network using optical fibre cable from this study, we have directly compared the results of the above (fig. 6, 7, and 8) with a column and area graphs as shown in figure 9 and figure 10, which was obtained from table 4 above respectively.
From the column graph (fig. 9), we have picked out the losses in the three results measured (i. e. the results of NV, SHG, and SHGT) and compared them against their common distances of recorded events. By so doing, we have been able to ascertain the final correlation between the three results that the generated vibration actually had impact on the signal losses and these losses increased over distance as shown above from the three sets of data. The isolated columns from the results of NV in fig. 9 according to the legend of the graph only indicated the difference in the number of events recorded as the events for NV were greater than those for SHG and SHGT.
To further buttress, an area graph was plotted with same values where the various sources have been superimposed according to their degree of losses over the distances recorded. Here (fig. 10), we can see that at the initial point of the graph, the data or losses from NV is quite small, but as the distance progresses with a corresponding increase in signal loss as compared with the others (SHG and SHGT), an appreciable impact was seen from the superimposed results combined from all three sources of data set where the legends have been clearly defined next to the graph and as the distance increases, it was seen that the signal loss also increased according to the various degrees of vibration.
CONCLUSION
From this study, we have seen that vibration really does have a negative impact on computer networks built with optical fibre cables as the above results showed that the degrees of vibration took a progressive trend, which is to say that the effects of NV was less than that of SHG, which in turn was less than that of SHGT (i. e. NV<SHG<SHGT) and an overall end – to – end signal loss of 3.90dB and 3.94dB as recorded in this study excluding other factors such as splicing faults and vibration, may also mean that the light intensity from the network was not enough to propagate the data across the length of the cable. From this study, we have observed that reducing the number of splice joints to the minimum and properly terminating its ends would greatly reduce the level of signal loss and help one to better predict and investigate environmental hazards or threats such as tsunami and earthquakes. For such purposes, optical fibre cables could be properly buried for easy detection of underground movements that could lead to such occurrences. More so, better impact of vibration leading to signal losses for this study can be acquired when such vibration is generated and repeated within 500m – 1km intervals on the optical fibre cable as against the standard distance of 2km – 4km as vibration on or within an optical fibre network can greatly affect the signal loss arising from it.
REFERENCES
Agrawal, G.P., (1999), Fiber – Optic Communication Systems, 1997, Vol 6. Wiley, New York, pp 1093–1102.
Ali R. B., Sara T., Marzieh B. and Farnaz F. (2012), Optical Fiber Interferometers and Their Applications, Interferometry – Research and Applications in Science and Technology, Dr. Ivan Padron (Ed.), ISBN: 978-953-510403-2.
Allard, F. C., Fiber Optics Handbook for Engineers and Scientists, McGraw-Hill, New York, 1990.
Antunes, P., Travanca, R., Rodrigues, H., et al, (2012),
Dynamic Structural Health Monitoring of Slender Structures Using Optical Sensors. In MDPI – Open Access Publishing. [online]. 2012, Vol. 12, No. 5. http://www.mdpi.com/1424-8220/12/5/6629/htm. Anusha M., Abi W., et al., Loss Analysis in Optical Fiber
Transmission, SIR SYED University Research Journal of Engineering and Technology, Volume 5, Issue 1, 2015.
Cusano, A., Cutolo, A., Albert, J., (2011), Fibre Bragg Grating Sensors: Recent Advancements, Industrial Applications and Market Exploitation. 2011. 322 p. ISBN 978-1- 60805-084-0.
Elebi, M. C., Real-time seismic monitoring of the New Cape Girardeau Bridge and preliminary analyses of recorded data: an overview, Earthquake Spectra 22, pp. 609–630, 2006.
Eric, U., William, B. Spillman Jr. (2011), Fibre Optic Sensors: An Introduction for Engineers and Scientists
(Second edition). John Wiley & Sons, New Jersey, USA.
Gambling, W. A., (2000), The Rise and Rise of Optical Fibres, IEEE Journal on Selected Topics in Quantum Electronics, 6(6): 1084-1093, doi: 10.1109/2944.902157.
Gholamzadeh, B. and Nabovati, H., (2008), Fiber Optic Sensors, World Academy of Science, Engineering and Technology, Vol. 18, pp 297-307.
Ghosh, S. K.; Sarkar, S. K.; Chakraborty, S., (2002),
Design and development of a fibre optic intrinsic voltage sensor, Proceedings of the 12th IMEKO TC4
International Symposium Part 2, Zagreb, Croatia: 415 –
419.
Ghosh, S. K.; Sarkar, S. K.; Chakraborty, S.; Dan, S., (2006), High Frequency Electric Field Effect on Plane of Polarization in Single Mode Optical Fibre, Proceedings, Photonics 2006.
Glišić, B., Inaudi, D., (2007), Fibre Optic Methods for Structural Health Monitoring. [online]. ISBN 978-0470-061428.
Hati, A., Nelson, C. W., et al; Cancellation of Vibration – Induced Phase Noise in Optical Fibre, IEEE Photonics Technology Letters, Vol. 20, NO. 22, November 15, 2008.
Igwele, M. M. and Ogobiri, E. G., (2018), Measurement of Signal Losses in Optical Fibre Cables under Vibration Using Optical Time-Domain Reflectometer (OTDR),
International Journal of Scientific and Engineering Research, Volume 9, Issue 7, July-2018, pp. 1547– 1552, ISSN 2229-5518.
Juarez, J. C., Taylor, H. F. (2005), Distributed fiber optic intrusion sensor system for monitoring long perimeters.
In Proceedings of the SPIE, Sensors, and Command, Control, Communications, and Intelligence (C3I) Technologies for Homeland Security and Homeland Defense IV, 5778, 692‒703.
Mahmudah S. G., Edi P., et al., Vibration Measurement of Mathematical Pendulum based on Macrobending – Fiber Optic Sensor as a Model of Bridge Structural Health Monitoring, 2016.
Mary, K. C., 2007; Future trends in fibre optics communication, WCE, London UK, July 2, 2014). Procedia Engineering 170 (2017) 430 – 434 of the
Engineering Physics International Conference, EPIC
2016.
Radim S., Petr M., et al; Distributed Fiber-Optic Sensor for Detection and Localization of Acoustic Vibrations; Metrology and Measurement Systems, Vol. XXII (2015), No. 1, pp. 111–118.
Wenzel, H., (2009), Health Monitoring of Bridges. John Wiley & Sons, Ltd. 2009. 643 pp. ISBN 978-0-470-03173-5.
Zendehnam, A., Mirzaei, M., Farashiani A. and Horabadi F., L., Investigation of bending loss in a single-mode optical fiber, Vol. 74, No. 4, journal of April 2010 physics pp. 591(603).
Accepted 31 January 2019
Citation: Igwele MM, Ogobiri GE (2019). Impact of Vibration on a Computer Network Using Optical Fibre Cables. Journal of Physics and Astronomy Research. 5(1): 087-093.