JUMP ERGOMETER IN SPORT PERFORMANCE TESTING
Erika Zemková, Dušan Hamar
Faculty of Physical Education and Sports, Comenius University, Bratislava, Slovakia
Submitted in September, 2004
The papers deals with the application of the jump ergometer in the evaluation of neuromuscular performance. Altogether 288 athletes of different sport specializations (mean age 18.9 ± 6.4 years, height 172.2 ± 4.3 cm, and weight 62.4 ± 4.9 kg) underwent various tests on the jump ergometer, such as 10-, 60-, and 90-second repeated jumps, squat and countermovement jumps without and with an additional load, and drop jumps from different heights with and without bending the knees. The diagnostic system FiTRO Jumper consisting of a special contact switch mattress con-nected by means of an interface to a computer was used. Jump parameters (power in the active phase of take off and height of the jump) were calculated from the flight and contact times. Results showed that the system may be applied for the assessment of explosive power of the lower extremities, strength endurance of the lower extremities, utilization of the stretch shortening cycle, distribution of fast twitch fibers, optimal drop jump height for plyometric training, and training effects, namely in sports such as basketball, volleyball, soccer, tennis, gymnastics, rock and roll, figure skating, track and field, ski jumping, weight lifting, etc.
Keywords:Explosive power, jump ergometer, sport performance testing.
INTRODUCTION
Explosive power influences performance in many sports, hence its assessment should be considered as an integral part of functional diagnostics in athletes.
Although the jump ergometer is frequently used for this purpose, there are still a lack of information con-cerning the possibilities of its application to the evalua-tion of the actual state of jump abilities, training control and talent identification.
Therefore the aim of the study was to present results and experiences with the utilization of the jump ergom-eter in sport practice.
MATERIAL AND METHODS
Altogether 288 athletes of different sport specializa-tions (mean age 18.9 ± 6.4 years, height 172.2 ± 4.3 cm, and weight 62.4 ± 4.9 kg) volunteered to participate in the study.
They performed variuos tests on the jump ergom-eter, such as 10-, 60-, and 90-second repeated jumps, squat and countermovement jumps without and with an additional load, and drop jumps from different heights with and without bending the knees. Each method is described in a particular part of the article, however the details of each have to be found in related references.
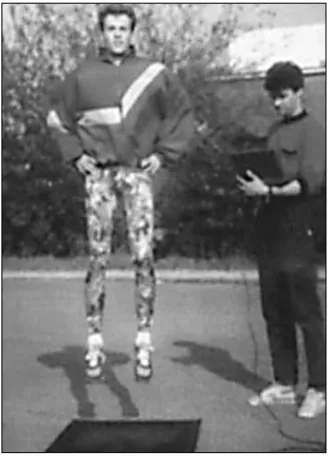
The FiTRO Jumper (Fig. 1) consisting of a special contact switch mattress connected by means of a special
interface to a computer was used (Hamar, 1991). The system measures contact and flight times (with an ac-curancy of 1 ms) during serial jumps and calculates basic biomechanical parameters (Fig. 2). The reliability of the test has been proved to be sufficient enough (Tkáč et al., 1990) to be applied to functional diagnostics of athletes.
Fig. 1
Fig. 2
Jump parameters: tc (s) – contact time, tf (s) – flight time, P’ (W/kg) – mean power in the entire jump cycle, P (W/kg) – power in the active phase of the take off, h (cm) – height of the jump, v (m/s) – mean velocity during the concentric phase of the take off, a (m/s2)
– mean acceleration during the concentric phase of the take off
Test No: 1 Age: 18 y Weight: 60 kg Duration of test: 10 seconds ASSIGMENT: 29.7.2003 Mean frequency: 86/min
RANKING tc(s) tf(s) P(W/kg) P'(W/kg) h(cm) v(m/s) a(m/(s.s)) h/tc 1 0.202 0.512 39.5 6.16 32.1 2.511 22.69 139.8 2 0.208 0.503 39.5 6.05 31.0 2.467 22.49 138.6 3 0.211 0.490 38.5 5.89 29.4 2.403 22.25 136.4
MEAN 0.207 0.502 39.2 6.03 30.9 2.461 22.48 138.2
RESULTS AND DISCUSSION
The results showed various possibilities of applica-tion of the jump ergometer in sport practice.
Distribution of fast twitch fibers
Muscle needle biopsies allowing direct measurement of biochemical parameters of anaerobic metabolism in the working muscle are technically complicated and re-main limited to research investigations. Hence, indirect methods are preferred in practice.
There are data in the literature indicating that maxi-mal power production during short term exercise de-pends on the percentage of fast twitch fibers (Bar-Or et al., 1980; Inbar et al., 1981; Kaczkowski et al., 1982). There is a particularly high correlation (r = 0.860) be-tween the percentage of fast twitch fibers in the vastus lateralis and power in the active phase of the take off (Pact). Similarly, a 15-s jumping test has been reported by Bosco et al. (1983). Such a parameter thus in fact ex-press the capability to take off with the highest intensity, in the shortest time.
Taking this into account it may be assumed that per-centile lines of FT distribution in the population will be similar to those of Pact obtained in the jumping test. Thus, the percentile charts of power in the active phase of the take off can be utilized not only for the estima-tion of explosive power but also for the rough indirect assessment of muscle fiber distribution in the lower
ex-tremities. Therefore, population norms available on the FiTRO Jumper system (Hamar & Tkáč, 1995) may also be used for talent identification.
Assessment of the explosive power of the lower extremities
A test of 10-second maximal jumps with the hands fixed on the hips in order to minimize the influence of the upper extremities is used. Three trials with a two minute pause after each are performed while the better score from the last two is taken for evaluation. The most reliable parameter has been found to be power in the ac-tive phase of the take off in watts per kg of body weight expressed as the mean of the three maximum values of a jumping sequence (Tkáč et al., 1990).
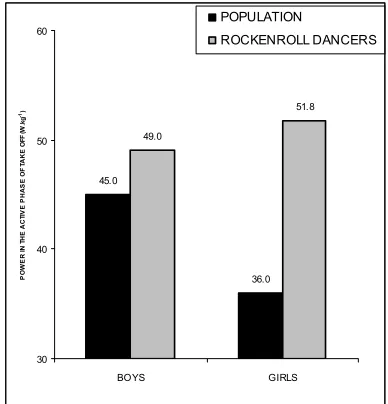
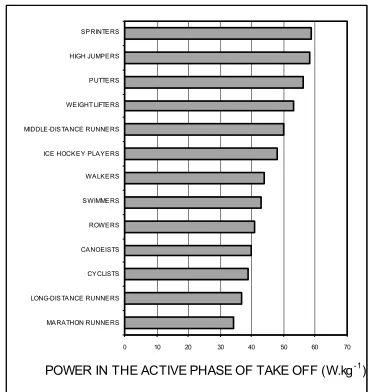
Values of jump parameters obtained by such a test may be compared with population norms. However, these cannot be applied in athletes who have been, for a long time, exposed to training focused on the develop-ment of explosive power, such as, e. g. in rock and roll (Fig. 3) since considerable differences between athletes with different demands on jump abilities have been doc-umented (Hamar, 1991; Fig. 4). Hence, further studies are needed to elaborate specific norms for particular sports.
Fig. 3
Power in the active phase of the take off in rock and roll dancers in comparison with the population (Dzurenková et al., 1999)
45.0
36.0 49.0
51.8
30 40 50 60
BO YS GIRLS
P
O
W
E
R
I
N
T
H
E
A
C
T
IV
E
P
H
A
S
E
O
F
T
A
K
E
O
F
F
(
W
.k
g
-1)
POPULATION
Fig. 4
Power in the active phase of take off in athletes of differ-ent specializations (Hamar, 1991)
0 10 20 30 40 50 60 70 MARATHON RUNNERS LONG-DISTANCE RUNNERS CYCLISTS CANOEISTS ROWERS SWIMMERS WALKERS ICE HOCKEY PLAYERS MIDDLE-DISTANCE RUNNERS WEIGHT LIFTERS PUTTERS HIGH JUMPERS SPRINTERS
POWER IN THE ACTIVE PHASE OF TAKE OFF (W.kg-1)
Assessment of strenghth endurance of the lower extremities
A method of repeated vertical jumps, usually with a duration of 30, 60 or 90 seconds (Bosco et al., 1983; Zemková et al., 1997; Dzurenková et al., 1999, 2000; Zemková et al., 2001, 2002) depending on sport spe-cialization (Fig. 5, 6) is used. In some sports the con-struction of individual time course curves of the jump parameters is recommended by coaches (Pelikán et al., 1999) in order to compare the specific performance in strength endurance between athletes (Fig. 7, 8).
Besides the qualification of power in the active phase of the take off and the height of the jump, also the fa-tigue index, expressed as a ratio of power decline (Pmax--Pmin/Pmax), may be calculated.
Fig. 5
Power in the active phase of the take off in a 60-s test on the jump ergometer (karate athletes, n = 18)
25.9 25.7 24.2
22.8
22.2 21
.7
34.8
34.3 34.1
33.0 32.9 32.4
15 20 25 30 35 40
0-10 ´10-20 20-30 30-40 40-50 50-60
TIME (s) P O W E R I N T H E A C T IV E P H A S E O F T A K E O F F (W .k g -1) YOUTH ADULTS Fig. 6
Power in the active phase of the take off in a 90-s test on the jump ergometer (rock and roll dancers, n = 18)
4 0 . 2 3 9 . 4 3 8 . 6 3 7 . 4 3 5 . 9 3 5 . 3 3 4 . 5 3 3 . 8 3 2 . 7 4 4 . 1 4 2 . 3 4 0 . 8 3 8 . 9 3 7 . 7 3 5 . 8 3 5 . 0 3 3 . 4 3 1 . 8 25 30 35 40 45 0 -1 0 ´1 0 -2 0 2 0 -3 0 3 0 -4 0 4 0 -5 0 5 0 -6 0 6 0 -7 0 7 0 -8 0 8 0 -9 0 TIME (s) P O W E R I N T H E A C T IV E P H A S E O F T A K E O F F (W .k g -1) BOYS GIRLS
Fig. 7, 8
Power in the active phase of the take off during a 90-s test of repeated jumps in rock and roll dancers (an ex-ample of two couples)
Utilization of elastic energy
It is known that the better ability to utilize elastic energy, the higher the difference between squat and
countermovement jumps. Such a difference can be even more pronounced by means of drop jumps from differ-ent heights (Fig. 9).
Fig. 9
Squat and countermovement drop jumps from different heights (an example of two athletes with different abilities to utilize elastic energy)
25 30 35 40 45
0 0 20 40 60 80 0 0 20 40 60 80
DROP HEIGHT (cm )
H
E
IG
H
T
O
F
T
H
E
J
U
M
P
(
c
m
Determination of optimal drop jump height for plyometric training
Plyometric training, which became popular during the late 1970s and early 1980s, has a number of vari-ations, including repetitive jumping on and off a box and jumping while wearing weight belts (Bobbert et al., 1996).
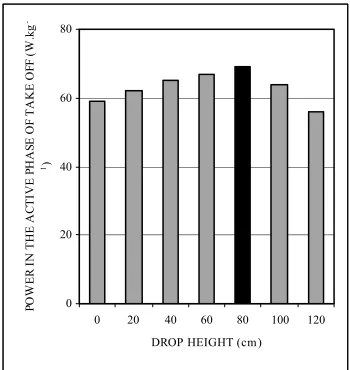
Usually, in random order drop jumps from different heights (with 10 to 20 cm in-between) are performed with the aim of estimating the one from which the high-est power is achieved. The individual curve of the rela-tionship between jump parameters and drop height may be then constructed (Fig. 10).
It has been found that the optimal drop jump height for plyometric training is different in athletes of differ-ent specializations and expectedly better in those with higher performance in the explosive power of the lower extremities (Fig. 11).
Fig. 10
The power in the acive phase of take off from different drop heights
0 20 40 60 80
0 20 40 60 80 100 120
DROP HEIGHT (cm )
P
O
W
E
R
I
N
T
H
E
A
C
T
IV
E
P
H
A
S
E
O
F
T
A
K
E
O
F
F
(
W
.k
g
Fig. 11
Height of the drop jump in athletes of different spe-cializations
10 20 30 40 50 60 70
2
0
6
0
4
0
8
0
2
0
6
0
4
0
8
0
DROP HEIGHT (cm)
H
E
IG
H
T
O
F
T
H
E
J
U
M
P
(
c
m
)
HEIGHT JUMPER
PHYSICAL EDUCAT ION
ST UDENT
ROCKENROL L DANCER
Differentiation of jump abilities by means of an additional load
Jumps performed with an additional load (Fig. 12) are considered to be a more suitable method for the as-sessment of the explosive power of the lower extremities in highly skilled athletes since more information about the structure of jump abilities may be obtained.
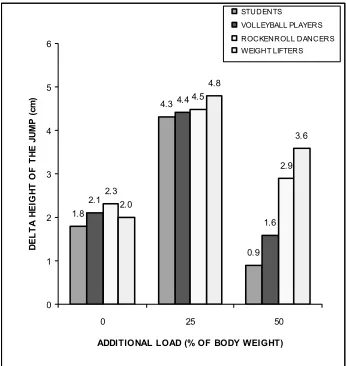
First, the difference between squat and a counter-movement jump is more profound with than without an additional load, depending on the sport specialization (Fig. 13).
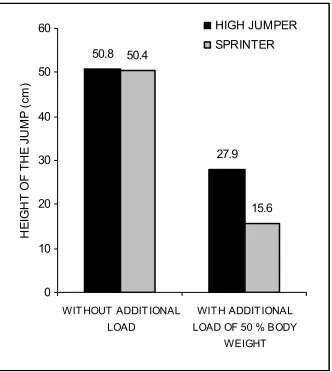
Second, such a test has been found (Zemková et al., 2004) to be more sensitive for athletes with high performance in the explosive power of the lower ex-tremities as compared to a general test (Fig. 14). These differences have been observed in physical education students, too (Fig. 15).
Fig. 12
Power decrease with increased additional load (a barbell across the shoulders)
0 20 40 60 80
0 20 40 60 80 100
ADDITIONAL LOAD (kg)
P
O
W
E
R
I
N
T
H
E
A
C
T
IV
E
P
H
A
S
E
O
F
T
A
K
E
O
F
F
(
W
.k
g
-1)
Fig. 13
Difference in squat and countermovement drop jumps performed without and with additional load (athletes of different specializations, n = 58)
1.8
4.3
0.9 2.1
4.4
1.6 2.3
4.5
2.9
2.0
4.8
3.6
0 1 2 3 4 5 6
0 25 50
ADDITIONAL LOAD (% OF BODY WEIGHT)
D
E
L
T
A
H
E
IG
H
T
O
F
T
H
E
J
U
M
P
(
c
m
)
STU D EN TS
VOLLEYBALL PLAYER S
R OC KEN R OLL D AN C ER S
Fig. 14, 15
Squat and countermovement drop jumps without and with an additional load (high jumper and sprinter and 56 physi-cal education students, respectively)
50.8
27.9
50.4
15.6
0 10 20 30 40 50 60
WIT HOUT ADDIT IONAL LOAD
WIT H ADDIT IONAL LOAD OF 50 % BODY
WEIGHT
H
E
IG
H
T
O
F
T
H
E
J
U
M
P
(
c
m
)
HIGH JUMPER
SPRINTER
0 10 20 30 40 50 60
WIT HOUT ADDIT IONAL
LOAD
WIT H ADDIT IONAL LOAD
OF 25 % BODY WEIGHT
H
E
IG
H
T
O
F
T
H
E
J
U
M
P
(
c
m
)
PHYSICAL EDUCATION STUDENTS
Evaluation of sport specific performance
In some sports (Fig. 16) a test consisting of drop jumps from different heights (performed under two dif-ferent conditions) may be employed. In the first,
sub-jects are instructed to perform a maximal countermove-ment jump without bending the knees, in the second they are allowed to bend the knees in an effort to achieve the highest height possible. In both tests they have to hold their hands on their hips in order to minimise the influence of the upper extremities.
20 25 30 35 40 45 50
20 40 60 80 20 40 60 80 20 40 60 80
DROP HEIGHT (cm )
H
E
IG
H
T
O
F
T
H
E
J
U
M
P
(
c
m
WITHOUT AND WITH BENDING THE KNEES PHYSICAL
EDUCATION
STUDENTS
ROCKENROLL
DANCERS
VOLLEYBALL
PLAYERS
Fig. 16
Height of the drop jumps from heights of 20, 40, 60, and 80 cm with and without bending the knees (athletes of dif-ferent specializations, n = 84)
In particular, in rock and roll, it is known from the biomechanical analysis of jumps that girls tend to per-form bounces from straight legs while boys jump from bent knees. Tests has been found to reveal this different character of jumping between male and female dancers (Zemková et al., 2001).
It has been shown that boys achieved significantly (p < 0. 01) higher heights while performing counter-movement jumps from bent knees than from straight
On the other hand, in girls there were no significant differences between test conditions used (28.1 ± 1.4 and 27.5 ± 1.1 cm, respectively). This is probably because they are performing and training bounces from straight legs. However, they achieved significantly (p < 0.05) higher power in the active phase of the take off as com-pared to boys (Fig. 17).
The better abilities of girls to produce power in the active phase of the take off while performing counter-movement jumps from the straight legged position may be attributed to both genetic disposition (a higher share of fast fibers) as well as to the fact that the conditions of muscle work in the test are similar to the predominant female dancing elements of rock and roll.
Fig. 17
Power in the active phase of take off after drop jump from different heights with and without bending the knees (male and female rock and roll dancers, n = 22)
50.0 49.9
47.9
44.7 43.7
45.4
43.9
41.0
35 40 45 50 55
20 40 60 80
DROP HEIGHT (cm )
P
O
W
E
R
I
N
T
H
E
A
C
T
IV
E
P
H
A
S
E
O
T
A
K
E
O
F
F
(
W
.k
g
-1)
GIRLS
BOYS
Training control
Evaluation of changes in jump parameters during short or long term training is of special interest in sports like basketball, volleyball, soccer, tennis, gymnastics, rock and roll, figure skating, track and field, ski
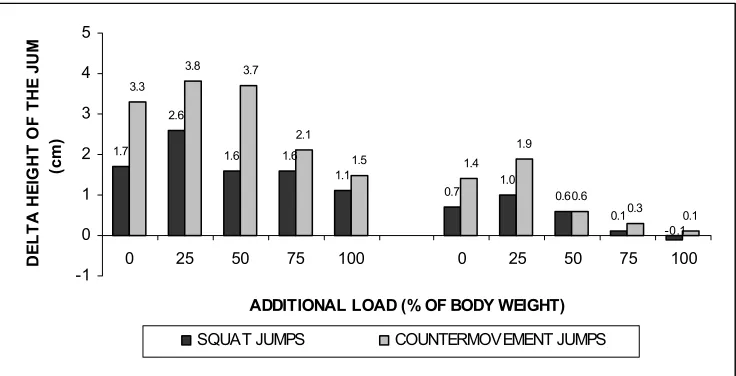
jump-ing, weight liftjump-ing, etc., in which these abilities particu-larly influence athletes’ performance. Such examples are given (Fig. 18, 19, 20, 21). Different methods, described above, were used to evaluate the specific performance of the examined athletes.
Fig. 18
Differences in the height of the countermovement and squat jumps without and with an additional load of 25, 50, 75, and 100% of body weight in weightlifters prior to and after three months of special training aimed at national competi-tion in comparison with recreacompeti-tional athletes.
1.7
2.6
1.6 1.6
1.1
0.7
1.0
0.6
0.1
3.3
3.8 3
.7
2.1
1.5 1.4
1.9
0.6
0.3
0.1
-0.1
-1 0 1 2 3 4 5
0 25 50 75 100 0 25 50 75 100
ADDITIONAL LOAD (% OF BODY WEIGHT)
D
E
L
T
A
H
E
IG
H
T
O
F
T
H
E
J
U
M
(c
m
)
Fig. 19
Height of drop jumps from heights of 20, 40, 60, and 80 cm performed without and with bending the knees prior to and after one year of training in volleyball players (n = 8)
35.9
37.7
36.9
43.6
42.7
42.2
39.6 39.6 39.3
44.6 44
.1 43
.6
37.8
43.9
40.7
45.1
25 30 35 40 45 50
20 40 60 80 20 40 60 80
DROP HEIGHT (cm )
H
E
IF
G
T
O
F
T
H
E
J
U
M
P
W
IT
H
O
U
A
N
D
W
IT
H
B
E
N
D
IN
G
T
H
E
K
N
E
E
(c
m
)
BEFORE AND AFTER ONE YEAR OF TRAINING
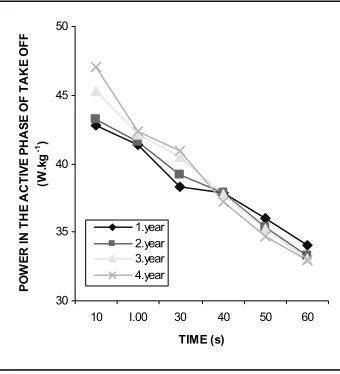
Fig. 20, 21
Power in the active phase of the take off in a 60-second test on the jump ergometer during four years of training in female and male rock and roll dancers (n = 10) (Dzurenková et al., 2001; Zemková et al., 2003)
30 35 40 45 50
10 I.00 30 40 50 60
TIME (s)
P
O
W
E
R
I
N
T
H
E
A
C
T
IV
E
P
H
A
S
E
O
F
T
A
K
E
O
F
F
(W
.k
g
-1)
1.year 2.year 3.year 4.year
30 35 40 45 50
10 I.00 30 40 50 60
TIME (s)
P
O
W
E
R
I
N
T
H
E
A
C
T
IV
E
P
H
A
S
E
O
F
T
A
K
E
O
F
F
(W
.k
g
-1)
1.year 2.year 3.year 4.year
CONCLUSION
Based on the results obtained and experiences gained with the application of the jump ergometer in the as-sessment of neuromuscular performance in athletes of various specializations it may be concluded that such a system helps with talent identification, the differentia-tion of athletes with different age and performance levels as well as evaluation of the effect of training focused on the improvement of jumping abilities.
REFERENCES
Bar-Or, O., Dotan, R., & Inbar, O. (1980). Anaerobic capacity and muscle fibre distribution in man. Int. J. Sports Med., 1, 82–85.
Bobbert, M. F., Gerritsen, K. G. M., Litjens, M. C. A., & Van-Soest, A. J. (1996). Why is countermovement jump height greater than squat jump height? Medi-cine and science in sports and exercises, 32, 28(11), 1402–1412.
of human leg extensor muscles. Eur. J. Appl. Physiol., 50, 129–136.
Bosco, C., Luthanen, P., & Komi, P. V. (1983). A simple method for the measurement of mechanical power in jumping. Eur. J. Appl. Physiol., 50(2), 273–282.
Hamar, D. (1991). Výskokový ergometer – princíp a možnosti uplatnenia v diagnostike trénovanosti
a tréningovej praxi. In Príspevok z pracovného
seminá-ra Diagnostika a rozvoj odseminá-razových schopností. Oster-reich, Tréningové stredisko Salzburg-Riff, 8. Dzurenková, D., Novotná, E., Zemková, E., Marček, T.,
Hájková, M., & Pelikán, H. (2000). Somatická a funkčná charakteristika juniorských
reprezentan-tov Slovenska v rockenrolle. In Abstrakty z Národného
kongresu telovýchovného lekárstva 2000: Telovýchovné lekárstvo na prahu tretieho tisícročia (pp. 9–10). Du-najská Streda: SSTL.
Dzurenková, D., Zemková, E., Marček, T., Hájková, M., & Pelikán, H. (1999). Vyšetrenie anaeróbnych a aerób nych schopností v rockenrolle. In H. Válková
& Z. Hanelová (Eds.), Pohyb a zdraví (pp. 159–162).
Olomouc: Fakulta tělesné kultury UP.
Dzurenková, D., Zemková, E., & Pelikán, H. (1999). Posudzovanie vytrvalosti vo výbušnej sile dolných
končatín u rockenrollistov. In Zborník zo 7.
medzi-národnej vedeckej konferencie CO-MAT-TECH ’99
(pp. 536–542). Trnava: Materiálovo-technologická fakulta STU.
Dzurenková, D., Zemková, E., & Pelikán, H. (2001). Vy-trvalosť vo výbušnej sile dolných končatín v priebe-hu trojročného tréningového cyklu u reprezentantov v rockenrolle. In H. Válková & Z. Hanelová (Eds.),
Pohyb a zdraví (pp. 163–165). Olomouc: Univerzita Palackého.
Hamar, D., & Tkáč, M. (1995). Norms of explosive power in the young population. In Ľ. Komadel (Ed.),
Physical education and sports of children and youth
(pp. 335–338). Topolčianky: END.
Inbar, O., Kaiser, P., & Tesch, P. (1981). Relationship between leg muscle fiber distribution and leg exercise
performance. Int. J. Sports Med., 3, 154–159.
Kaczkowski, W., Montgomery, D. L., Taylor, A. V., & Klissouras, V. (1982). The relationship between muscle fiber distribution and maximal anaerobic
power and capacity. J. Sports Med., 22, 407–413.
Pelikán, H., Dzurenková, D., & Zemková, E. (1999). In-terindividuálne rozdiely vytrvalosti vo výbušnej sile
v rockenrolle. In M. Turek (Ed.), Zborník z vedeckej
konferencie s medzinárodnou účasťou 60 rokov prí-pravy telovýchovných pedagógov na Univerzite Komen-ského v Bratislave (pp. 57–61). Bratislava: Fakulta telesnej výchovy a športu UK.
Tkáč, M., Hamar, D., Komadel, Ľ., & Kuthanová, O. (1990). Measurement of anaerobic power of the
lower limbs by the method of repeated jumps. Sports
training, Med. and Rehab., 1, 317–325.
Zemková, E., Dzurenková, D., & Longa, J. (1997). Vý-skoková ergometria v diagnostike rýchlostno-silových
schopností dolných končatín u karatistov. In Sborník
z mezinárodní studentské vědecké konference kinantro-pologie (pp. 264–272). Praha: Fakulta tělesné výcho-vy a sportu UK.
Zemková, E., Dzurenková, D., & Pelikán, H. (2003). Odrazové schopnosti v priebehu dlhodobej športovej
prípravy v rockenrolle. Acta Fac. Educ. Phys.
Comenia-nae, XLIII, 175–180.
Zemková, E., Dzurenková, D., & Pelikán, H. (2001). As-sessment of jump abilities in rock’n’roll performers.
Homeostasis, 41(6), 265–267.
Zemková, E., Dzurenková, D., & Pelikán, H. (2002).
Odrazové schopnosti mladých rockenrollistov. Tel.
Vých. Šport, 12(3), 18–20.
Zemková, E., Hamar, D., & Schickhofer, P. (2001). Osobitosti odrazových schopností u rockenrollis-tov a rockenrollistiek. In H. Válková & Z. Hanelová
(Eds.), Pohyb a zdraví (pp. 522–525). Olomouc:
Uni-verzita Palackého.
Zemková, E., & Hamar, D. (2004). Diferenciácia
odra-zových schopností pomocou doplnkovej záťaže. Tel.
Vých. Šport, 14(2), 19–20.
VÝSKOKOVÝ ERGOMETR
V DIAGNOSTICE SPORTOVNÍ VÝKONNOSTI (Souhrn anglického textu)
přípravy, čímž pomáhá objektivizovat efekt tréninku speciálně zaměřeného na jejich rozvoj.
Klíčová slova: diagnostika trénovanosti, odrazová výbušnost, výskokový ergometr.
Erika Zemková, Mgr., PhD.
Education and previous work experience
Faculty of Physical Education and Sports, Comenius University, 1994 Master’s Degree (Physical Educa-tion and Sports), 1999 Philosophiae Doctor (Sports
Kinantropology), since 1997 work at department of Sports Medicine, Institute of Sport Sciences, Faculty of Physical Education and Sports, Comenius University, Assistant Professor, Functional assessment of athletes and teaching university courses.
Scientific orientation
Her research activities are focused on elaboration of methods and sport specific norms for the evaluation of agility, anaerobic capabilities, explosive power and postural sway.
First line publications
Zemková, E., & Dzurenková, D. (2001). Isokinetic cy-cle ergometer in the functional diagnostics of karate
athletes. Homeostasis, 41(6), 262–264.
Zemková, E., Dzurenková, D., & Pelikán, H. (2001). Assessment of jump abilities in rock’n’roll performers.
Homeostasis, 41(6), 265–267.
Zemková, E., & Hamar, D. (2002). Parameters of anaer-obic capabilities in 30 second “all-out” tests of
isoki-netic cycling and tethered running. Medicina Sportiva
Polonica, 6(1), 69.
Zemková, E., & Hamar, D. (2003). Postural sway re-sponse to exercise bouts eliciting the same heart rate with different energy yield from anaerobic glycolysis.
Medicina Sportiva Polonica, 7(4), 135–139.
Comenius University Faculty of Physical Education and Sports Svobodovo nábrežie 9 814 69 Bratislava