NETWORK APPROACH
Bakpo, F. S. and Kabari, L. G.1 2
Department of Computer science 1
University of Nigeria, Nsukka, Nigeria Email Address:[email protected]
Computer Science Department 2
Rivers State Polytechnic, Bori Email Address:[email protected]
ABSTRACT
Decisions concerning credits granting are one of the most crucial issues in an everyday banks’ policy. Well-allocated credits may become one of the biggest sources of profits for any financial organizations. On the other hand, this kind of bank’s activity is connected with high risk as big amount of bad decisions may even cause bankruptcy. The key problem consists of distinguishing good (that surely repay) and bad (that likely default) credit applicants. Credit risk evaluation is an important and interesting management science problem in financial analysis. The main idea in credit risk evaluation investigations consists of building classification rules that properly assess bank customers as good or bad. In this paper, we proposed an architecture which uses the theory of artificial neural networks and business rules to correctly determine whether a customer is good or bad. In the first step, by using clustering algorithm, clients are segmented into groups with similar features. In the second step, decision trees are built based on classification rules defined for each group of clients. To avoid redundancy, different attributes are taken into consideration during each phase of classification. The proposed approach allows for using different rules within the same data set, and for defining more accurately clients with high risk. Preliminary result indicates that the model presented is promising and reasonable.
Keywords: Credit, risk, loan, evaluation, neural networks.
1.0 INTRODUCTION
One of the most important decision problems that require delicate care is granting of loans by a financial institution (bank or home loan business). Loan applicants can be categorized into good applicants and bad applicants. Good applicants are the applicants that are worthy of giving loans based on their very high probability of returning at the stipulated
of their own experiential knowledge or intuition (other than those guidelines given from the institution) in deciding whether an applicant is loan worthy or not. Traditionally, credits are granted based on a judgmental concept using past experiences of the credit officers. This approach suffers, however, from high cost of training credit officers; frequent incorrect decisions; long period of time required to evaluate the risk category of the client and make the credit granting decision; and different decisions may be made by different credit officers for the same case. Besides, there is widespread recognition that the capability of humans to judge the worthiness of a loan is rather poor [1]. Some of the reasons for these are: (i) There is a large gray area where the decision is up to the officers, and there are cases which are not immediately obvious for decision making; (ii) Humans are prone to bias, for instance the presence of a physical or emotional condition can affect the decision making process. Also personal acquaintances with the applicants might distort the judgmental capability; (iii) Business data warehouses store historical data from the previous applications. It is therefore likely that knowledge is hidden in this data, which might be useful for a s s i s t i n g t h e d e c i s i o n m a k i n g . Unfortunately, the task of discovering useful relationships or patterns from data is difficult for humans [2]. The reasons for such difficulties are the large volume of the data to be examined, and the nature of the relationships themselves that are not obvious. Given the fact that humans are not good at evaluating loan applications, a knowledge discovery tool thus is needed to
2.0 THE CONCEPT OF ARTIFICIAL NEURAL NETWORKS
A neural network is a set of processing units (neurons) linked through connexions
[7]. Figure 2 shows the structure of artificial neural networks.
Fig. 1 The structure of artificial network (source [7])
Each i unit is represented by its activation state xi propagating to other neurons through connexions wi that slows down or accelerates the signal passage. When the activity states reach at a particular unit, they are combined together to form one value expressing the total quantity of signal reached. If this value exceeds a determined threshold (related to the neuron), then the unit is activated, otherwise inhibited. In the artificial neuron the activation state xi is a number value and the connexions wi are mathematical weights. The only value of total activation is the linear combination of activation states xi for correspondent weights wi. The net activation state is equal to the total activation state minus the threshold value. The net state is elaborated by a non- linear function f (.) and the output value y is the activation state of single neuron. There are neurons receiving signal x from the external environment (input units or input layer), and propagate the
signal through w connexions to other internal units (hidden units or hidden layers) that elaborate the sending of the signal, through other w connexions to the u n i t s s p e c i a l i z e d i n t h e s i g n a l communication (output units or output layer). The activation state of input units is determined by the external, whereas the output activation state is dictated by the modeled environment. The connexion links have a feed forward framework, that is, the signal can be propagated only in one direction. The mathematical weights have an important role because they determine the connexions and represent what the system knows. The network is able to generate a good answer (output unit) because it has training phases, which are regulated by training laws for updating the network weights.
from criticism. Most neural networks are of the "black box" kind. This means that the tool can only produce conclusions without explanations and justification of the reasons behind such conclusions. This makes accountability and reliability issues difficult to address. That is why one of the main interests in knowledge discovery research is to find ways to justify and to explain the knowledge discovery result. Other limitations concern the high computational requirements of neural networks, usually in the form of computer power and training time, and the scarcity of experts in the field, which makes some businesses avoid their use [4]. Choosing which neural network model to use is not trivial. There are several
criteria that can be followed in order to choose a suitable model [3, 8]. These criteria include data type and quantity, training requirements and functional r e q u i r e m e n t s . A c o m p r e h e n s i v e introduction to neural networks can be found in [5, 7]. Nowadays neural networks are important tools used for pattern classification, financial crime detection, process automation, time series prediction, data mining, etc.
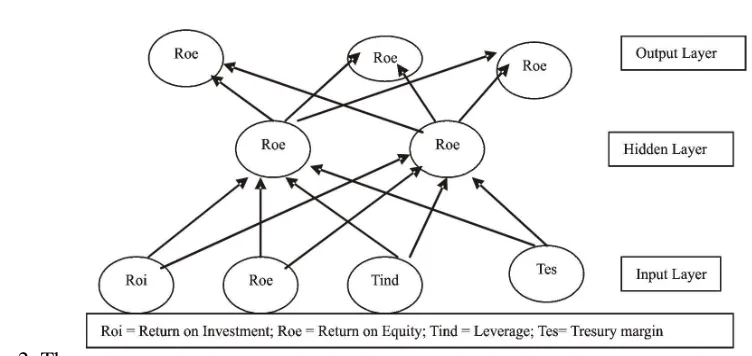
3.0 THE SYSTEM ARCHITECTURE The system architecture of the proposed credit risk evaluation system using neural networks is shown in Figure 2.
Figure 2: The neural
network layers for credit risk evaluation
The input units of the system have connexions starting but not in arriving, contrary to, the output neurons that have connexions arriving and not starting. The hidden units have connexions arriving from the input layer and continuing to the output neurons. The proposed neural network architecture works in this way:
(i) In the input layer, balance sheet data are inserted;
(ii) In the hidden layer, it calculates the activation state of each neuron;
(iii) The output layer expresses a result which is easy to interpret.
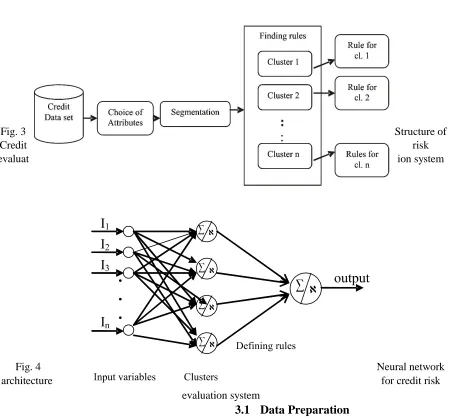
network approach is therefore composed of three main steps: Data preparation stage, Segmentation stage and Classification rules stage. The data preparation stage consists of identification of attributes to use during the next steps. The attributes are divided into two separate groups. The first one is applied in the next step to segment clients with similar features. The second group of attributes, in turn, is used to build classification rules, for each cluster of
customers, in the final stage. Each new applicant is assigned to one of the clusters and the decision concerning credits granting is taken in accordance with rules generated for it. The structure of the proposed credit risk evaluation system is presented in Figure 3, while an equivalent neural network for the system is shown in Figure 4.
Fig. 3 Structure of
Credit risk
evaluat ion system
Fig. 4 Neural network
architecture for credit risk
evaluation system
During this stage credit data attributes are divided into two groups. The first group is used in cluster analysis for segmenting incoming data, while the second group is used later for building classification rules for each cluster. Financial institutions use different attributes in processing credit data. Generally these may have quantitative as well as qualitative characters. Examples of quantitative and qualitative attributes are presented in Table 1 and Table 2, respectively.
Table 1 Examples of quantitative attributes
No Attribute name
1 Term
2 Credit amount
3 Age
4 Deposit amount
5 Payment rate
6 Number of years employed
7 Income
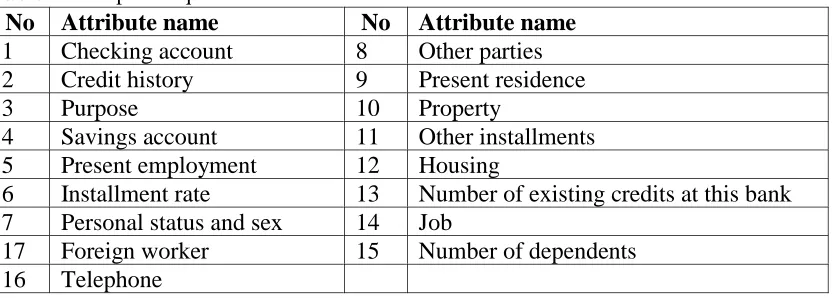
Table 2 Examples of qualitative attributes
No Attribute name No Attribute name
1 Checking account 8 Other parties
2 Credit history 9 Present residence
3 Purpose 10 Property
4 Savings account 11 Other installments
5 Present employment 12 Housing
6 Installment rate 13 Number of existing credits at this bank 7 Personal status and sex 14 Job
17 Foreign worker 15 Number of dependents
16 Telephone
Two aspects are important at this step. First, attributes must fit into classification techniques. The use of decisions trees requires that all quantitative (continuous) values be changed into qualitative (nominal). On the other hand, one should be very careful, while choosing nominal attributes for clustering techniques, as only special distance functions may work properly for variables of this type [9]. Second, a decision of an expert is necessary to correctly decide which attributes should be chosen, for every step.
3.2 Segmentation of Customers
of the method consists of total dependence on experts’ opinions in many cases. For this study, the well known, k-means algorithm has been chosen, because of its simplicity and efficacy on large data sets. However the method depends significantly on the initial assignments, which may result in not finding the most optimal cluster allocation at the end of the process. However, as it was concluded in [10], k-means is very efficient for large multidimensional data sets. Besides, tests at the early stage of building the system is promising since this will show its supremacy on agglomerative hierarchical clustering algorithms that did not give satisfying results, especially in the case of noise presence.
3.3 Building Decision Rules
In this step, a neural networks algorithm will be used. It is based on decision tree induction algorithm enhanced with improvements in handling numeric attributes, missing values, noisy data, and generating rules from trees. This technique is also equipped with tree pruning mechanism. Classification and decision rules induction are done for every cluster found in the previous stage of the system. Credit risk is evaluated for different groups of borrowers separately, as each rule is generated only on data specific to customers assigned to one cluster. Moreover, experts may even use different choice of attributes for different segments of clients. Assessment of classification accuracy is done by calculating the percentage of correctly classified instances and by estimating complexity of generated
decision trees. The latter is expressed by the number of leaf nodes and the size of obtained tree expressed by total number of nodes. Especially this feature of the decision rule is very important as experts look for clear and simple rules. If the ratio of correctly classified instances is comparable, the complexity should be the main factor deciding on the chosen rule.
4.0 EXPERIMENT, RESULTS AND DISCUSSION
This section outlined the source of data collection and experiment conducted on credit risk data. It also presented the results as well as necessary discussions.
4.1 Experiment
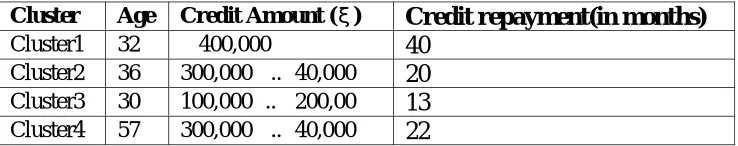
Experiments were carried out on real life credit risk data set on a chosen bank in Port Harcourt. For confidentiality, name of the bank and the actual value representing defaulters and non-defaulters are omitted in this paper. During the experiment, all quantitative data were used in the cluster analysis. Clients were then segmented into four groups as shown in Table 3 and characterized as follows:
1. Young people with big credit amount and long time of repayment.
2. Middle-age people with average credit amount and average term of repayment.
3. Young people with low credit amount and short term of repayment
4. Old people with average credit amount and average term of repayment
Cluster Age Credit Amount (x) Credit repayment(in months)
Cluster1 32 $ 400,000 40
Cluster2 36 300,000 #..#40,000 20
Cluster3 30 100,000#..# 200,00 13
Cluster4 57 300,000 #..#40,000 22
Decision rules were built, in two ways: by starting with the set of all 17 attributes and by using different attributes for each cluster. Table 4 presents the Decision table showing the decision rules for all the data. We can see that three attributes: checking account, savings account and foreign worker are used in that tree, while for each cluster only one attribute is necessary to build the rule. For example, if we consider the group of young people with big credit amount and long term of repayment the checking account attribute occurred to be crucial while for second and third clusters other installment value were deciding.
Table 4: Decision Table /decision rules
C h ecki n g account
# 0 0 #..<200 $200 No account
S a v i n g Account(al l asset)
- - - < 100 100#..<500 500#..1000 $ 1000 No savings
F o r e i g n worker
- - - Y N
Class 0 1 1 1 0 1 0 0 1
The best results were obtained by starting with the set of all 17 attributes listed in Table 3, and can be easily seen in Table 6. Although the complexity of obtained decision trees are the same, the rules are formulated by using different attributes, and the numbers of correctly classified instances in the second case, are significantly greater than in the first one. The rules received for each cluster separately are significantly less complex than the ones obtained for all the data.
4.2 Results
The accuracy of a classification method is the ability of the method to correctly
determine the class of a randomly selected data instance. It may be expressed as the percentage or probability of correctly classifying unseen data. The basic flow for the investigated credit risk evaluation system consists of the following:
1. Credit dataset is classified into segments or clusters;
2. Appropriate rules are applied to each cluster.
Figure 5 and 6 showed the classification accuracies for defaulters and non-defaulters, respectively.
To ta l Number of Cases
Correctly Classified Cases % Correctly Classified
Cluster1 4 4 100
Cluster2 8 6 75.00
Cluster3 6 5 83.33
Cluster4 12 10 83.33
TOTAL 30 25 83.33
Table 6 Classification accuracy for Non defaulters
Total Number of Cases Correctly Classified Cases % Correctly Classified
Cluster1 62 60 96.77
Cluster2 70 68 97.14
Cluster3 80 76 95.00
Cluster4 36 34 94.44
TOTAL 248 238 95.97
Defaulters correctly classified = 25/30 * 100% = 83.33% Non defaulters correctly classified = 238/248 * 100% = 95.97%
Overall percentage correctly classified = (25 + 238)/ (30 + 248) * 100% = 263/ 278 * 100% = 94.60%
4.3 Discussion
Personal discussion with the manager of the banks reveals that most people classified as defaulters are mostly cases where the customers either died or have accident. Such variables are actually very difficult to forecast. These values consequently lower the overall efficiency of the system. In application domains such as credit-risk evaluation, having a set of concise and comprehensible rules is essential. In this paper a set of rules that explains why a particular classification is made can easily be followed. This is particularly useful as the loan officer may be asked for explanations why certain applicants are chosen in preference to others. The paper has shown that neural networks can be used to classify good and bad customers in terms of credit risk to an accuracy of 94.60%. This preliminary result indicates that credit
risk evaluation model presented is promising and reasonable.
5.0 CONCLUSION
used credit risk evaluation system in Nigerian banks with an objective of fishing out the best for Nigerian banks.
References
[1] Glorfeld, L.W. and Hardgrave, B.C. (1996). An improved method for developing neural networks: The case of evaluating commercial loan creditworthiness. Computer Operation Research, 23 (10), 933-944.
[2] Handzic, M. and Aurum, A. (2001). Knowledge discovery: Some empirical evidence and directions for future research. Proceedings of the 5th. I n t e r n a t i o n a l C o n f e r e n c e o n Wirtschafts Informatics (WT2001), 19-21 September, Augsburg, Germany. [3] Bigus, J.P. (1996). Data mining with
neural networks: Solving business p r o b l e m s f r o m a p p l i c a t i o n development to decision support. McGraw Hill, USA.
[4] Marakas, G.M. (1999). Decision support systems in the twenty-first century, Prentice Hall, New Jersey, USA.
[5] Smith, K.A. (1999). Introduction to neural networks and data mining for
business applications, Eruditions Publishing, Australia.
[6] Thomas, L.C. (1998). A survey of credit and behavioural scoring: Forecasting financial risk of lending to
c u s t o m e r s .
www.bus.ed.ac.uk/working_papers/ful l_text/crc9902.pdf
[7] Haykin, S. (1999). Neural Networks: a comprehensive foundation, Second Edition, Prentice Hall, 842pp.
[8] Bakpo, F. S. (2008). Application of artificial neural networks in detection of financial crimes in Nigeria, PhD thesis, Department of Computer Engineering, Enugu State University of Science & Technology(ESUT), Agbani.
[9] Han, J. and Kamber, M. (2001). Data Mining: concepts and techniques, Morgan Kaufmann Publishers
![Fig. 1 The structure of artificial network (source [7])](https://thumb-us.123doks.com/thumbv2/123dok_us/10055527.1991879/3.612.153.465.199.331/fig-structure-artificial-network-source.webp)