Vol.9 (2019) No. 2
ISSN: 2088-5334
Relationship between Mathematical Parameters of Modified Van der
Pol Oscillator Model and ECG Morphological Features
Francesca Silvestri
#, Simone Acciarito
#, Gauray Mani Khanal
# #University of Rome Tor Vergata, Dept. of Electronic Engineering
E-mail: [email protected]; [email protected]; [email protected]
Abstract— The mathematical model describes the electrical and mechanical activity of the cardiac conduction system thought set of differential equations. By changing the value of parameters included in these equations, it is possible to change the amplitude and the period of ECG waves. Although this model is a powerful tool for modeling the electrical activity of the heart, its use is often limited to those familiar with the differential equations that describe the system. The purpose of this work is to provide a system that allows generating an ECG signal using Ryzhii model without knowing the details of differential equations. First, we provide the relationships between the ECG wave features and the model parameters; then we generalize them through fitting neural networks. Finally, putting in series fitting neural network and heart model, we provide a system that allows generating a synthetic signal by setting as input only the morphological ECG feature. We computed numerical simulation in Simulink environment and implemented the fitting neural networks in Matlab. Results show that non-linear trends characterize the correlation functions between ECG morphological features and model parameters and that the fitting neural networks can generalized this trend by providing the model parameters given in input the respectively ECG feature.
Keywords— heart model; Van der Pol; FitzHugh-Nagumo; relaxation oscillator; fitting neural network; classification.
I. INTRODUCTION
Over the years, the dynamic of the heartbeat was analyzed through both mathematical model and time series analysis. In recent years, further help has come from the spread of various artificial intelligence techniques [1]–[15], many of which are based on neural networks that use the latest technologies [16]–[21]. Despite the wide use of the time series for the study of ECG signal, the complexity, nonlinearity, and nonstationarity of the cardiovascular system make common the use of nonlinear signal analysis for the modeling of heart activity [22]. Mathematical modeling is becoming a powerful tool for improving our understanding of electrical activation in the heart, in particular, the generation and propagation of both normal and abnormal rhythms [23], [24]. Van der Pol and Van der Mark for the first time described and modeled the dynamic behavior of the heart using nonlinear relaxation oscillators [25]. Their work has become the start point of lots of studies on heart behavior modeling. Afterward, a lot of researchers worked on an extended and modified version of Van der Pol model [26]–[28]. In the last years, the characterization of electrical muscle responses was proposed by Ryzhii [29] using a quiescent excitable FitzHugh-Nagumo-type (FHN) oscillators. Successively, Ryzhii improved their model
including a description for depolarization and repolarization waves of the atrias and ventricles utilizing different modified FHN systems for each ECG waves [30]. The advanced model was able to generate normal ECG signal and several well-known rhythm disorders. In particular, it reproduces sinus tachycardia, sinus bradycardia, complete SA-AV block, and complete AV -HP block [31]. This model describes the electrical and mechanical activity of the cardiac system thought the set of differential equations. The parameters included in these equations make it possible to describe different cardiac behavior. By modifying the model parameters, it is possible to change the amplitude and the time duration of the ECG waves, reproducing both physiological and pathological behavior. Although this mathematical model allows describing the morphology of the electrical activity, the relationships between model parameters and morphological characteristics of ECG waves are not provided. In particular, it is not possible to set the model parameters in intuitive mode knowing the characteristics of the waves composing ECG signal.
link the morphological characteristics of the signal to the variance of the model parameters. In particular, we implemented the mathematical model proposed by Ryzhii [30] in the Simulink environment. Then, we generalized the characteristic relationships using fitting neural networks. We implemented the neural networks in the Matlab environment and, finally, we used the results of the fitting neural networks as the input of the heart model. In this way, we provide a system that, without knowing the meaning of each parameter, allows to generate synthetic ECG waveforms.
The paper is organized as follows: in Sec.2 the principal morphological characteristics of ECG waves are described. In Sec.3 mathematical model to reproduce synthetic ECG signal is explained. In Sect.4 material and method are provided. In Sec.5 results and discussion are shown, and finally, in Sect.6 conclusions are discussed.
A. Electrocardiographic signal
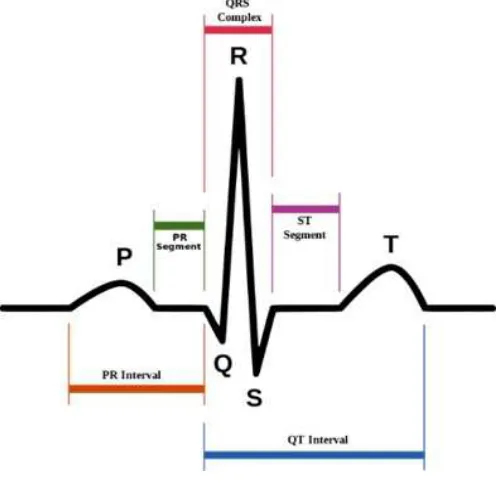
Depolarization and repolarization of cardiac cells can be recorded from the body surface by the ECG. Figure 1 shows a normal ECG signal. The P-wave represents atrial depolarization, the QRS complex represents ventricular depolarization, and the isoelectric period between these two waves represents the AV node and His bundle activation. Finally, the T-wave represents ventricular repolarization [32].
Fig. 1 - Normal ECG signal
Another important data component is the temporal relationship of these waves. The PR-interval is measured from the beginning of the P -wave to the beginning of the QRS complex and indicates the time interval between the onset of atrial activation and the onset of ventricular activation. The normal PR-interval in adults is less than 0.20 s. The QT -interval is measured from the beginning of the QRS to the terminal portion of the T -wave. It represents a global measure of the ventricular plateau phase duration. Tab.1 shows the characteristic values of ECG waves and their temporal relationship.
TABLEI
CHARACTERISTIC VALUES OF ECG WAVES AND THEIR TEMPORAL RELATIONSHIP
Event Duration [sec]
Amplitude
[mV] Meaning
P Wave 0.07-0.12 0.2-0.4 Atria depolarization
QRS Complex 0.06-0.10 1-2 Ventricles depolarization
T Wave 0.18-0.20 0.4-0.5 Ventricles repolarization
PR Interval 0.12-0.20 Atria-ventricles conduction time
QT Interval 0.40-0.42
Ventricles depolarization repolarization time ST Interval 0.30-0.34 Isoelectric section
RR Interval 0.8-0.9 Cardiac cycle duration
B. Mathematical model
Ryzhii describes the three natural pacemakers SA, AV and HP bundle by a system of modified asymmetric VdP equations with unidirectional time-delay velocity coupling [29]:
where xi (t) and yi (t) correspond to the cardiac action potential and transmembrane currents, ai(xi− uij)(xi− uik) are
the damping terms, fixi(xi − dij)(xi − eik) are the harmonic
force terms, ai > 0 and uij are the parameters representing non-linear damping force, fi are the parameters related to the intrinsic frequency of oscillator, the coupling coefficients KSA−AV and KAV−HP represent unidirectional coupling between the pacemakers. The synchronization level between three oscillators depends on the coupling coefficients K ([33], [34]). Choosing proper coupling coefficients KSA−AV and KAV−HP is possible not to use time delays in coupling terms in order to consider the different frequency rate of the three oscillators.
The parameters ai, uij, fi, di, ei, were choosen in order to obtain intrinsic oscillation rates of 70 bpm, 50 bpm, 35 bpm and 35 bpm for uncoupled SA, AV, RB and LB, respectively. In particular, we used the following experimental parameters: a1 = 40, a2 = 50, a3 = 50, a1 = 40, u11 = 0.83, u21 = 0.83, u31 = 0.83, u12 = −0.83, u22 = −0.83, u32 = −0.83, f1 = 25, f2 = 8.4, f3
Fig. 2 Conceptual model with three coupled oscillators
The FitzHugh-Nagumo equations can reproduce the excitable nature of cardiac myocytes, including the presence of a refractory period. Starting from modified FHN model proposed by Ryzhii in [30], we describe the depolarization and repolarization process for atrial (AT) and ventricles (VN) muscles:
where ki are the scaling coefficients. In our work we used the following experimental parameters: k1 = 2 ∗ 103, k2 = 4 ∗
104, k3 = 104, k4 = 2 ∗ 103, c1 = c2 = 0.26, c3 = 0.3, c4 = 0.1
b1 = b2 = b4 = 0, b3 = 0.015, dm1 = dm2 = 0.4, dm3 = 0.09, dm4 = 0.1, h1 = h2 = 0.004, h3 = h4 = 0.008, g1 = g2 = g3 = g4 = 1, w11 = 0.13, w12 = 1.0, w22 = 1.0, w21 = 0.19, w31 = 0.12, w32 = 1.1, w41 = 0.22, w42 = 0.8.
The activation currents Ii represent the coupling between the SA and AT muscle and between HP pacemaker and VN muscles. Concerning the Ryzhii model [30], we adjusted the activation currents for the QRS complex and T wave to consider HP oscillator composed by the RB and LB oscillators:
where KATDe = 9 ∗ 10−5, KATRe = 3 ∗ 10−5, KVNDe = 9 ∗
10−5 and KVNRe = 9 ∗ 10−5. Finally, we obtained the
synthetic ECG signal as a composition of AT and VN waveforms as following:
ECG = z0 + z1− z2 + kRz3 + z4 (12)
where z0 = 0.2 provides the adjustment of baseline and kR is a multiplicative coefficient to modulate the amplitude of R peak.
II. MATERIAL AND METHOD
The method is composed of the following steps:
• Model parameters, signal features, and their relationship
• Training, test, and validation of the fitting neural networks
• Parameters obtained through the neural network: application to the model
A. Model parameters, signal features, and their relationship
First, we investigated the relationships between the characteristic features of ECG waves (Table.1) and heart model parameters. What are the parameters that change the morphological features of ECG waves (Fig.3) ?
Fig. 3 Relationship between ECG waves features and heart model parameters
To answer this question, we implemented the mathematical model of Ryzhii [30] in the Simulink environment. In the first step, we looked which mathematical constant or variable of the model allows modifying the amplitude and the temporal intervals of the ECG waves in according to the Table.1. In this way, for each morphological feature FECG of the ECG signal corresponds a specific parameter Pm of the model. In the second step, we defined the operating ranges of the model parameters. To evaluate the operating intervals of every Pm, we performed a series of simulations in Simulink. In particular, by knowing the specific interval of each ECG wave (Table.1), we have changed the operative value of the matched Pm until it returns the ECG signal with the desired morphological characteristics. In the third step, we have found the correlation function between FECG and the corresponding Pm (Fig.4).
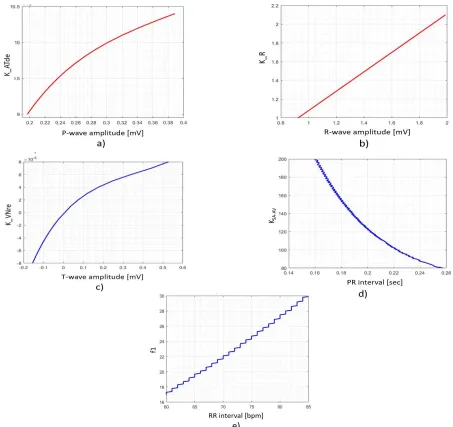
Fig. 4 - Correlation function between Pm and the corresponding FECG
B. Training, Test, and Validation of the Fitting Neural
Networks
In the second phase, we generalized the relationships FECG-Pm defined in the previous paragraph by a neural network. Neural networks provide a tool for the fast solution of repetitive non-linear curve fitting problems. In particular, function fitting is the process of training a neural network on a set of inputs to produce an associated set of target outputs. Fig.5 shows the conceptual scheme.
Fig. 5 - Generalization of the relationships FECG-Pm using fitting neural network
TABLEII
NEURAL NETWORK CHARACTERIZATION (LM=LEVENBERG-MARQUARDT, BR=BAYESIAN REGULARIZATION)
Event Model
parameters Neurons
Training Function
Transfer Function
P wave KAT de = [9, 10.5] ∗
10−5 10 LM tansig
QRS
complex KR = [1, 2.1] 10 LM tansig
T wave KV Nre = [−8, 8] ∗
10−5 20 BR tansig
PR interval KSA−AV = [80,
200] 20 BR tansig
RR interval f1 = [20, 30] 20 BR hardlims
First, we constructed the network with the desired hidden layers and the training algorithm; then we trained it using the ECG features as a set of training data and the model parameters Pm as the training label. Once the neural network adapts to the data, it forms a generalization of the input-output relationship. In other words, given the ECG feature as
input, the fitting neural network can provide the respectively model parameter as output. Table 2 shows the set-up of fitting neural networks. For each ECG feature, a custom neural network was created.
In particular, the chosen transfer function depending on the relation curve between the ECG wave feature and model parameter. For the training of P -wave and QRS -complex, we used Levenberg-Marquardt function. It is a training function that updates weight and bias values according to Levenberg-Marquardt optimization. Whereas, for T -wave, PR-interval, and RR-interval we used Bayesian Regularization function. It is a training function that updates the weight and bias values according to Levenberg-Marquardt optimization. It minimizes a combination of squared errors and weights and then determines the correct combination to produce a network that generalizes well. The process is called Bayesian regularization.
C. Parameters Obtained through the Neural Network:
Application to the Model
Once defined and modeled, with an appropriate neural network, the relationships between FECG - Pm, we have verified the results using the system shown in Fig.6.
For example, we want to simulate an ECG signal characterized by a particular amplitude of the P-wave. This feature represents the input of the fitting neural network that returns as output the model parameter KATde. The parameter KATde in input to the heart model generates the synthetic ECG signal. To validate that the output signal is correct, the P - wave amplitude (ḞECG) was extracted using a modified version of the Pan & Tompkins algorithm. Finally, the amplitude of P -wave in the input (FECG) and the amplitude of P-wave of the synthetic ECG signal in output (ḞECG) were compared. The validation test was repeated for all ECG features in their range of applicability.
Fig. 6 - Conceptual scheme
III.RESULT AND DISCUSSION
Tab.3 shows the relationships FECG-Pm searched in paragraph 4A. It is an extension of the Tab.1, where at each range of amplitude and time interval of ECG waves corresponds the model parameter associated.
IVNRe which represent the couplings between the SA ad HP pacemakers and AT and VN muscles.
TABLEIII
ECG WAVES AND RESPECTIVE MODEL PARAMETERS
Event Duration [sec]
Amplitude [mV]
Model parameters
P wave 0.07-0.12 0.2-0.4 KAT de = [9, 10.5] ∗
10−5 QRS complex 0.06-0.10 1-2 KR = [1, 2.1]
T wave 0.18-0.20 0.4-0.5 KV Nre = [−8, 8] ∗ 10−5
PR interval 0.12-0.20 - KSA−AV = [80, 200]
RR interval 0.8-0.9 - f1 = [20, 30]
To control the time interval between waves (PR, RR, ST -interval) we used the coupling coefficients. They provide proper synchronization behavior of pacemakers in a wide range of heart rhythms. In particular, PR-interval represents
the time between the atria depolarization, that generates the P-wave, and ventricles depolarization, that generates the QRS complex. To manage this interval range we worked on the KSA−AV coupling coefficient because it provides synchronization in the SA and AV oscillators interaction. It is important to notice that not for all morphological features of ECG signal exist the corresponding model parameter. For example, with this heart model, it is not possible to change the duration of ST and QT-intervals. For this reason, they do not appear in Tab.2
Fig.7 shows the correlation graphs of the related behavior between morphological ECG features and model parameters. From these graphs, it is possible to notice that only kR and R-wave amplitude show linear functional behavior. In this case, increasing kR in the model equation proportionally increases R-amplitude. Whereas, for the other parameters, there are non-linear functional trends. In these cases, it is not possible, by knowing the ECG wave amplitudes or periods, to set the corresponding model parameters.
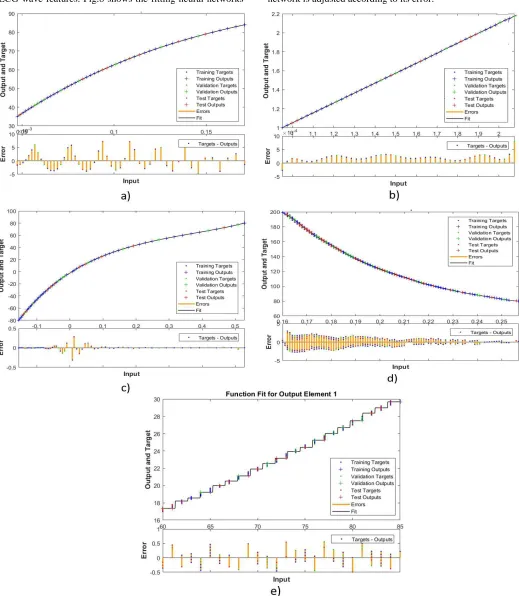
By implementing the fitting neural networks, we showed how they can predict the model parameters given in entry the ECG wave features. Fig.8 shows the fitting neural networks
results. The blue dots represent the training targets, the data presented to the network during the training phase, and the network is adjusted according to its error.
The green dots represent the validation targets; the data set used to measure network generalization and to halt training when generalization stops improving. The red dots represent the test targets; these do not affect training and provide an independent measure of network performance during and after training. Finally, the black line represents the fitting curve searched. The blue, green and red crosses represent respectively training, validation and test outputs that are the result of the network for specific ECG features in the input. The error is the difference between targets and outputs. It is possible to notice that in a) and b) cases the error about zero. In the case of c) it is about zero, besides in the part in which the trend changes. It can depend on the training data size. In d) and e) cases the error is more than zero, but the networks can generalize the relationships FECG-Pm.
IV.CONCLUSION
In this paper, we provide a system that allows generating an ECG signal using Ryzhii model [30] without knowing the details of differential equations. Although the mathematical model is a powerful tool for modeling the electrical and mechanical activity of the heart, its use is limited to those familiar with the differential equations that describe the system. We provide the correlation functions that link the ECG features and model parameters and generalized them with fitting neural networks. Finally, we used the output of the neural network as the input of the mathematical heart model. In this way, we generate ECG signal only setting the amplitude and the time duration of waves composing ECG signal. Results show that the relationships between ECG features and model parameters present a non-linear trend and that the fitting neural networks can generalize them with an acceptable error. Considering the enormous spread of IoT devices [38], this type of system, as well as other complex systems useful for health care [39], will necessarily have to be integrated into low energy consumption portable embedded devices [40]–42] which will allow monitoring the quality of patients' health more efficiently.
REFERENCES
[1] Pieroni, A., Scarpato, N., Di Nunzio, L., Fallucchi, F., & Raso, M. Smarter city: Smart energy grid based on blockchain technology. 2018 International Journal on Advanced Science, Engineering and Information Technology, 8(1), 298-306.
[2] Daniele Giardino, Marco Matta, Francesca Silvestri, Sergio Spanò and Valerio Trobiani, "FPGA Implementation of Hand-written Number Recognition Based on CNN," International Journal on Advanced Science, Engineering and Information Technology, vol. 9, no. 1, pp. 167-171, 2019
[3] Hernandez, L., Guzman, H., Ospino, J., Freyle, J., & Pranolo, A. Design and implementation of a marking strategy to increase the contact ability in the call centers based on machine learning. 2019 International Journal on Advanced Science, Engineering and Information Technology, 9(1)
[4] Siñel1, I. D. M., & Comendador, B. E. V. (2019). Rate movie app: Implementation of k-nearest neighbor’s algorithm in the development of a decision support system for Philippine movie rating and classification. International Journal on Advanced Science, Engineering and Information Technology, 9(1), 92-99
[5] Jaber, A. A., Saleh, A. A. M., & Ali, H. F. M. Prediction of hourly cooling energy consumption of educational buildings using an artificial neural network. 2019 International Journal on Advanced Science, Engineering and Information Technology, 9(1), 159-166
[6] Meraj, S. S., Yaakob, R., Azman, A., Rum, S. N. M., & Nazri, A. S. A. Artificial intelligence in diagnosing tuberculosis: A review. 2019 International Journal on Advanced Science, Engineering and Information Technology, 9(1), 81-91.
[7] llah, A., Mohd Nawi, N., Arifianto, A., Ahmed, I., Aamir, M., & Khan, S. N. A real-time wheat classification system for selective herbicides using broad wheat estimation in a deep neural network. 2019 International Journal on Advanced Science, Engineering and Information Technology, 9(1), 153-158
[8] Choi, D. -., & Park, J. A study on machine learning based lightweight authentication vector. 2018 International Journal on Advanced Science, Engineering and Information Technology, 8(4), 1327-1332.
[9] Saharuddin, S. S., Murli, N., & Hasibuan, M. A.. Classification of spatiotemporal fMRI data in the spiking neural network. 2018 International Journal on Advanced Science, Engineering and Information Technology, 8(6), 2670-2676
[10] Hidra Amnur Customer Relationship Management and Machine Learning Technology for Identifying the Customer JOIV: International Journal on Informatics Visualization Vol 1, No 1 (2017) [11] Aldo Erianda, Indri Rahmayuni Improvement of Email And Twitter Classification Accuracy Based On Preprocessing Bayes Naive Classifier Optimization In Integrated Digital Assistant JOIV: International Journal on Informatics Visualization Vol 1, No 2 (2017) [12] Hamijah Mohd Rahman, Nureize Arbaiy, Muhammad
Shukeri Che Lah, Norlida Hassan Exploratory Study of Kohonen Network for Human Health State Classification Naive Classifier Optimization In Integrated Digital Assistant JOIV: International Journal on Informatics Visualization Vol 2, No 3-2 (2018)
[13] Kasra Madadipouya A Survey on Data Mining Algorithms and Techniques in Medicine JOIV: International Journal on Informatics Visualization Vol 1, No 3 (2017)
[14] Marco Matta, Sergio Spano, Gian Carlo Cardarilli, Luca Di Nunzio, Rocco Fazzolari, Marco re, Daniele Giardino, Francesca Silvestri RTS: a Real-Time Swarm Intelligence based on Multi-Agent Q-Learning 2019 IET Electronics Letters ARTICLE IN PRESS [15] G.C. Cardarilli, L. Di Nunzio, R. Fazzolari, D. Giardino, M. Matta,
M. Re, F. Silvestri, S. Spanò Efficient Ensemble Machine Learning implementation on FPGA using Partial Reconfiguration (2019), ) in: International Conference on Applications in Electronics Pervading Industry, Environment and Society. Springer, 2019
[16] Khanal, G.M., Cardarilli, G., Chakraborty, A., Acciarito, S., Mulla, M.Y., Di Nunzio, L., Fazzolari, R., and Re, M. A ZnO-rGO composite thin film discrete memristor (2016) IEEE International Conference on Semiconductor Electronics, Proceedings, ICSE, 2016-September, art. no. 7573608, pp. 129-132
[17] Khanal, G.M., Acciarito, S., Cardarilli, G.C., Chakraborty, A., Di Nunzio, L., Fazzolari, R., Cristini, A., M. Re, Susi, G. Synaptic behavior in ZnO-rGO composites thin film memristor (2017) Electronics Letters, 53 (5), pp. 296-298.
[18] Acciarito, S., Cristini, A., Di Nunzio, L., Khanal, G.M., Susi, G. An a VLSI driving circuit for memristor-based STDP 12th Conference on Ph.D. Research in Microelectronics and Electronics, PRIME 2016, art. no. 7519503
[19] Cardarilli, G. C., Cristini, A., Di Nunzio, L., Re, M., Salerno, M., & Susi, G.. Spiking neural networks based on LIF with latency: Simulation and synchronization effects. 2013 IEEE Asilomar Conference on Signals, Systems and Computers, 1838-1842 [20] Acciarito, S., Cardarilli, G.C., Cristini, A., Nunzio, L.D., Fazzolari,
R., Khanal, G.M., Re, M., Susi, G. Hardware design of LIF with Latency neuron model with memristive STDP synapses (2017) 59, pp. 81-89.
[21] Khanal, G., Acciarito, S., Cardarilli, G.C., Chakraborty, A., Di Nunzio, L., Fazzolari, R., Cristini, A., Susi, G., Re, M. ZnO-rGO composite thin film resistive switching device: Emulating biological synapse behavior (2017) 429, pp. 117-123.
[22] U.R.Acharya and O.Faust and V.Sree and G.Swapna and R.J.Martis and N.A.Kadri and J.S.Suri, Linear and nonlinear analysis of normal and CAD affected heart rate signals, Comput. Methods Prog. Biomed. vol. 6, pp 55-68, 2014.
[23] N.Denis, Modelling the heart: insights, failures, and progress, BioEssays, vol. 24, num. 12, pp. 1155-1163, 2002. doi 10.1002/bies.10186
Encyclopedia of Biomedical Engineering, 2006. doi 10.1002/9780471740360.ebs1577
[25] Van der Pol and Van der Mark, The heartbeat considered as a relaxation oscillator and an electrical model of the heart, Physica A, vol. 6, pp. 763-775, 1928.
[26] FitzHugh, Impulses and physiological states in theoretical models of nerve membrane, Biophys. J., vol. 1, pp.445-446, 1961.
[27] K.Grudzinski and J.J.Zebrowski, Modeling cardiac pacemakers with relaxation oscillators, Physica A, vol. 336, pp.153-162, 2004. [28] S.R.S.M.Gois and M.A.Savi, An analysis of heart rhythm dynamics
using three-coupled oscillator model, Chaos Solitons Fractals, vol. 41, pp. 2553-2565, 2009.
[29] E.Ryzhii and M.Ryzhii, Modeling of heartbeat dynamics with a system of coupled nonlinear oscillators, Communications in Computer and Information Science, vol. 404, pp. 67-75, 2014. [30] E.Ryzhii and M.Ryzhii, A heterogeneous coupled oscillator model
for simulation of ECG signals, Computer methods and programs in biomedicine”, vol. 117, pp.40-49, 2014
[31] E.Ryzhii and M.Ryzhii, Formation of second-degree atrioventricular blocks in the cardiac heterogeneous oscillator model, Engineering in Medicine and Biology Society (EMBC) - 37th Annual International Conference of the IEEE, 2015.
[32] F.M.Kusumoto, ECG Interpretation: from pathophysiology to clinical application, Springer US”, 2009
[33] A.M.Dos Santos and S.R.Lopes and R.L.Viana, Rhythm synchronization land chaotic modulation of coupled van der Pol oscillators in a model for the heartbeat, Physica A, vol. 338, pp. 335-355, 2004.
[34] E.Ryzhii and M.Ryzhii and V.Savchenko, Effect of coupling on the pacemaker synchronization in coupled oscillator ECG model, Conference on Biomedical and Sciences, pp. 281-286, 2014.
[35] J. Pan and W.J. Tompkins, A real-time QRS detection algorithm, IEEE Trans. Biomed. Eng., vol. BME-32, pp. 230-236, 1985 [36] F.Silvestri and G.C.Cardarilli and L.Di Nunzio and R.Fazzolari and
M.Re, Comparison of low-complexity algorithms for real-time QRS detection using standard ECG database, Int. Journal on advance science engineering information technology, vol. 82, pp. 307-314, 2018.
[37] Soernmo and Laguna, Bioelectrical signal processing in cardiac and neurological applications, Accademic press Elsevier, 2005.
[38] Scarpato N., Pieroni A., Di Nunzio L., Fallucchi F.. E-health-IoT universe: A review, 2017 International Journal on Advanced Science, Engineering and Information Technology 7(6), pp. 2328-2336
[39] Quitadamo, L.R., Abbafati, M., Cardarilli, G.C., Mattia, D., Cincotti, F., Babiloni, F., Marciani, M.G., Bianchi, L. Evaluation of the performances of different P300 based brain-computer interfaces by means of the efficiency metric (2012) 203 (2), pp. 361-368. [40] Silvestri, F., Acciarito, S., Cardarilli, G. C., Khanal, G. M., Di
Nunzio, L., Fazzolari, R., & Re, M. FPGA implementation of a low-power QRS extractor 2019 Lecture Notes in Electrical Engineering 512, pp. 9-15
[41] Cardarilli, G.C., Di Nunzio, L., Fazzolari, R., Re, M., Silvestri, F. and Spanò, S. 2018, Energy consumption saving in embedded microprocessors using hardware accelerators, Telkomnika (Telecommunication Computing Electronics and Control), vol. 16, no. 3, pp. 1019-1026.