on WebGIS
Wenjuan Lu
a,*, Aiguo Liu
b, Chengcheng Zhang
aaChinese Academy of Surveying and Mapping, China, [email protected],[email protected] bBeijing Aerospace Hongtu Information Technology Co., Ltd. China,[email protected]
* Corresponding author: Wenjuan Lu
Abstract: With the development of geographic information technology, the way to get geographical information is constantly, and the data of space-time is exploding, and more and more scholars have started to develop a field of data processing and space and time analysis. In this, the traditional data visualization technology is high in popularity and simple and easy to understand, through simple pie chart and histogram, which can reveal and analyze the characteristics of the data itself, but still cannot combine with the map better to display the hidden time and space information to exert its application value. How to fully explore the spatiotemporal information contained in massive data and accurately explore the spatial distribution and variation rules of geographical things and phenomena is a key research problem at present. Based on this, this paper designed and constructed a universal thematic data visual analysis system that supports the full functions of data warehousing, data management, data analysis and data visualization. In this paper, Weifang city is taken as the research area, starting from the aspects of rainfall interpolation analysis and population comprehensive analysis of Weifang, etc., the author realizes the fast and efficient display under the big data set, and fully displays the characteristics of spatial and temporal data through the visualization effect of thematic data. At the same time, Cassandra distributed database is adopted in this research, which can also store, manage and analyze big data. To a certain extent, it reduces the pressure of front-end map drawing, and has good query analysis efficiency and fast processing ability.
Keywords:WebGIS; geographical data; visualization; Echarts
1. Introduction
With the rapid development of the science and technology, the means of obtaining geographic information is continuously enriched, and big data has occupied various fields of continuous development with its unique advantages, and the concept of "big data" has gradually caused heated discussion in all walks of life. People concluded that big data has 4V characteristics, that is, huge volume, various types, high velocity and value density (He,2017). Geographical information data naturally has big data attributes, especially in the Internet era, there are many data information related to geographical location emerged. Traditional data analysis and expression can no longer meet the needs of users. How to quickly extract valuable information from massive geographic data and present it in an intuitive way is essential for effective decision making by users. Geographic data visualization is one of the key technologies to solve the above problem. At present, scholars and experts at home and abroad have done a lot of research work and achieved many results.Research on visualization platforms and tools has gone through VC++, MATLAB, Flash, SVG, Echarts and more. Based on VC++, MATLAB and other visualization technology (Ma et al., 2017; Zhao et al., 2017; Zhang et al., 2018), it can display a small amount of data visually and cannot meet the huge data requirements. Flash-based visualization technology (Bian, et al., 2012; Zhang, et al., 2017; Xue, et al., 2016) requires plug-in installation and external
development trend with the help of this new and efficient visual interface.
2. Web front-end visualization technology
2.1 Related technology introduction
2.1.1 Introduction to the Echarts Class Library
With the promotion of the new generation of Internet core language HTML5 (Song et al., 2017), the front-end graphics rendering through the Canvas API has become a mainstream technology, so there are a variety of open source projects, including well-known representative works at home and abroad including D3, Highcharts (Highsoft Company), Echarts (BaiDu Company) and so on. ECharts is a very good visual chart control in China, and it is an open source visualization library implemented in JavaScript. It can run smoothly on PC and is compatible with most current browsers (IE8/9/10/11, Chrome, Firefox, Safari, and so on), the underlying reliance on lightweight vector graphics library ZRender, provides intuitive, interactive rich, highly customizable data visualization charts. It has the following advantages: rich visualization type; front-end display of millions of data; rendering scheme, cross-platform use; multi-dimensional data support and rich visual coding means; brilliant special effects. Considering Canvas and SVG visualization technology, this paper uses the interface of Echarts library to visualize the geographic data.
2.1.2 Introduction to the Cassandra database
Cassandra is a completely distributed and highly scalable non-relational database based on P2P decentralization architecture (Dias, et al., 2018; Wang, et al., 2016; Huang, et al., 2018). Its main feature is that it is not a database, but a distributed network service composed of a bunch of database nodes. A write operation to Cassandra will be copied to other nodes, and the read operation of Cassandra will also be Route to a node to read. For a Cassandra cluster, scaling performance is a relatively simple matter, just add nodes to the cluster. Test 2.1 proves that the Cassandra distributed database query efficiency is significantly improved compared with the traditional RDBMS database.
2.2 Visual technology framework
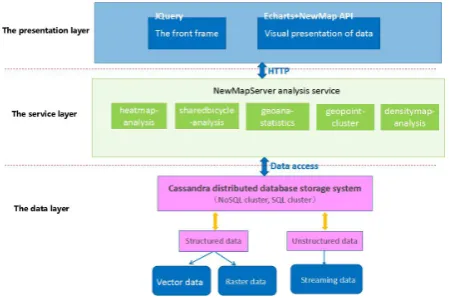
Considering the usability of the system, the system adopts the B/S architectural mode. and the user can access the system through the browser, which greatly simplifies the development, maintenance and use of the system. The system architecture diagram is shown in figure 1. The architecture consists of a data layer, a service layer, and a presentation layer.
Figure 1. System technology architecture
The data layer is a data storage layer for geographic data visualization, including structured data (vector data, grid data), and unstructured data (streaming data). This paper mainly uses Cassandra distributed database to store data. It is a fully distributed, highly scalable non-relational database based on P2P decentralized architecture. Users can perform data-time operations, overlay analysis, etc. through data operation interface. Operation, at the same time through the provision of spatial data pre-processing and quality inspection functions, the processing results can be put into the data cache, improve the performance of data scheduling through cache management, and then enter the Cassandra database to complete the data access. Subsequent only need to perform the same analysis and processing on the data, and directly obtain the analyzed result from the database, and do not need to perform repeated operations, which greatly improves the performance of data scheduling, and the user experience is also enhanced.
The service layer is the core architecture layer that provides data information for the presentation layer, and is the main way for clients to access the database. After the presentation layer sends the HTTP request, the service layer receives the request and parses it, and then calls the corresponding interface module for processing. The interface module mainly includes heat map analysis, shared bicycle analysis,statistical analysis(geoana-statistics), and point aggregate analysis (geopoint-cluster) and interpolation analysis (densitymap-analysis), etc., after the processing is finished, the result is returned to the presentation layer in Geojson format.
Academy of Surveying and Mapping.
2.3 The client visualizes the rendering technology
The NewMap Server software provides map services and data analysis services, in which map services provide service base maps, such as OGC WMTS, WMS services, etc. Data analysis services include statistical analysis, interpolation analysis, aggregation analysis and other services. By sending Ajax request interface through HTTP, users can obtain the analysis results directly from the Cassandra database, and return the GeoJson data format, and obtain the basic information of client visualization through parsing.
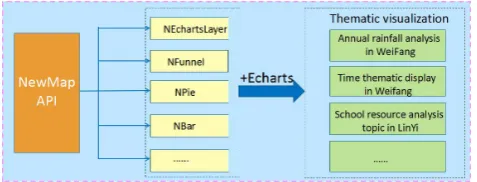
This paper starts with the Echarts visual class library, analyzes the implementation process of its internal visualization, studies the data format required for its visual expression, and combines it with the map using the NewMap API. Finally, based on the two, it develops the visual representation of the applicable front-end geographic data. The thematic map interface, with its technical advantages of portability, can be quickly applied to other projects, as shown in figure 2.
Figure 2. Thematic visualization interface
Echarts provides a number of charts for performance types such as pie charts and histograms, but only for general data visualization applications, but for geographic data with spatial positional relationships, maps are combined with statistical charts. This kind of coordinate-based chart can not only visually display the data distribution through the color change performance value, but also discover some hidden geographical laws according to the time change, which plays a vital role in the user's decision.Based on the NewMap API interface, this article further encapsulates the interface suitable for visual representation of thematic maps, such as EchartsLayer. The specific EchartsLayer class is defined as follows:
Figure 3. Definition of the EchartsLayer class
Add the EchartsLayer layer class to the map through the Map class, EchartsLayer is used as the overlay layer, and superimposed on the OGC WMTS/WMS basemap released by NewMapServer to realize the combination with the map. Then, the user sends a request to the server
in the form of a Web Service through the browser, and transmits parameters such as the topic type to be acquired. After receiving the request to parse the URL, the server invokes the corresponding thematic service and transmits it according to the data model prototyped by Geojson. The model has a small amount of data, and can quickly respond to the client with the data stream responded by the server, facilitating user resolution. The following is a description of the Geojson data model format obtained by requesting statistical analysis:
Figure 4.Get the Geojson data model format
In the data model, the ‘type’ field is the thematic map type; the result field contains the statistical/analysis information of the thematic map and the spatial information of the mapped position; each region is an object, the name is the region name, and the value is the individual statistics/ The value of the analysis field, the geometry field indicates whether the client type is a point or a face. In the example, type: Point indicates that the client generates a point symbol, and coordinates is the coordinate position information of the point. The Geojson data model returns all the information of the visualization to the client, and can request multiple responses at a time, greatly improving the interactivity and system efficiency of the client visualization. After the client parses the Geojson data, it first determines the spatial position of the geographic data by accurately matching the coordinate coordinates with the map service, and then places the Echarts graphic parameters to be created in the option parameter of the EchartsLayer class to generate various thematic symbols.
3. Visualization instance
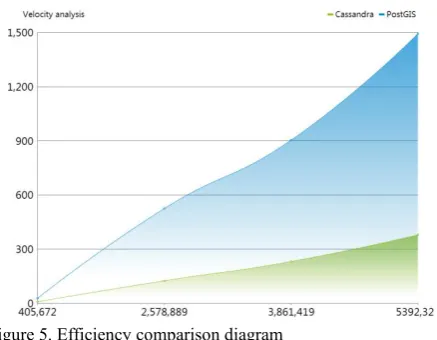
3.1 Query efficiency comparison test
Figure 5. Efficiency comparison diagram
Experiment 2: performance testing and analysis under high concurrency conditions
Experiment 2 mainly verifies the data processing capability of the distributed spatial index strategy proposed in this paper under high concurrency conditions. First, 300 polygons with uniform distribution in the study area were randomly generated as the query area. Then, the spatial query operation described in experiment 1 was conducted for each query area, and the number of concurrent threads was gradually increased. Finally, the total time consumed for all the queries was counted. The experimental results are shown in figure 6.
Figure 6. Index performance test results under concurrent conditions
Compared with figure 5 and figure 6, we can draw the following conclusions. First, the query efficiency of Cassandra under multi-threading conditions is significantly improved compared with figure 5, mainly because the distributed environment reduces the system load. And with the increase in task concurrency, time takes up and down, but the overall time is relatively stable. This is because the time consuming is related to the real-time load state of each node at runtime, tasks are randomly assigned, some tasks have a large amount of queries, and some tasks are queried. The amount is small. When the load conditions of each node are similar, the randomly selected nodes may have a large amount of queries. Secondly, Cassandra itself adopts the asynchronous query mechanism, that is, the received data
query operation is pre-stored in a query queue, and then processed in turn. When the pending request in the queue exceeds the processing power of the system itself, it will reach Cassandra's performance bottleneck, so that the query time is maintained in a relatively stable state, so in practical applications need to determine the number of concurrent threads according to hardware conditions.
3.2 Geographic data spatial location visualization example
This paper takes Weifang City as a research area to show a visual example of the spatial location of geographic data in Weifang City's 2016-2017 rainfall distribution. First, the rainfall information is captured in real time. Due to the uneven distribution of the sample information captured, the effect is not very satisfactory, and the rainfall distribution in the area cannot be visually reflected. Therefore, the inverse distance weight interpolation analysis of the sample data is needed. The inverse distance weighting algorithm was proposed by Shepard in 1968, and Watson et al. applied it to contour plotting of spatial interpolation in 1985 (SHEPARD,1968; WATSON,1985). The principle is easy to understand, the algorithm is simple and easy to implement, and is often used as one of the traditional methods of spatial analysis of discrete points. The algorithm is publicly represented as:
(1) Type: Z is the interpolation point estimates; Zi is the
observation of the i sample; diis the Euclidean distance
between the interpolation point and the i sample point; n is the number of samples for estimating the interpolation point value; p is the power exponent.
Then the user sends the service request through Ajax to obtain the Geojson information value after the interpolation analysis, and parses out a series of parameters that the available information is organized into Echarts to generate the heatmap interface, and visually displays it.
Figure 7. Special exhibition of spatial location in Weifang city
3.3 Visual examples of geographic data over time
Firstly, the population data of Weifang city is entered into the Cassandra distributed database, and the corresponding population data of year is quickly and efficiently queried according to the data of different years. The Echarts class library provides the time axis to control the change of year. It needs to add the timeline parameter in the option parameter. How to dynamically create the timeline record number, you need to trigger the timelinechanged function to display the number of the year and month isometric tags according to the requirements. Different time changes, the data of different years in the Cassandra database is quickly queried through the interface, and the Geojson format is returned.
Then the user extracts useful information, and combines the results of the analysis with the map according to the Echarts visual class library mentioned above, and combines the results of the analysis with the map to vividly display the changes in the population of Weifang in recent years.
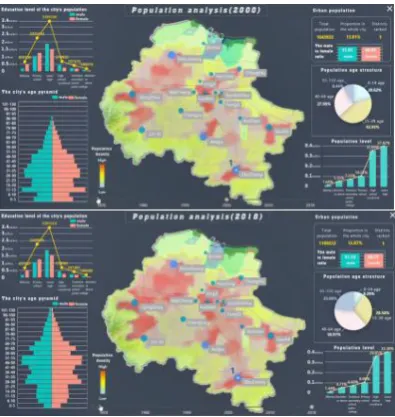
Figure 8 shows the result of mining and analyzing the population data of more than 8 million people across 6 years in Weifang city. From the population pyramid on the left, you can visually understand the age structure and gender ratio of the population. It can be seen that the city has a population of 46-50 years old, and the situation of aging will gradually increase in the future; Timeline to understand the dynamics of population in all ages. Through the visual representation of the population data in time, it can provide value information for the human resources allocation and the deployment of the old-age institutions in all districts and counties.
Figure 8. Time thematic display in Weifang city
4. Conclusion
According to the characteristics of geographic data, this paper selects Echarts as the geographic data visualization class library, analyzes the source code of the class library, studies its internal implementation mechanism, and designs the architecture based on B/S mode. It divides it into presentation layer and control by MVC. Layer, business logic layer, data access layer, data layer five layers. Then combined with the newly developed NewMap API interface, the interface for visualizing the thematic map is designed, and the geographic data after mining and analysis is expressed on the map. This kind of dynamic presentation of large amounts of data on the map not only helps users to grasp the development rules and trends of data more accurately, but also has strong commercial and scientific value, and also provides for cloud computing and data mining that are prevailing nowadays. Strong support.
5. References
He Xueying. (2017). Design and implementation of
exploratory data visualization analysis
system,Southwest Jiao Tong University,2017. Ma Wangcheng,Yuan Tiejiang,Zhang Heng,etc.
(2017). Implementation of simulation software for active power output of wind farms based on VC++ and SQL Server database.Computer science, 2017, 44(b11):534-537.
Zhao Zuoxi, Li Jiaojiao, Huang Peikui, etc. (2017). Bug vehicle obstacle avoidance algorithm Matlab simulation visualization platform:CN 104020674 B. 2017.
Zhang Fuding, Guo Yunjun, Ding Ji. (2018). Research on Matlab Visual Virtual Simulation in the Teaching Practice of Communication Principles.Journal of the Hubei Normal University(Natural Science Edition), 2018(2).
Mining Visualization Technology Based on FLEX.China Petroleum University(Beijing), 2012. Zhang Xiaoxiao, Guo Shaoyong. (2017). Design and
Implementation of Map Markers in Web GIS. Fujian Computer, 2017, 33(9):141-142.
Xue Lifang, Tang Haihua, Ding Yuheng, etc. (2016). Design and implementation of Typhoon Information System for power grid based on FLEX and WebGIS
technology.Automation of hydropower plant,
2016(4):45-49.
Gong Jingmin, Huang Yu, Li Chengming.
(2016).Based on NewMap online thematic map, geographic information world 2016,6.
Cai R C, Lin Y X, Peng A I. SBV:(2017). A Bioinformatics Visualization Software Based on SVG. Computer Science, 2017.
Xiong Li. (2017). Multi angle visualization analysis and research of power big data based on cloud platform [D], North China Electric Power University 2017,3,1.
Song Jiahui, Liu Yuangang, Lin Lin, Li Shenhong, Xu Fan. (2017). Research on Dynamic Statistical Charts Drawing Technology, Computer Engineering Applications,2017,4(12)202-204.
Highsoft Company. Highlights
Profile[EB/OL].https://www.hcharts.cn/.
BaiDu Company.Echarts
Profile[EB/OL].http://echarts.baidu.com/.
Dias L B, Holanda M, Huacarpuma R C, et al. (2018). NoSQL Database Performance Tuning for IoT Data - Cassandra Case Study// International Conference on Internet of Things, Big Data and Security. 2018:277-284.
Wang Boqian, Yu Qi, Liu Xin, etc. (2016).Efficient Dynamic Data Management Mechanism for Cassandra Database.Computer Science, 2016, 43(7):197-202.
Huang Maosen. (2018). Data consistency measurement technology for key value storage.Nanjing University, 2018.
SHEPARD D. A Two-dimensional Interpolation Function for Irregularly-Spaced Data // Proceedings of the 1986 ACM National Conference.New York:ACM Press,1968:517-524
WATSON D F,PHILIP G M.A Refinement of Inverse
Distance Weighted