Extraction and Quantification of Anthocyanin from Banana
Bracts Using Different pH and Solvent Concentration
T.A. Ove
1, *M.M. Kamal
2, S.M.N.I. Nasim
3, M.M.I Momin
4, S.C. Mondal
51,2,3,4,5Department of Food Processing and Preservation, Faculty of Engineering, Hajee Mohammad Danesh Science and
Technology University, Dinajpur-5200, Bangladesh
Banana (Musa balbisiana) bracts were investigated as a potential source of natural colorant. In this study, the total anthocyanin from selected banana bracts was extracted with ethanol solutions and characterized by UV-visible spectrophotometry and their content was found 224.41 ± 1.91 mg/kg, which was highest at 40% solvent concentration with pH 4. Moreover, the color characteristics were varied with the variation of solvent concentration and pH. Similarly, the values of chroma and hue angle were also investigated and the value of chroma was higher at pH 4 in all different concentrations. The results revealed that the color of anthocyanin was decreased due to increase of pH. The value of hue angle was in the range of (73.69±0.33) to (-71.14±1.39), which indicated the color from yellow to magenta, and this is the natural color of anthocyanin. Therefore, banana bracts can be used as a potential source of extracting natural colorant instead of synthetic dyes in different food industries.
Keywords: Banana bracts, Anthocyanin, Extraction,Quantification, Solvent Concentration, pH
INTRODUCTION
Nowadays the use of natural colorants replaces the use of synthetic dyes due to safety issues. According to the numbering system used by the Codex Alimentarius Commission, anthocyanins (any anthocyanin-derived colorant) are listed as a natural colorant by the European Union (EU) legislation as product E163 (Markakis, 1982). By-products of some industrial processing can be the best putative commercial sources of anthocyanins such as grape skin extracts (Jackman and Smith 1996). For that reason, more attention has been paid to other potential anthocyanin-rich waste by-products, i.e. banana bracts (Pazmino-Duran et al., 2001).
Various types of extraction methods have been employed to extract anthocyanin content, among them two main methods that have been used frequently are reflux system (Sharifi and Hassani, 2012) and two-phase aqueous system (Hua et al., 2013). Different solvents had been used during extraction such as acidified water, acidified methanol, ethanol, acetone and acid such as hydrochloric acid (HCL) (Chandrasekhar et al., 2012). During the extraction of anthocyanins, aqueous acidified methanol and ethanol have been most commonly used (Fan et al., 2008; Bridgers et al., 2010; Chandrasekhar et al., 2012;
Truong et al., 2012; Kang et al., 2013; Puertolas et al., 2013).
Researchers found that the degree of extraction of anthocyanin was the highest in the case of acetone followed by acidified methanol and acidified ethanol (Chandrasekhar et al., 2012). However, scientists also found that the use of acetone and methanol in the food industry is not preferable because of their possible toxicity (Spagna et al., 2003; Patil et al., 2009). Ethanol is the most acceptable one for use in food industry (Patil et al., 2009; Bridgers et al., 2010; Truong et al., 2010; Lu et al., 2011; Chandrasekhar et al., 2012; Truong et al., 2012; Burgos et al., 2013; Kang et al., 2013).
*Corresponding Author: M.M. Kamal, Department of Food Processing and Preservation, Faculty of Engineering, Hajee Mohammad Danesh Science and Technology University, Dinajpur-5200, Bangladesh. E-mail: [email protected]
Co-Authors Email: 1[email protected] 3[email protected]; 4[email protected] 5[email protected]
Research Article
Hence, ethanol can be considered as a potential one for application of food. In order to extract hydrophilic anthocyanins, scientists suggested that pure ethanol should not be used. According to Patil et al. (2009) little amount of water can be added with ethanol for extraction. Moreover, various factors influence the stability of anthocyanin pigments such as pH value, temperature, the presence of oxygen, enzymes, metal ions and so on (Andersen et al., 2008). Researchers also found that stability and color intensity was better at low pH values. So, the protocol performed at high acidity, anthocyanin gradually loses the color. However, this color loss is reversible and the red hue will return to acidification (Zhao
et al., 2004; Borkowski et al., 2005).
The pH has a significant impact on the anthocyanin molecules. In acidic media, at low pH values, anthocyanins are being more stable than the alkaline solution with high pH values (Rein, 2005). In acidic aqueous solution, anthocyanins exist as four main equilibrium species: the quinoidal base (QB), the flavylium cation (FC), the carbinol or pseudobase (PB) and the chalcone (CH) (Wilska-Jeszka, 2007; Bobbio and Mercadante, 2008). pH below 2, anthocyanins exist basically in flavylium cation in red or purple. The quinoidal blue species are predominant by increasing pH up to 4. Due to hydration of flavylium cation colorless species carbinol or pseudobase and yellowish chalcone exist at pH between 5 and 6 (Kahkonen and Heinonen, 2003; Castaneda-Ovando et al., 2009).
In Bangladesh, banana bracts are usually thrown away as a waste during the harvesting season. Recently, anthocyanin pigments in banana bracts are found considering a potential food colorant. As the banana bracts are widely available and have been used as food, they could be a potential source of anthocyanins (Pazmino-Duran et al., 2001). Thus, the objectives of this research were to extract the total anthocyanin from banana bracts and to evaluate the effects of various extraction conditions such as pH and solvent concentrations.
MATERIALS AND METHODS
Sample Collection
Banana bracts were collected from the local market in Dinajpur and some were collected from local banana orchard.
Apparatus for Extraction
pH meter, Visible spectrophotometer and Whatman filter paper (no.1).
Chemicals and Reagents
Ethanol, Hydrochloric Acid (HCl), Sodium Hydroxide (NaOH) and Distilled water.
Sample Preparation
Banana bracts were washed with tap water to remove adherences, dirt and other surface impurities properly. Then they were cut into small or desired pieces manually.
Solvent Preparation
The Solvents were prepared into 30%, 40% and 50% concentration of ethanol with the addition of distilled water in different 1000 ml beaker respectively. The pH of the solvent solutions were maintained at 4, 5 and 6 for each concentrations with the help of hydrochloric acid and sodium hydroxide.
Extraction of Anthocyanin
The extraction was done by mixing 50 g of banana bracts in pieces into 500 ml of ethanol at different concentrations (30, 40 and 50%). The extraction process was carried out in water bath at 50°C for 60 minutes. (Ninh et al., 2015 and Simona et al., 2012). Each mixture was filtered through a muslin cloth to remove coarse particles. Then vacuum filtration with whatman filter paper (no.1) was performed to remove other dissolved minute particles. Finally, the filtrated extracts were used for the determination of total anthocyanin content.
Determination of Anthocyanin Content
On the basis of extractability results, a simple, rapid method for determining the total anthocyanin content was established (Abdel et al., 1999). The filtrated banana bract solution was taken for determining the absorbance at 530 nm using a spectrophotometer. The anthocyanin content was calculated as cyanidin-3-glucoside on the basis of the following equation:
Anthocyanin Content (mg / kg) = A V MW 10 ...(1)6 W 1000
Where, A= Absorbance, MW= Molecular weight of cyanidin-3-glucoside (C12H21ClO11, 449.2), V= Volume of
solvent, ɛ= Molar absorptivity (25965 cm-1 M-1), W=
Sample weight
Determination of Anthocyanin Color Intensity
The instrumental color property measurement of anthocyanin extracts were carried out with a colorimeter Minolta CM-2500d (Konica Minolta optics, Inc. Japan). Color attributes were recorded as L (Lightness), a (Redness) and b (yellowness). Chroma and Hue angle of the specimens were evaluated using the following formula.
Chroma = a2+b ...(2)2
Hue = tan 1a...(3) b
Statistical Analysis
All collected data’s were statistically analyzed by using IBM SPSS (version 20) to obtain the mean values with standard deviations.
RESULTS AND DISCUSSION
Anthocyanin Content
The total anthocyanin content of banana bracts ethanolic extracts is given in table 1. In agreement with Patil et al.
(2009) pure ethanol should not be used for extraction of anthocyanin, based on this little amount of water was used to extract the hydrophilic anthocyanins. The anthocyanin content was found more appreciable at 40% solvent concentration and it was gradually decreased with increasing the solvent concentration. However, it showed that at 30% solvent concentration the anthocyanin extraction was lower than that of other concentrations. The decreasing rate of anthocyanin extraction above 40% (v/v) ethanol concentration could be due to the non-extraction of hydrophilic anthocyanins as the concentration of water in the extraction media decreased with increased ethanol content. Similarly, like solvent concentration the amount of total anthocyanin contents was the highest at pH 4 among three different solvent concentrations.
As it can be seen in table 1, total anthocyanin content was significant (224.41±1.91 mg/kg) at 40% solvent concentration with pH 4. This anthocyanin content was closer to what was reported by Timberlake (1988) for red cabbage (250 mg/kg), already commercially available as a food color extract. This obtained result is higher than the findings of Roobha et al., (2011) which was extracted from
Musa acuminata bract and slightly lower from the optimized results of Begum and Deka (2017) for spray-dried microencapsulated anthocyanins extracted from culinary banana bracts i.e. (56.98 mg/100g). Mathematically each banana plant contains about (≈) 600 g of colored bracts and per hectare produces around 1500 plants (Pazmino-Duran et al., 2001). Consequently,1500 plants contain (600 g × 1500) 900,000 g colored bracts. In line with our research from 900,000 g colored bracts would be yielded (224.41 mg/kg × 900,000 g) 202 g of anthocyanin per hectare. For that reason, it could be commercially feasible to produce pigment from this source.
Color Attributes of Anthocyanin Extract from Banana Bracts
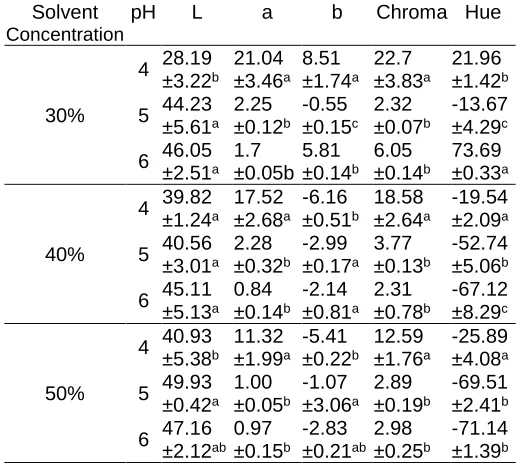
Quantitative color measurement of colorimeter Minolta CM-2500d (Konica Minolta optics, Inc. Japan) L, a and b are commonly used to measure the color component from the colored solution of banana bracts. The value of L, a, b, Chroma and Hue values of anthocyanin extracts from colored solution of banana bracts at various condition are shown in table 2.
Color Attributes at 30% Solvent Concentration
The characteristics of L, a, b, Chroma and Hue for 30% solvent concentration at various pH (4, 5 and 6) were shown in table 2. It was found that the value of L, which indicates the lightness was increased to increasing pH and the value of a, which indicates the redness (+) or greenness (-) was decreased that means the redness was turned to greenness with increasing pH. Similarly, the value of b, which indicates yellowness (+) or blueness (-) decreasing at increasing pH. Chroma which increased at lower pH means that the colorfulness of anthocyanin was brighter than elevated pH. Whether the hue angle at pH 4, 5 and 6 were (21.96±1.42), (-13.67±4.29) and (73.69±0.33) respectively. This situation means that at pH 4 and 5 the hue angle remained from yellow to crimson that indicates the natural color of anthocyanin but at pH 6 color turned into greenish-yellow. At elevated pH values anthocyanins will provide color fading of colorless, yellow, purple and blue (Wahyuningsih et al., 2016).
Color Attributes at 40% Solvent Concentration
At 40% solvent concentration the value of L, was increased to increasing pH and the value of a, which indicates the redness (+) or greenness (-) was decreased which means the redness was turned to greenness with increasing pH. Similarly, the value of b, which indicates yellowness (+) or blueness (-) decreasing at increasing pH.
Colorfulness of anthocyanin was brighter at lower pH than elevated pH as the values of chroma gradually decreased at higher pH. At pH 4, 5 and 6 the values of hue angle were (-19.54±2.09), (-52.74±5.06) and (-67.12±8.29) respectively. The hue angle remained in the range of fully red color at pH 4 and at pH 5, at pH 6 the hue angle remained from red to magenta that indicates the natural color of anthocyanin. Lower hue angle indicates more red color of anthocyanins. This means at higher pH values the color of anthocyanin gradually decreased (Ibrahim et al., 2011). In brief, lower hue angle indicated the total anthocyanin content can be higher at lower pH.
Color Attributes at 50% Solvent Concentration
The value of L, which indicates the lightness was increased to increasing pH and the value a, of which indicates the redness (+) or greenness (-) was decreased that means the redness was turned to greenness with increasing pH. Similarly, the value of b, which indicates yellowness (+) or blueness (-) decreasing at increasing pH.
changes its color content at elevated pH. Higher pH is associated with the development of anthocyanin degradation (Ibrahim et al., 2011). This color change is reversible and the red hue will return to acidification (Zhao
et al., 2004; Borkowski et al., 2005).
Table 1: Total anthocyanin content at various solvent concentration and pH
Solvent
Concentration pH Anthocyanin (mg/kg)
C30%
4 122.96 ± 0.31a
5 8.35 ± 0.56b
6 6.84 ±0.31c
A40%
4 224.41±1.91a
5 20.06±0.35b
6 17.84±0.35b
B50%
4 192.93±0.60a
5 19.53±0.18b
6 18.22±1.76b
All values are means ±SD of three replicates.
a-cThe test values along the same column carrying
different superscripts are significantly different (p< 0.05).
A-CThe concentration are significantly different (p<
0.05).
Table 2: Color parameters of extracted anthocyanin from banana bracts
Solvent Concentration
pH L a b Chroma Hue
4 28.19 ±3.22b 21.04 ±3.46a 8.51 ±1.74a 22.7 ±3.83a 21.96 ±1.42b
30% 5 44.23
±5.61a 2.25 ±0.12b -0.55 ±0.15c 2.32 ±0.07b -13.67 ±4.29c
6 46.05 ±2.51a 1.7 ±0.05b 5.81 ±0.14b 6.05 ±0.14b 73.69 ±0.33a
4 39.82 ±1.24a 17.52 ±2.68a -6.16 ±0.51b 18.58 ±2.64a -19.54 ±2.09a
40% 5 40.56
±3.01a 2.28 ±0.32b -2.99 ±0.17a 3.77 ±0.13b -52.74 ±5.06b
6 45.11 ±5.13a 0.84 ±0.14b -2.14 ±0.81a 2.31 ±0.78b -67.12 ±8.29c
4 40.93 ±5.38b 11.32 ±1.99a -5.41 ±0.22b 12.59 ±1.76a -25.89 ±4.08a
50% 5 49.93
±0.42a 1.00 ±0.05b -1.07 ±3.06a 2.89 ±0.19b -69.51 ±2.41b
6 47.16 ±2.12ab 0.97 ±0.15b -2.83 ±0.21ab 2.98 ±0.25b -71.14 ±1.39b
All values are means ±SD of three replicates.
a-cThe test values along the same column carrying
different superscripts are significantly different (p< 0.05).
CONCLUSION
In this research work, anthocyanin was extracted from banana bracts considering two parameters (pH and solvent concentration) with intra variations. Highly colored
anthocyanins were found at low pH value but it gradually loses its color during increase in pH values. Extraction rate was higher at pH 4 in 40% solvent concentration. Hence, it can be concluded that this study would help people like to extract anthocyanin from banana bracts as a source of natural colorants for their food industries to avoid the carcinogenic effect of synthetic colorants.
ACKNOWLEDGEMENT
The authors are thankful to Teachers and Agro-chemistry lab technician for helping to complete the work.
REFERENCES
Abdel AESM and Pierre H. (1999). A rapid method for quantifying total anthocyanin in blue aleurone and purple pericarp wheats. Cereal chemistry 76: 350-354. Andersen Ø M, and Jordheim, M. (2006). The Anthocyanins. In flavonoids and chemistry, biochemistry and applications, CRC Press: Boca Raton, pp. 471–553.
Begum YA and Deka SC. (2017). Stability of spray-dried microencapsulated anthocyanins extracted from culinary banana bract. International Journal of Food Properties 20(12): 3135–3148.
Bobbio FO, Mercadante AZ. (2008). Anthocyanins in foods: occurrence and physicochemical properties. In: Food Colorants: Chemical and Functional Properties. CRC, Vol. 1, pp. 36, pp.241-276, 2008.
Borkowski T, Szymusiak H, Gliszczynska RA, Rietjens IM and Tyrakowska B. (2005). Redical scavenging capacity of wine anthocyanin is strongly pH dependent. Journal of Agricultural and Food Chemistry 53:526-534. Bridgers EN, Chinn MS and Truong VD. (2010). Extraction of anthocyanins from industrial purple-fleshed sweet potatoes and enzymatic hydrolysis of residues for fermentable sugars. Industrial Crops and Products, 32: 613-620.
Burgos G, Amoros W, Munoa L, Sosa P, Cayhualla E, Sanchez C, Diaz C and Bonierbale M. (2013). Total phenolic, total anthocyanin and phenolic acid concentrations and antioxidant activity of purple-fleshed potatoes as affected by boiling. Journal of Food Composition and Analysis 30: 6-12.
Castaneda-Ovando A, Pacheco-Hernandez MDL, Paez-Hernandez ME, Rodriguez JA and Galan-Vidal CA. (2009). Chemical studies of anthocyanins: A review. Food Chemistry, 113: 859-871.
Chandrasekhar J, Madhusudhun MC and Raghavaro KSMS. (2012). Extraction of anthocyanins from red cabbage and purification using adsorption. Food and Bio products Processing 90: 615-623.
Hua Z, Yuesheng D, Ge X, Menglu L, liya D, Lijia A and Zhilomg X. (2013). Extraction and Purification of Anthocyanin from the Fruit Residues of Vaccinium uliginosum linn. Journal of Chromatography Separation Techniques 4:2.
Ibrahim UK, Muhammad II and Salleh RM. (2011). The Effect of pH on Color Behavior of Brassica oleracea
Anthocyanin. Journal of Applied Sciences 11: 2406-2410.
Jackman RL and Smith JL. (1996). Anthocyanins and betalains. In G. A. F. Hendry and J. D. Houghton (Eds.), Natural Food Colorants, Blackie Academic of Professional, pp. 245–309.
Kahkonen MP and Heinonen M. (2003). Antioxidant activity of anthocyanins and their aglycons. Journal of agricultural and food chemistry, 51: 628-633.
Kang YJ, Jung SW and Lee SJ. (2013). An optimal extraction solvent and purification adsorbent to produce anthocyanins from black rice (Oryza sativa cv. Heugjinjubyeo). Food Science and Biotechnology 23: 97-106.
Lu Y, Li JY, Luo J, Li ML. and Liu ZH. (2011). Preparative Separation of Anthocyanins from Purple Sweet
Potatoes by High-Speed Counter-Current
Chromatography. Chinese Journal of Analytical Chemistry, 39, 851-856.
Markakis P. (1982). Stability of anthocyanins in foods. In Markakis, P. (Ed.). Anthocyanins asFood Colors, pp.163-178. Academic Press Inc NewYork.
Ninh LtT, Dao TKT, Le PT, Than TUX, Dam SM and Nguyen TNT. (2015). Effect of Ethanol on the Anthocyanin Extraction from the Purple Rice of Vietnam. Journal of Food and Nutrition Sciences. Special Issue: Food Processing and Food Quality. Vol. 3, No. 1-2, 2015, pp. 45-48.
Patil G, Madhusudhun MC, Ravindra Babu B and Raghavaro KSMS. (2009). Extraction, dealcoholization and concentration of anthocyanin from red radish. Chemical Engineering and Processing: Process Intensification 48: 364-369.
Pazmino-Duran EA, Giusti MM, Wrolstad RE and Gloria MBA. (2001). Anthocyanins from banana bracts (Musa X paradisiaca) as potential food colorants. Food Chem 73: 327–332.
Puertolas E, Cregenzan O, Luengo E, Alvarez I and Raso J. (2013). Pulsed-electric-field-assisted extraction of anthocyanins from purple-fleshed potato. Food Chemistry 136: 1330-6.
Rein M. (2005). Co-pigmentation reactions and color stability of berry anthocyanins. Helsinki: University of Helsinki. pp. 10–14.
Roobha JJ, Saravanakumar M, Aravinthan KM and Suganya PD. (2011). Antioxidant analysis of anthocyanin extracted from Musa acuminata bract. Journal of Pharmacy Research 4(5): 1488-1492. Sharifi A and Hassani B (2012). Extraction methods and
stability of color extracted from barberry pigments.
International Journal of Agricultural Science 2(4):320 327.
Simona O, Stoiab M and Coman D. (2012). Effects of Extraction Conditions on Bioactive Anthocyanin Content of Vaccinium Corymbosum in the Perspective of Food Applications. Procedia Engineering 42: 489-495
Spagna G, Barbagallo RN, Todaro A, Durante MJ and Pifferi PG. (2003). A method for anthocyanin extraction from fresh grape skin. Italian Journal of Food Science 3(15): 337-346.
Timberlake CF and Henry BS. (1988). Anthocyanins as natural food colorants. Prog. Clin. Biol. Res 280: 107-121
Truong VD, Deighton N, Thompson RT, Mcfeeters RF, Dean LO, Pecota KV and Yencho GC. (2010). Characterization of anthocyanins and anthocyanidins in purple-fleshed sweet potatoes by HPLC-DAD/ESI-MS/MS. Journal of Agricultural and Food Chemistry 58: 404-10.
Truong VD, Hu Z, Thompson RL, Yencho GC and Pecota KV. (2012). Pressurized liquid extraction and quantification of anthocyanins in purple-fleshed sweet potato genotypes. Journal of Food Composition and Analysis, 26: 96-103.
Wahyuningsih S, Wulandari L, Wartono MW, Munawaroh H and Ramelan AH. (2016). The Effect of pH and Color Stability of Anthocyanin on Food Colorant, IOP conference series: material science and engineering 193.
Wilska-Jeszka J. (2007). Food Colorants, in: Sikorski, Z.E. (Ed.), Chemical and Functional Properties of Food Components. CRC Press, Taylor & Francis Group, Boca Raton.
Zhao C, Giusti MM, Malik M, Moyer MP and Magnuson BA. (2004). Effects of commercial anthocyanin-rich extracts on colonic cancer and non-tumorigenic colonic cell growth. Journal of Agricultural and Food Chemistry 52: 6122-6128.
Accepted 11 April 2019
Citation: Ove TA, Kamal MM, Nasim SMNI, Momin MMI, Mondal SC (2019). Extraction and Quantification of Anthocyanin from Banana Bracts Using Different pH and Solvent Concentration. International Journal of Food and Nutrition Sciences. 4(2): 060-064.