IJSRSET11841113 | Received : 14 Nov 2018 | Accepted : 26 Nov 2018 | November-December-2018 [ 4 (11) : 69-77 ]
Themed Section : Science and Technology DOI : https://doi.org/10.32628/IJSRSET11841113
Development of Validated UV Spectrophotometric Method for
Assay of Ozagrel and its Pharmaceutical Formulations
Vishal N Kushare1, Sachin S Kushare2, Sagar V Ghotekar3
1 Professor, Department of Pharmaceutics,N.D.M.V.P.S’s Institute of Pharmaceutical Science,,Adgaon
Nashik, Maharashtra, India
2 Department of Chemistry, Research Center, HPT arts RYK Science College, Nashik, Maharashtra, India 3 Department of Pharmaceutics, SSDJ College of Pharmacy Chandwad,Nashik, Maharashtra, India
ABSTRACT
UV Spectrophotometric method was developed and validated for the quantitative determination of Ozagrel in bulk drug and in pharmaceutical formulations. Ozagrel shows the maximum absorbance at 270 nm. Ozagrel follows Beer’s law in the concentration range of 1.0-10.0 µg/ml (r = 0.999). The detection limit (DL) and quantitation limit (QL) were 0.4629 and 1.4027 µg/ml respectively. Accuracy and precision were found to be satisfactory. The developed methods were validated according to ICH guidelines. All the validation parameters were found to be satisfactory accordance with the standard values. Therefore, the proposed method can be used for routine practice for the determination of Ozagrel in assay of bulk drug and pharmaceutical formulations. Keywords : Ozagrel, Validation, UV-Spectrophometry.
I. INTRODUCTION
Ozagrel (Ozagrel Sodium), the thromboxane A2 (TXA2) synthase inhibitor is an kind of intravenous antiplatelet agent. It can increase 6-keto-PGF1 alpha in various isolated cells and tissues perhaps via accumulated PG endoperoxides resulted by the inhibition of TXA2 synthase. Ozagrel was firstly introduced to the market in Japan in 1992, which was used to reduce airway hyperresponsiveness to acetylcholine and leukotriene D4. Ozagrel was also found to help to expend the blood vessels, and inhibit the spasms of cerebral artery despite the function of inhibiting the accumulation of platelet activation in the clinical practice. Moreover, intravenously administered antiplatelet agents offer the prospect of a much more rapid onset of antiplatelet effect. For these reasons, ozagrel was used to prevent cerebral vasospasm induced by the subarachnoid hemorrhage
(SAH), and to improve the cerebral circulation after acute ischemic stroke.
For its potential role, ozagrel has been widely used in acute ischemic stroke, especially in China and Japan. There were some non-large-sampled clinical trials of ozagrel in the last 15 years, however, these clinical
trials didn’t provide the conclusive evidence of
efficacy of ozagrel for AIS, meanwhile, no systematic review has been done about ozagrel for AIS till now.
Therefore, ozagrel’s efficacy and safety should be
strictly assessed before it is recommended for routine use in patients with acute ischemic stroke. In a word, the aim of this review is to systematically evaluate all the relevant RCTs of ozagrel for acute ischemic stroke, in order to provide the latest and better available evidence for clinical practice and further research planning for acute ischemic stroke.
II. EXPERIMENTAL WORK
❖ Standard solutions
• Solution A (Stock standard solution)
Accurately weighed quantity of Ozagrel (10.0 mg) was dissolved in 10.0 ml of water. (conc.: 1.0 mg/ml).
• Solution B (Working standard solution) Accurately measured 1.0 ml of solution A was diluted to 100.0 ml with water (conc.: 10.0 g/ml).
❖ Selection of λmax
Working standard solution was scanned in the UV range (200-400 nm) in 1.0 cm quartz cell against solvent blank to obtain the spectrum of the drug. Ozagrel showed well-defined λmax at 270.0 nm and
this wavelength was selected for further study.
Figure 1. UV Spectra of Ozagrel at 270.0 nm
❖ Study of Beer-Lambert’s Law
The working standard solution of Ozagrel was diluted with distilled water to get series of concentration ranging from 1.0-10.0 µg/ml. Absorbance of these solutions were measured at 270.0 nm in 1.0 cm cell using solvent blank. A plot of absorbance vs. concentration was found to be linear.
Sr.
No. Parameters
Ozagrel (at 270.0 nm)
1.
Linearity dynamic range
1-10 µg/ml
2. Regression
equation Y= 0.124901X 2. Slope 0.1249
4.
Correlation coefficient (r)
0.999
Figure 2: Study of Beer-Lambert’s Law at 270.0
nm
❖ Determination of Absorptivity Values at Selected Wavelength
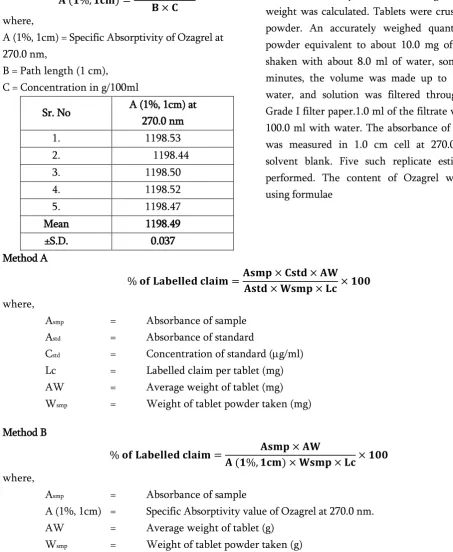
Five standard solutions of Ozagrel 10.0 μg/ml were prepared and the absorbance of each resulting solutions were measured at 270.0 nm in 1.0 cm cell using solvent blank. The A (1%, 1cm) values were calculated using the relation.
𝐀 (𝟏%, 𝟏𝐜𝐦) =𝐀𝐛𝐬𝐨𝐫𝐛𝐚𝐧𝐜𝐞 𝐁 × 𝐂
where,
A (1%, 1cm) = Specific Absorptivity of Ozagrel at 270.0 nm,
B = Path length (1 cm), C = Concentration in g/100ml
Sr. No A (1%, 1cm) at 270.0 nm 1. 1198.53 2. 1198.44 3. 1198.50 4. 1198.52 5. 1198.47 Mean 1198.49 ±S.D. 0.037
% RSD 0.003
Table 2 : Absorptivity Value of Ozagrel at 270.0 nm
❖ Estimation of Ozagrel in Tablet Formulation
• Standard Solution: Working standard solution was prepared (10.0 g/ml) as described under preparation of standard solution.
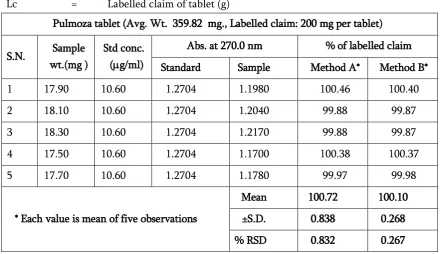
Procedure: Twenty tablets were weighed and average weight was calculated. Tablets were crushed to a fine powder. An accurately weighed quantity of tablet powder equivalent to about 10.0 mg of Ozagrel was shaken with about 8.0 ml of water, sonicated for 15 minutes, the volume was made up to 10.0 ml with water, and solution was filtered through Whatman Grade I filter paper.1.0 ml of the filtrate was diluted to 100.0 ml with water. The absorbance of final solution was measured in 1.0 cm cell at 270.0 nm against solvent blank. Five such replicate estimation were performed. The content of Ozagrel was calculated using formulae
Method A
% 𝐨𝐟 𝐋𝐚𝐛𝐞𝐥𝐥𝐞𝐝 𝐜𝐥𝐚𝐢𝐦 =𝐀𝐬𝐦𝐩 × 𝐂𝐬𝐭𝐝 × 𝐀𝐖 𝐀𝐬𝐭𝐝 × 𝐖𝐬𝐦𝐩 × 𝐋𝐜× 𝟏𝟎𝟎
where,
Asmp = Absorbance of sample
Astd = Absorbance of standard
Cstd = Concentration of standard (g/ml)
Lc = Labelled claim per tablet (mg) AW = Average weight of tablet (mg) Wsmp = Weight of tablet powder taken (mg)
Method B
% 𝐨𝐟 𝐋𝐚𝐛𝐞𝐥𝐥𝐞𝐝 𝐜𝐥𝐚𝐢𝐦 = 𝐀𝐬𝐦𝐩 × 𝐀𝐖
𝐀 (𝟏%, 𝟏𝐜𝐦) × 𝐖𝐬𝐦𝐩 × 𝐋𝐜× 𝟏𝟎𝟎
where,
Asmp = Absorbance of sample
A (1%, 1cm) = Specific Absorptivity value of Ozagrel at 270.0 nm. AW = Average weight of tablet (g)
Lc = Labelled claim of tablet (g)
Pulmoza tablet (Avg. Wt. 359.82 mg., Labelled claim: 200 mg per tablet)
S.N. Sample wt.(mg )
Std conc. (g/ml)
Abs. at 270.0 nm % of labelled claim Standard Sample Method A* Method B* 1 17.90 10.60 1.2704 1.1980 100.46 100.40 2 18.10 10.60 1.2704 1.2040 99.88 99.87 3 18.30 10.60 1.2704 1.2170 99.88 99.87 4 17.50 10.60 1.2704 1.1700 100.38 100.37 5 17.70 10.60 1.2704 1.1780 99.97 99.98
* Each value is mean of five observations
Mean 100.72 100.10 ±S.D. 0.838 0.268 % RSD 0.832 0.267 Table 3 : Results of Estimation of Ozagrel in Tablets
VALIDATION
Validation of proposed method was ascertained on the basis of accuracy, precision, linearity & range, limit of detection, limit of quantitation, specificity, ruggedness and robustness.
❖ Accuracy: Accuracy of the proposed method was ascertained on the basis of recovery studies carried out by standard addition method.
• Standard Solution: Working standard solution was prepared (10.0 g/ml) as described under preparation of standard solution.
• Procedure: Accurately weighed quantities of pre-analyzed tablet powder equivalent to about 7.0 mg of Ozagrel were transferred to five different 10.0 ml volumetric flasks and 1.5 mg, 3.0 mg, 4.5 mg and 6.0 mg of standard Ozagrel were added to 2nd, 3rd, 4th & 5th flask respectively (representing 70- 130% of
labelled claim). This was followed by addition of water to make volume to about 8.0 ml in each flask, then contents were shaken and sonicated for 15 minutes. Sufficient water was added to each flask to adjust the volume to 10.0 ml mark and filtered. 1.0 ml of each of the filtrate was diluted to 100.0 ml with water, absorbances of sample solution so obtained and the standard solution were measured at 270.0 nm. The total amount of drugs were calculated by using the formulae-
Method A
𝐀 =𝐀𝐬𝐦𝐩 × 𝐂𝐬𝐭𝐝 𝐀𝐬𝐭𝐝
where,
A = Total drug estimated (mg) Asmp = Absorbance of sample
Astd = Absorbance of standard
Method B
𝐀 =𝐀𝐬𝐦𝐩 × 𝟏𝟎, 𝟎𝟎𝟎 𝐀(𝟏%, 𝟏𝐜𝐦)
where,
A = Total drug estimated (mg) Asmp = Absorbance of sample
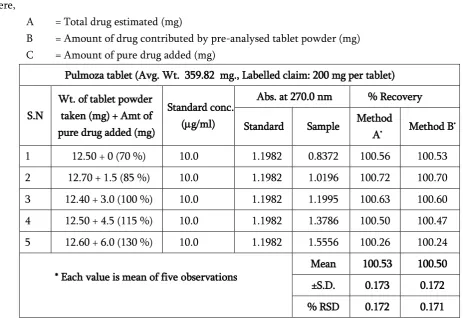
A (1%, 1cm) = Specific Absorptivity value of Ozagrel at 270.0 nm. The percent recovery was then calculated by using formula:
100 B -A Recovery %
C
=
where,
A = Total drug estimated (mg)
B = Amount of drug contributed by pre-analysed tablet powder (mg) C = Amount of pure drug added (mg)
Pulmoza tablet (Avg. Wt. 359.82 mg., Labelled claim: 200 mg per tablet)
S.N
Wt. of tablet powder taken (mg) + Amt of pure drug added (mg)
Standard conc. (g/ml)
Abs. at 270.0 nm % Recovery
Standard Sample Method
A* Method B *
1 12.50 + 0 (70 %) 10.0 1.1982 0.8372 100.56 100.53 2 12.70 + 1.5 (85 %) 10.0 1.1982 1.0196 100.72 100.70 3 12.40 + 3.0 (100 %) 10.0 1.1982 1.1995 100.63 100.60 4 12.50 + 4.5 (115 %) 10.0 1.1982 1.3786 100.50 100.47 5 12.60 + 6.0 (130 %) 10.0 1.1982 1.5556 100.26 100.24
* Each value is mean of five observations
Mean 100.53 100.50 ±S.D. 0.173 0.172 % RSD 0.172 0.171
Table 4 : Results of Recovery Studies
❖ Precision
• Repeatability
Precision of proposed method was ascertained by replicate analysis of homogeneous samples of tablet powder.
• Intermediate precision
Table 5 : Results of Precision Studies
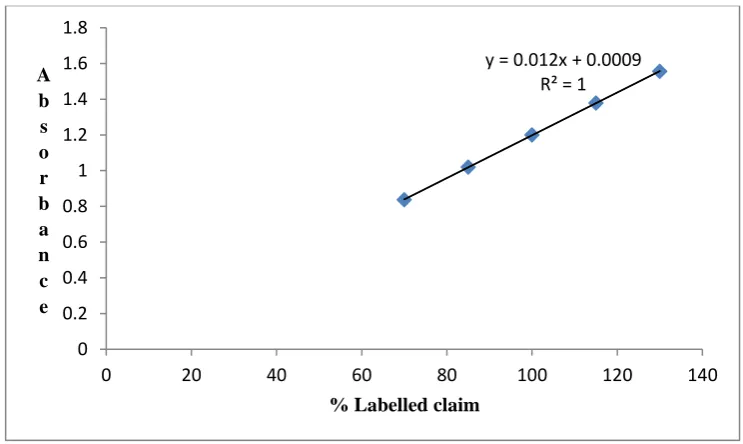
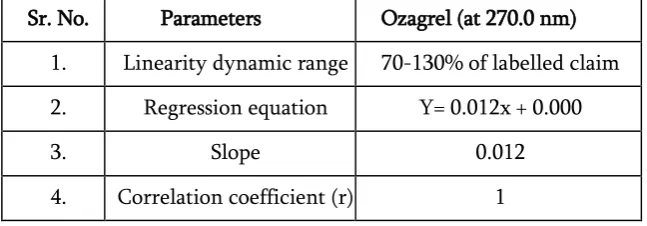
❖ Linearity and Range
• Linearity of response
The standard stock solution of Ozagrel was diluted with water to get series of concentration ranging from 1-10 µg/ml. Absorbances of these solutions were measured at 270.0 nm in 1.0 cm cell using solvent blank. Range of the method
Sample weights of pre- analysed tablet powder were fortified by addition of standard drugs to have the range 70-130 % of labelled claim as discussed under accuracy studies and absorbances of generated sample solution were measured at 270.0 nm.
Figure 3: Calibration curve of range of method
y = 0.012x + 0.0009 R² = 1
0 0.2 0.4 0.6 0.8 1 1.2 1.4 1.6 1.8
0 20 40 60 80 100 120 140
A b s o r b a n c e
% Labelled claim
S. N Obs % of labelled claim
Intra-day Inter-day Different Analyst Spectrophotometer
I (Shimadzu) II (Jasco)
A B A B A B A B A B
1. I 99.57 99.65 99.68 99.63 98.99 98.96 99.63 99.71 99.85 99.26
2. II 99.05 99.27 99.19 99.32 99.63 99.42 99.21 99.25 99.96 99.54
3. III 99.96 99.95 99.86 99.89 99.36 99.31 99.85 99.89 99.52 99.32
Mean 99.86 99.89 99.87 99.87 99.66 99.56 99.90 99.95 99.777 99.373
± SD 0.255 0.216 0.205 0.230 0.685 0.686 0.293 0.275 0.229 0.147
Sr. No. Parameters Ozagrel (at 270.0 nm)
1. Linearity dynamic range 70-130% of labelled claim 2. Regression equation Y= 0.012x + 0.000
3. Slope 0.012
4. Correlation coefficient (r) 1
Table 6 : Results of Range studies
❖ Limit of Detection (LOD) and Limit of Quantitation (LOQ)
LOD and LOQ were determined by the method based on standard deviation of the response and the slope of calibration curve as per ICH guidelines and are as follows:
S
3.3σ
LOD
=
andS
10σ
LOQ
=
Signal to noise ratio (k) = 3.3 and 10 for LOD and LOQ respectively.
= Standard deviation of response (Estimated by measuring the absorbance of standard solution of conc. 1.0 µg/ml for five times and was calculated) = 0.017432
S = Slope of calibration curve (obtained from calibration curve) = 0.124271
Sr. No Parameters Ozagrel at 270.0 nm
1. LOD (µg/ml) 0.4629 2. LOQ (µg/ml) 1.4027
Table 7 : LOD and LOQ studies
❖ Specificity
The specificity studies were carried out by attempting deliberate degradation of the tablet sample with exposure to stress conditions like acidic (1M HCl), alkaline (1M NaOH), normal, oxidizing (3% H2O2), heat
(60 0C) and direct sunlight.
• Standard Solution: Working standard solution was prepared (10.0 g/ml) as described under preparation of standard solution.
• Sample Solution: Accurately weighed quantities of tablet powdered equivalent to about 10 mg of Ozagrel were transferred to six different 10.0 ml volumetric flasks. The samples were then exposed to stress conditions for 24 h as follows:
1) Normal (Control)
2) At room temperature after addition of 1M HCL up to 10.0 ml mark. 3) At room temperature after addition of 1M NaOH up to 10.0 ml mark. 4) At room temperature in dark after addition of 3 % H2O2 up to 10.0 ml mark.
5) At 60 0C (dry heat) for 24 h (after 24 h; water was added to make volume to 10.0 ml mark).
After 24 h the contents were sonicated for 15 minutes and filtered through Axiva Grade I filter paper and 1.0 ml of clear filtrates were diluted to 100.0 ml with water and absorbance was measured at 270.0 nm.
Sr. No Conditions % of labelled claim* ± S.D. Method A Method B 1. Normal 99.46 ± 0.035 100.40 ± 0.043 2. Acid 97.98 ± 0.028 98.91 ± 0.020 3. Alkali 98.86 ± 0.409 98.54 ± 0.390 4. Oxidation 99.47 ± 0.021 100.41 ± 0.025 5. Heat 99.31 ± 0.055 100.25 ± 0.058 6. Sunlight 99.36 ± 0.293 99.62 ± 0.561
Table 8 : Results of Specificity Study
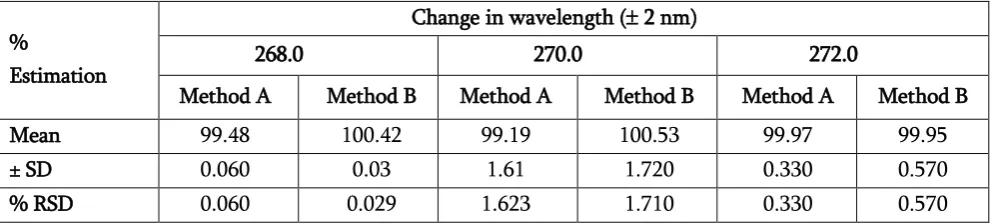
❖ Robustness
The studies were carried out by deliberate change in wavelength.
%
Estimation
Change in wavelength ( 2 nm)
268.0 270.0 272.0
Method A Method B Method A Method B Method A Method B Mean 99.48 100.42 99.19 100.53 99.97 99.95 ± SD 0.060 0.03 1.61 1.720 0.330 0.570 % RSD 0.060 0.029 1.623 1.710 0.330 0.570
Table 9 : Results of Robustness Study
III.
SUMMARY AND DISCUSSION
As per the ICH guidelines and regulatory authorities, it has become mandatory to establish stability indicating assay method (SIAM) for the drug substance (DS) and drug product (DP) to generate the stability data. These SIAM are the validated quantitative analytical method that can detect the changes with time in the chemical, physical, or microbiological properties of the DS and DP, and that are specific so that the contents of active ingredient, degradation products, and other components of interest can be accurately measured without interference. In the present project work successful attempts have been made to develop SIAM for the estimation of Ozagrel.
It was undertaken to develop precise, accurate, reliable, rapid, simple and specific method for estimation of Ozagrel free of interference from its probable degradation products. A simple, accurate and precise UV spectrophotometric method for estimation of Ozagrel in pharmaceutical dosage form was developed.
Standard Stock solution of Ozagrel (1 mg/ml) was prepared in water and it was diluted suitably with water to obtain a working standard with 10.0 µg/ml concentration. This working standard was scanned in the UV range of 200-400 nm. Ozagrel showed well-defined λmax at 270.0 nm and this
wavelength was selected for further study. Ozagrel solution obeyed Beer- Lambert’s Law in
Absorptivity value of Ozagrel at 270.0 nm was found to be 1198.49 ± 0.037. Estimation in tablet were performed by standard comparision method ( method A) and also by using specific absorptivity value (method B).The result of estimation in marketed preparation were found to be 100.72 ± 0.838 and 100.10 ± 0.268 by Method A and B respectively. The developed method was then validated for parameters like accuracy, precision, linearity & range, limit of detection, limit of quantitation, specificity, and robustness as per ICH guidelines and their results are summarized.
Results are indicative of accuracy, precision, sensitivity and robustness of the method. However the method appears to lack in specificity in presence of its degradation products (acid and base hydrolytic degradants) as indicated by non-significant difference in normal and stressed tablet powder sample. This was further substantiated by chromatographic studies which were subsequently performed. In general the method may be used for routine quality control of tablet formulation.
IV. REFERENCES
[1]. ICH, Q2 (R1): "Validation of Analytical Procedures: Text and Methodology" In Proceedings the International Conference on Harmonisation; IFPMA, Geneva, 2005.
[2]. United State Pharmacopoeia 30-National Formulary 25. In Validation of compendial procedures ,Chapter 1225, 2007, p. 549.
[3]. Rui1 JIN, SUN-xiang2 Kao, Zhen1 WANG, HAN Yu-bo1. "Pharmacokinetic Study on Ozagrel in Twelve Healthy Volunteers." Chinese Pharmaceutical Journal, 2006, 41(04), p. 296-298.