Enhanced Energy Consumption Model for Digital
Serial Interfaces in Embedded Systems
Nithiyananthan. K
Aimst Univerrsity, Jalan Bedong, Malaysia Email: [email protected]
Nithya. S
Birla Institute of Technology and Science, Dubai Campus, International Academic City, Dubai, United Arab Emirates Email: [email protected]
Abstract—The main objective of this paper is to develop enhanced energy consumption model to calculate and compare the hardware energy consumption of SPI and I2C digital serial interfaces in PIC microcontrollers and analyze using software simulation tools. Energy consumption of two digital serial interfaces (SPI and I2C) in PIC 16F877 has been measured and compared. Serial communication between two microcontroller(One Master-One Slave) is performed using SPI and I2C protocols, one-byte data has been transmitted from Master to Slave and displayed in two 7-segment LED’s and using a digital oscilloscope ,wave forms in SPI and I2C interface lines(to send clock signal ,one-byte data and the chip select ) were observed. Current probes are used to measure the current in all the interface lines and a graph is plotted for each line. Energy consumption is calculated based on the total current and the supplied voltage (5V). MPLAB IDE is used as a platform for writing the Embedded C code for Master as well as Slave microcontrollers for SPI and I2C serial communications. Proteus VSM (ISIS Professional) is used to model the virtual hardware system which works according to the hex. Files created in MPLAB IDE.
Index Terms—energy consumption, serial peripheral interface, inter integrated circuit, proteus VSM, MPLAB ID
I. INTRODUCTION
Wide ranges of embedded systems with low energy consumption have been developed in the recent years. The number of machines built around embedded systems that are now being used in households and industry is growing rapidly every year. Accordingly, the amount of energy required for their operation is also increasing [1]. Apart from the energy consumed by the embedded processors or controllers, the peripheral devices used in embedded systems could increase the energy consumption of the system. Reduction in very small amount of energy consumption in core processors or controllers, peripherals and communication interfaces can give considerable amount of increased life time of the charge stored in the battery operated embedded systems
Manuscript received August 8, 2013; revised March 11, 2014.
[2]. Sometimes the energy consumption for the communication between core processor (or) controller and peripheral devices can be higher than the energy required for the peripheral operation [3]. So the analysis of energy consumption of digital serial interfaces (like SPI and I2C) can give clear information to the engineers to select one of the interfaces based on applications. While doing such analysis using software simulation tools rather than using hardware, reduces the time required for making physical connections, any changes in virtual hardware or software (code) can be done easily and avoids the cost required to get all the required hardware. One such analysis to measure and compare the energy consumed (hardware energy, not the energy consumption of the software code) by both digital serial interfaces (SPI and I2C) is performed [4].
II. MEASUREMENT OF CONSUMED ENERGY OF SPI DIGITAL SERIAL INTERFACE MODEL
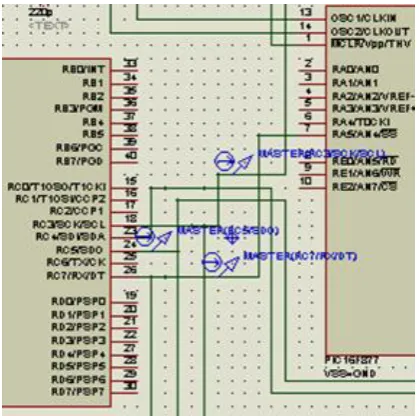
Figure 1. Proteus schematic for SPI data transfer with current probes
Figure 2. Part of the portion of Fig. 1. zoomed to show the current probes
For calculating the energy, one byte data (0x30) was transmitted only once from master to slave. The graphs of the current probes inserted in the lines of SPI interface are plotted for the time duration required for the data transfer only once [7].
Simulation results for SPI model
Energy in terms of power is expressed as follows
E(t)= ∫P(t).dt
E(t)=(V*I).dt=∫ (V*( I1+I2+I3)).dt= V∫ (( I1+I2+I3)).dt =V (∫I1.dt+∫I2.dt+∫I3.dt)
where V – Voltage Source (5V), I1, I2 and I3 are the currents in SPI communication lines Clock line (SCK), SDO and Slave Select line respectively.
As shown in Fig. 3, the clock signal exists upto 31.2ms. From 0 to 31.2ms, the value of
∫I1.dt = (3.6ms*50nA) + 7*(0.8ms*50nA) +7.6ms*50nA
=0.84 nC (1)
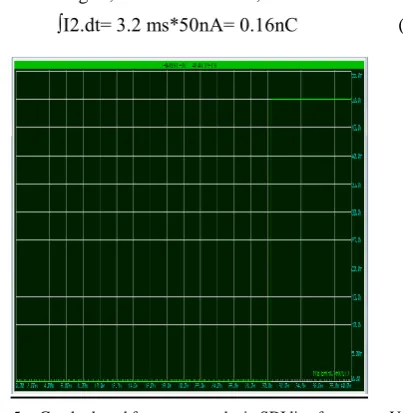
Figure 4. Graph plotted for current probe in SDO line for current Vs. time
As shown in Fig. 4, from 0 to 31.2ms, the value of ∫I2.dt= 3.2 ms*50nA= 0.16nC (2)
Figure 5. Graph plotted for current probe in SDI line for current Vs. time
As shown in Fig. 5, from 0 to 31.2ms, the value of
∫I3.dt= 0.8ms*50nA = 0.04nC (3)
Figure 6. Graph plotted for current probe in SDI line for current Vs. time
As shown in Fig. 6, from 0 to 31.2ms, the value of
∫I4.dt=16.5ms*50nA=8.25 (-10) = 0.825nC (4)
Adding equations (1), (2), (3) and (4)
∫I1.dt+∫I2.dt+∫I3.dt+∫I4.dt = 0.84nC+0.16nC+0.04nC+0.825nC = 1.865nC
Energy consumed in one byte data transfer using SPI communication interface is
E(t) = ∫ (V*I).dt =∫ (V*( I1+I2+I3+I4)).dt = V∫ (( I1+I2+I3+I4)).dt
where V=5v, Substituting the value of V, E(t) = 5*1.865nC = 9.325 nJ
III. MEASUREMENT OF CONSUMED ENERGY OF I2C DIGITAL SERIAL INTERFACE MODEL
The virtual hardware schematic for I2C is shown in Fig. 7. It has two pull up resistors [6] each for SCK and SDA line. One byte data (0x30) has been transmitted from master to slave and displayed in 7-segment LEDs. The schematic is operated with the implied power supply as 5V. Current probes as shown in Fig. 8 have been inserted in all the lines of I2C interface model and the graphs have been plotted. The basics and working principles of I2C have been obtained from [9].
Figure 7. Proteus schematic for I2C data transfer with current probes
IV. MPLABIDE FOR I2CCOMMUNICATION MODEL
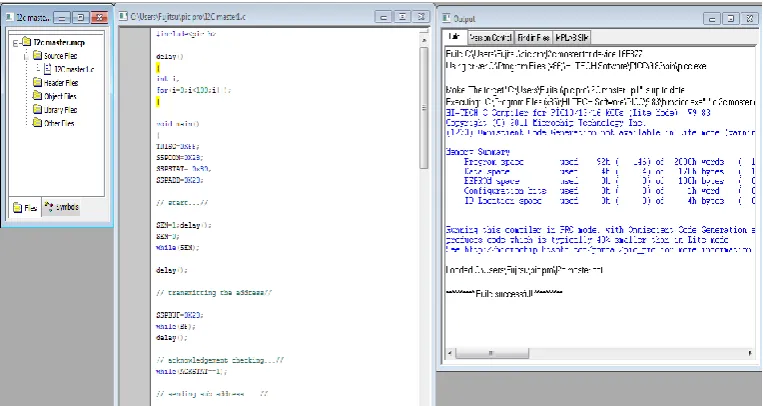
The simulation created for the master and slave microcontrollers (in I2C) is shown in Fig. 9 and Fig. 10. As in the Fig. 9 and Fig. 10, in the left most window pane the created project name is shown below which all the required files are added including the source file. The
center window shows the source code written in Embedded C language and the next window shows the simulated output. Once the simulation done, the .hex files for the master and slave microcontrollers will be ready to import in Proteus VSM (for the schematic in Fig. 7). Similarly for SPIinterface .hex files have been created.
Figure 9. Simulation of I2C ‘C’ code for master microcontroller
Figure 10. Simulation of I2C ‘C’ code for slave microcontroller
V. SIMULATION RESULTS FOR I2C MODEL
For calculating the energy, one byte data (0x30) was transmitted from master to slave. Simulated graphs of the current probes of I2C interface are plotted and shown in Fig. 11, 12 and 13.
Energy in terms of power is expressed as follows
E(t) = ∫P(t).dt
E(t) = (V*I).dt = ∫ (V*( I1+I2)).dt = V ∫ ( I1+I2).dt =V(∫I1.dt+∫I2.dt)
where V – Voltage Source (5V), I1 and I2 are the currents in I2C communication lines Clock line (SCK) and SDA respectively.
∫I1.dt=(1.62s*5mA)+(0.82s*5mA)+(0.8s*5mA)+8*(0. 008s*5mA)(using Fig. 20)+8*(0.008s*5mA)(using Fig. 10)
∫ I1.dt = 16.84mC (5)
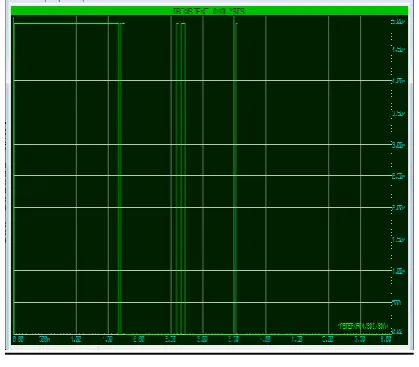
Figure 11. Graph plotted for current probe in SCK line for current Vs. time
Figure 12. Zoomed version of Fig. 11 to show the clock signal clearly
Figure 13. Graph plotted for current probe in SDA line for current Vs. time
As shown in Fig. 13, from 0 to 3.54s, the value of
∫I2.dt=
(1.6s*4.8mA)+(0.01s*4.8mA)+(0.05s*4.8mA)+(0.0 3s*4.8mA)+(0.07s*4.8mA)+(0.01*4.8mA)
=8.496mC (6)
Adding (5) and (6),
∫ I1.dt+∫ I2.dt= 16.84mC+8.496mC=25.336mC
Energy consumed E = 5V*25.336 mC= 0.12668 = 126.68 mJ
VI. CONCLUSIONS
Using SPI and I2C communication interfaces of PIC 16F877 microcontrollers, one byte data (0x30) was transmitted from master to slave. Energy consumption of SPI and I2C interfaces was calculated with 5V supplied voltage and measured current values for transmitting the one byte data. Proteus VSM was used to design the virtual hardware system for SPI and I2C interfaces and MPLAB IDE was used to create ‘embedded c’ program files and .hex files for the microcontrollers used in Proteus VSM. Energy consumed for one byte data transfer using SPI communication interface is 9.325 nJ. Energy consumed for one byte data transfer using I2C communication interface is 126.68 mJ. Among these two interfaces, for single master - single slave serial communication using PIC 16F877, for transferring one byte data (0x30) from master to slave SPI serial interface consumes less energy than I2C interface. As the future work, energy consumption of SPI and I2C communication interfaces of PIC 16F877 can be calculated for transmitting more bytes of data from master to slave and for other PIC microcontrollers.
REFERENCES
[1] K. Mikhaylov, J. Tervonen, and D. Fadeev, “Energy efficiency aware application development using programmable commercial low-power embedded systems processors,” in Embedded Systems-Theory and Design Methodology, Croatia: InTech, 2012, pp. 407– 430.
[2] Z. Nakutis, “Embedded systems power consumption measurement methods overview,” MATAVIMAI, vol. 2, no. 44, pp. 29–35, 2009. [3] K. Mikhaylov and J. Tervonen, “Evaluation of power efficiency for digital serial interfaces of microcontrollers,” in Proc. NTMS, May 2012, pp. 978-981.
[4] M. Kuorilehto, M. Kohvakka, J. Suhonen, P. Hamalainen, M. Hannikainen, and T. Hamalainen, Ultra-Low Energy Wireless Sensor Networks in Practice:Theory, Realization and Deployment, Hoboken, NJ: John Wiley & Sons, 2007.
[5] D. Johnson, “Implementing serial bus interfaces using general purpose digital instrumentation,” IEEE Instrumentation Measurement Magazine, vol. 13, no. 4, pp. 8–13, August 2010. [6] V. Tiwari, S. Malik, and A. Wolfe, “Power analysis of embedded
software: A first step towards software power minimization,”
IEEE Transactions on Very Large Scale IntegrationSystems, vol. 2, no. 4. pp. 437–445, 1994.
[7] C. J. Xian, L. Cai, and Y. H. Lu, “Power measurement of software programs on computers with multiple I/O components,” IEEE Transactions on Instrumentation and Measurement, vol. 56, no. 5, pp. 2079–2086, 2007.
[8] G. Mathur, P. Desnoyers, D. Ganesan, and P. Shenoy, “Ultra-low power data storage for sensor networks,” in Proc. IPSN, 2006, pp. 374–381.
[10] SPI Block Guide v.03.06, Motorola Semiconductors Products Inc. Std.S12SPIV3/D-2003.
K. Nithiyananthan received his Ph.D. in Faculty of Electrical Engineering from College of Engineering, Guindy, Anna University, Chennai,India in 2004. He is currently working as Senior Associate Professor in the School of Engineering, Faculty of Engineeringand Computer Technology, AIMST University Malaysia. His research
interests include computer applications to power systems engineering, Internet technologies and embedded systems.