The Use of Conjoint and Cluster Analysis For Preference-Based Market
Segmentation
Nenad Djokic
1, Suzana Salai
2,
Ruzica Kovac-Znidersic
3, Ines Djokic
4, Gordana Tomic
51Higher School of Professional Business Studies
4 Vladimira Perica Valtera Street, 21000 Novi Sad, Serbia e-mail: [email protected]
2,3,4
Faculty of Economics Subotica
9-11 Segedinski put Street, 24000 Subotica, Serbia
e-mail: [email protected], [email protected], [email protected]
5Belgrade Business School, Higher School of Professional Studies
73 Kraljice Marije Street, 11000 Beograd, Serbia e-mail: [email protected]
http://dx.doi.org/10.5755/j01.ee.24.4.3118
Market segmentation implies dividing the market into smaller segments that are homogenous inside, and heterogenous in relation to one another. Market segmentation is a part of strategic marketing, together with targeting and positioning, preceded by marketing research and followed by creating, implementing and controlling the marketing mix. As well as being an essential field of academic research, market segmentation proved to be a very useful concept for managers. The market segmentation concept dates back almost six decades, but issues raised regarding market segmentation more than three decades ago are still relevant and the number of different approaches in answering these questions is high.
Preference-based segmentation can also be viewed in this context. Differences in consumers’ preferences are, in fact, one of the vital causes of market segmentation. Preference-based market segmentation can be conducted by using conjoint analysis in combination with cluster analysis. The benefits of such approach are multiple, as they give rise to opportunities for: formulating the questions in a manner similar to real-life purchasing situations; reducing the number of socially desirable answers; introducing several attributes of a given product thus enabling an insight into the relative importance of the product's attributes, and order of preferences for different levels of these attributes, and, based on this, defining different market segments; testing the significance of various other market segmentation criteria (sociodemographic, psychographic and/or behavioural) for profiling the established segments; increasing the comparability of results of different studies; using this approach in planned new product launches and on emerging and developing markets as well as studying the difference between expressed preferences and purchases, in terms of obstacles preventing preferences to transform into purchase phase.
Besides theoretical aspects regarding market segmentation and preference-based market segmentation by using conjoint and cluster analysis, this article demonstrates the use of such approach in researching student population in Vojvodina (the northern province of the Republic of Serbia) and this population’s preferences to yoghurt (250 questionnaires handed out, 123 returned filled in, 98 included in the final analysis). In addition to results at the total sample level, two segments were identified and differences between them were investigated. Implications to the questions raised in the theoretical section of the article were sought on the obtained results. The article also seeks to point to the benefits of using this approach in domestic conditions, where its use is almost negligible.
Keywords: marketing research, market segmentation, market segmentation criteria, preference-based market segmentation, conjoint analysis, cluster analysis.
Introduction
The market segmentation concept dates back almost six decades (Smith, 1956). Jobber and Fahy (2006) define market segmentation as the identification of individuals or organizations with similar characteristics, with significant implications for determining marketing strategy. Kotler (2007) lists market segmentation among the steps in the marketing management process. Together with targeting and positioning, Kotler includes market segmentation in strategic marketing, which follows upon the completion of marketing research and precedes tactical marketing, i.e. creating
marketing mix, and its implementation and control. Rather than being homogenous groups of consumers formed naturally on the market, segments are determined by marketing managers’ strategic view of the market, i.e. managerial perspective determines the way homogenous groups of potential consumers will be identified by marketing research (Wedel & Kamakura, 2002).
between two alternative approaches. The first implies that market segments are defined based on descriptive characteristics – geographic, demographic and psychographic, followed by investigating whether thus defined market segments have different needs or reactions to products. The other approach stems from behavioral market segmentation, with the aim of finding descriptive characteristics for identified market segments. The same authors also argue that market segmentation can be approached at the level of a market segment comprising a single consumer, which is known as customized or one-to-one marketing. Actually, the prominent idea is that knowing consumers is not enough; they also have to be understood.
As well as being an essential field of academic research, market segmentation proved to be an extremely useful concept for managers (Wedel & Kamakura, 2002). Issues concerning market segmentation are therefore the subject of lively discourse not only among theoreticians but also practitioners, often the most pronounced in the part related to the need to bring academic and applied approaches to market segmentation closer. Important issues regarding market segmentation that require investigation, as identified by Wind in 1978, were confirmed as relevant in later research as well (Wedel & Kamakura, 2002; Quinn & Dibb, 2010). The order of priorities in this research was partly changed (managerial relevance and implementation have become the research essential preoccupation), but the priorities of the research (including the issues of market segmentation variables, choice of variables, robustness of segmentation outputs in addition to the already mentioned managerial relevance and implementation) remained the same over the decades (Quinn & Dibb, 2010).
However, it is the fact that the research priorities remained the same for decades that suggests that the approach to these priorities has undergone certain changes. One of the illustrations that can be mentioned is a change in the attitude towards choosing market segmentation criteria. Writing on new market segmentation criteria, Yankelovich (1964) stated that until then dominant demographic criteria had not been the most appropriate for market segmentation; instead, what was crucial for marketing objectives were differences in consumers’ attitudes, motivation, values, patterns of usage, aesthetic preferences and susceptibility level. Four decades later, however, Yankelovich and Meer (2006) criticize the domination of psychographic market segmentation, arguing that, despite of being significant for advertising, where it manages to attract consumers to a brand, it is not simultaneously adequate for achieving some other corporate objectives, and therefore give a matrix unifying decisions of different level of importance with issues relevant to business, consumers’ preoccupation and the tasks and criteria of market segmentation.
The problem set before this study – the research of preference-based market segmentation - was defined in the context of relevant issues related to market segmentation. Several aims were defined in connection with this problem. Firstly, it deals with presenting and demonstrating the use of appropriate technique by which the given segmentation could be performed – in this case, ratings-based conjoint analysis in combination with cluster analysis. In addition to
this aim, the study included the research of possibilities, advantages and implications of chosen approach, both from scientific and managerial aspects.
It is chosen in this article to research the use of preference-based market segmentation by conjoint and cluster analysis on the example of Vojvodina (the northern province of the Republic of Serbia) student population’s yoghurt market. In that context, two hypotheses have been formulated. The first hypothesis is: At least two market segments can be identified at Vojvodina student population’s yoghurt market by using preference-based market segmentation. The second hypothesis is: Market segments at Vojvodina student population’s yoghurt market are statistically significantly different not only by preferences towards yoghurt, but by certain socio-demographic and behavioral characteristics, as well.
In addition, in the conditions of the authors’ milieu, the presented study has an additional value, in terms of actualizing and promoting relatively unfamiliar and quite unused approach to market segmentation in their country. Actually, as far as the authors are informed, preference-based market segmentation with conjoint and cluster analysis is severely underused in Serbia, both in terms of the number of scholars who would predominantly focus their research to the issue, and in terms of applying this analysis for resolving market problems (apart from the Focus Balkans project, where one of the sections deals with traditional food in Serbia and other countries of Southeastern Europe). On the other hand, the development of market economy, fierce competition, especially in some industries, increasingly manifested differentiation among consumers, accompanied by the increase of their purchasing power, suggest a stronger need for market segmentation and raise questions in the national milieu that are normally raised before market segmentation at the global scale, already mentioned above.
The study includes desk research and field marketing research (Salai & Bozidarevic, 2009). The desk research resulted in gathered secondary data, presented in the section of the paper giving an overview of literature on the researched issues. The comparative marketing research method was applied to this end. Primary data were gathered by means of a survey (structured personal interviews conducted with respondents by using a questionnaire).
Preference-Based
Market
Segmentation:
Literature Review
Preference-based market segmentation can be understood in the context of issues raised regarding market segmentation.
Kardes (1999) states that differences in consumers’ preferences, attitudes and perceived values are, in fact, one of the vital causes of market segmentation. The influence of these variables is noticed considering food market too (Kim, 2012). However, Wedel and Kamakura (1998) suggest that this is not a wide use of consumers’ preferences as a basis for market segmentation. This situation is caused partly because such an approach might entail challenges in its implementation.
have demonstrated that such an approach is possible and successful as well: Delarue and Loescher (2004) in the study with chewing gums; Honkanen, Olsen and Myrland (2004) in the study of meal preferences among Norwegian teenagers; Olsen, Prebensen and Larsen (2009) in the study of convenience food in Norway; as well as Honkanen (2010) when defining market segments in Russia according to food preferences. Drewnowski and Hann (1999) point out that according to respondents’ food preferences (as well as according to reported frequencies of food consumption), their dietary outcomes can be predicted.
Preference-based market segmentation can be performed by using conjoint analysis combined with cluster analysis. In the following section of the paper, basic information regarding conjoint and cluster analysis, as well as advantages of using it for preference-based market segmentation, will be given.
Conjoint and Cluster Analysis as Methodology
for Preference-Based Market Segmentation
As well as the cluster analysis and multidimensional scaling, conjoint analysis emerged in the 1970s, encouraged by the development of behavioral sciences, especially psychometry and mathematical psychology, and is used in situations when the decision maker has to choose between the options with simultaneous variations of two or more attributes: whether to choose option X or option Y, where X has a better attribute A, while Y has a better attribute B, and this refers to several attributes (Green et al., 2004).
The significance of conjoint analysis for consumer research was spotted immediately in the years of its emergence (Green & Srinivasan, 1978). In addition to market segmentation, this technique enables measuring consumer preferences and their purchase intentions, establishing how consumers would respond to changes on the existing products or launching new ones, enhancing the current achievements, application for defining the pricing policy, use in advertising, distribution, controlling, as well as in stimulating purchasing decisions with a focus on competitors’ responses (Gustafsson et al., 2007).
A flow diagram of conjoint analysis, explaining the procedure of applying this analysis, includes: selection of the preference function, selection of data collection method, selection of data collection design, selection of the way the stimuli are presented, selection of data collection procedure, selection of the method for evaluation of the stimuli and estimation of benefit values (Gustafsson et al., 2007).
There are several different techniques of conjoint analysis. Various conjoint analysis techniques, used for market segmentation as well, are an ever-present part of researchers’ interest, notably in terms of comparing them by various criteria (Elrod et al., 1992; Vriens et al., 1996; Moore, 2004). Upon comparison of the techniques mentioned above, full agreement regarding the choice of the most appropriate market segmentation technique as well, is lacking among theoreticians, and especially among practical researchers.
Cluster analysis is a term used to describe a family of statistical procedures designed to discover classifications within complex data sets with the goal to group objects
into clusters in a manner that objects within one cluster share more in common with each other than they do with the objects of other clusters (Gore, 2004). There are several phases in conducting cluster analysis: selection of distance measure for individual observations, selection of cluster algorithm, defining the distance between clusters, determining the number of clusters and validation of analysis (Everitt et al., 2001).
The advantages of preference-based market segmentation (using in this specific case, choice-based conjoint analysis and latent class segmentation) were presented in the article by Wilson-Jeanselme and Reynolds (2006). Djokic, Salai and Mesaros (2012) view the benefits of preference-based market segmentation by conjoint and cluster analysis (on an example of organic product consumers, for which reason the presentation of advantages at this point is adapted to the overall situation) through the possibilities of:
• formulating questions in a manner appropriate to real-life purchase situations;
• reducing the number of socially desirable answers; • introducing other attributes of a given product, thus enabling an insight into the relative importance of the product's attributes, and order of preferences for different levels of these attributes, and, based on this, defining different market segments;
• testing the significance of various other (sociodemographic, psychographic and/or behavioral) market segmentation criteria for profiling the established segments;
• increasing the comparability of results of different studies;
• using this approach in planned new product launches and on emerging and developing markets;
• studying the difference between expressed preferences and purchases, in terms of obstacles preventing preferences to transform into purchase phase.
The following section of the article aims to present the above mentioned advantages through an overview of the results of the carried out marketing research.
Marketing research settings and conducting
The other remark regarding the research is that yoghurt is chosen as a product for survey not only because its consumption is widely present among the population of the Republic of Serbia, but also because this product has been undergoing intensive innovation over the past years.
When designing the questionnaire, relevant attributes of yogurt and their levels were chosen (Table 1) whose combinations (each of the combinations is a possible product description) would be offered to respondents to evaluate. According to the earlier research of consumers’ shopping habits in Serbia the chosen attributes are related to yoghurt researches conducted by marketing research agencies, published on two occasions in 2011 and 2012 in Progressive Magazin (http://www.crier.rs). Four different
brands’ variations were given to respondents to evaluate (these four brands have the largest market share in Serbia, according to the research mentioned previously). In addition, the authors consulted the representatives of dairy industry on the choice of yoghurt attributes and their levels. Some attributes, notably the price, were omitted so that attribute levels could be mutually independent (Kuzmanovic, 2004), and also because of the comparatively lower purchasing power of the student population, which is expected to be discontinued once they’ve found employment, when they will be able to achieve their preferences by shopping without such strong impact of the pricing attribute.
Table 1
Chosen attributes and attribute levels of yoghurt
Attribute Attribute level
1 2 3 4 5
1 Producer Imlek Mlekara Subotica Somboled Mlekara Šabac
2 Type of milk Cow Goat
3 Milk fat content 0 % 0.5 % 1.5 % 2.8 % 3.2 %
4 Fruit flavour None Strawberry Apricot Sour cherry Wild berries
5 Special function None Probiotic Immuno
6 Lactose content Present None
7 Packaging PET bottle Carton
8 Volume 1 litre ½ litre 0.2 litre
The possible number of attribute level combinations for yoghurt is 4*2*5*5*3*2*2*3=7.200. However, giving such number of combinations to respondents to evaluate is pointless and unnecessary. As conjoint analysis can actually be viewed as issue of multiple regression, the number of parameters to be evaluated (number of cards handed out to consumers) can be calculated by subtracting the total number of attributes (8 in this case) from the total number of all attribute levels (26 in this case), adding 1 to the balance and then multiplying the obtained figure by 1.5
to 3 (http://www.sawtoothsoftware.com/download/techpap /caexcel.pdf). The minimum number of combinations set by the authors to this number of attributes and attribute levels was calculated in the described way and multiplied by 2, so it is (26-8+1)*2=38
Defining 38 as the minimum number of combinations and using orthogonal design, the program (SPSS Trial Version) generated 49 different combinations added to the questionnaire (one of the generated combinations is shown in Table 2).
Table 2
Example of card given to respondents for evaluation
Card
ID Producer
Type of Milk
Milk fat
content Fruit flavour
Special
function Lactose content Packaging Volume
Evaluation (0 TO 10)
10 Somboled cow 0% sour cherry probiotic present carton ½ litre
In addition to the above, the questionnaire also included the questions related to some of the respondents’ sociodemographic and behavioral characteristics. These questions refer to the respondents’ age and gender, accommodation (that may correspond to the way respondents obtain their meals – respondents living with their parents will probably have meals within their families, respondents living in rented accommodation will probably prepare food by themselves, respondents living in the dorm will probably eat in a student canteen), frequency of consumption of milk and yoghurt, and the amount of money spent on food monthly.
Having designed the questionnaires, the authors consulted several marketing research experts on the content, followed by a pre-testing with 32 students, which showed that some of the questions needed to be reworded (frequency of yoghurt and milk consumption and range of amounts spent on food).
The survey was conducted in May 2012. Several assistant lecturers from the University of Novi Sad handed
Out of 250 questionnaires handed out, 123 were returned filled in. Having eliminated the questionnaires of respondents who do not consume the given product, or expressed their preference to all offered products by the same evaluation, 98 questionnaires were left and included into the final analysis.
Sample Description
Respondents whose questionnaires were included into the analysis are aged 19 to 29 (22.86 years of age on the average). The sample comprised 20 males (20.4%) and 78 females (79.6%). Predominantly female respondents in the sample are acceptable, because, according to the latest research results, it is the women that predominantly make shopping decisions and go shopping for food in the Republic of Serbia (FOCUS-BALKANS, 2010). Most of the respondents were tenants in rented accommodation (40.8 %); the second largest group live with their parents (39.8 %), and finally, 16.3 % respondents live in the dorm. The percentage of respondents consuming milk daily amounted to 26.5 %; 36.7 % respondents consume it
several times a week; 18.4 % do it once a week, whereas 8.2 % of the respondents consume milk once a month or less. Respondents consuming yoghurt daily account for 14.3 % of the sample; several times a week 48 %, once a week 32.7 %, while 5.1 % of the respondents consume yoghurt once a month or less. 13.3 % of the respondents spend up to 3,000 dinars (at the time of the survey, approximately 27 euro) a month on food; 24.5 % respondents spend 3,000 to 5,000 dinars (27 to 45 euro); 38.8 % spend between 5,000 and 10,000 dinars (45 to 90 euro); 17,3 % spend between 10,000 and 15,000 dinars (90 to 135 euro), while 6.1 % of them spend over 15,000 dinars (135 euro).
Marketing Research Results
The analysis conducted on the total sample showed the following values of correlation between observed and estimated preferences: Person’s R=0,992; Kendall’s tau=0,812, which confirms that the conjoint model described the respondents’ ratings well. The results obtained based on the total sample are shown in Table 3.
Table 3
Conjoint analysis results on the total sample
Attribute Importance values Attribute level Utility Estimate Std. Error
Producer 12,312
IMLEK ,066 ,063
MLEKARA SUBOTICA -,068 ,063
SOMBOLED ,050 ,063
MLEKARA SABAC -,048 ,080
Type Of Milk 31,633 COW 1,568 ,038
GOAT -1,568 ,038
Milk Fat Content 15,526
0% -,143 ,067
0,5% ,053 ,067
1,5% ,211 ,087
2,8% ,192 ,087
3,2% -,313 ,087
Fruit Flavour 19,061
NONE ,379 ,067
STRAWBERRY -,011 ,067
APRICOT -,309 ,087
SOUR CHERRY ,049 ,087
WILD BERRIES -,107 ,087
Special Function 6,943
NONE ,071 ,051
PROBIOTIC -,060 ,056
IMMUNO -,011 ,056
Lactose Content 3,722 PRESENT -,036 ,038
NONE ,036 ,038
Packaging 3,868 PET BOTTLE -,088 ,038
CARTON ,088 ,038
Volume 6,936
1 LITRE ,067 ,051
½ LITRE ,059 ,056
0.2 LITRE -,126 ,056
(Constant) 3,720 ,045
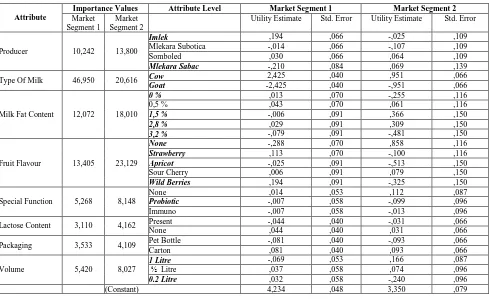
The analysis was also performed starting from individual preferences of each respondent for different yoghurt attribute levels. This analysis particularly enabled preference-based market segmentation. The dendogram below (Figure 1) indicating the existence of two market segments was obtained using squared Euclidian distance as a distance measure, and one of two most used approaches in cluster analysis – Ward’s method (Gore, 2000). It can be concluded that the first hypothesis is confirmed.
Figure 1. Dendogram with marked clusters (market segments)
Table 4
Conjoint analysis results for clusters (market segments)
Attribute
Importance Values Attribute Level Market Segment 1 Market Segment 2
Market Segment 1
Market Segment 2
Utility Estimate Std. Error Utility Estimate Std. Error
Producer 10,242 13,800
Imlek ,194 ,066 -,025 ,109
Mlekara Subotica -,014 ,066 -,107 ,109
Somboled ,030 ,066 ,064 ,109
Mlekara Sabac -,210 ,084 ,069 ,139
Type Of Milk 46,950 20,616 Cow 2,425 ,040 ,951 ,066
Goat -2,425 ,040 -,951 ,066
Milk Fat Content 12,072 18,010
0 % ,013 ,070 -,255 ,116
0,5 % ,043 ,070 ,061 ,116
1,5 % -,006 ,091 ,366 ,150
2,8 % ,029 ,091 ,309 ,150
3,2 % -,079 ,091 -,481 ,150
Fruit Flavour 13,405 23,129
None -,288 ,070 ,858 ,116
Strawberry ,113 ,070 -,100 ,116
Apricot -,025 ,091 -,513 ,150
Sour Cherry ,006 ,091 ,079 ,150
Wild Berries ,194 ,091 -,325 ,150
Special Function 5,268 8,148
None ,014 ,053 ,112 ,087
Probiotic -,007 ,058 -,099 ,096
Immuno -,007 ,058 -,013 ,096
Lactose Content 3,110 4,162 Present -,044 ,040 -,031 ,066
None ,044 ,040 ,031 ,066
Packaging 3,533 4,109 Pet Bottle -,081 ,040 -,093 ,066
Carton ,081 ,040 ,093 ,066
Volume 5,420 8,027
1 Litre -,069 ,053 ,166 ,087
½ Litre ,037 ,058 ,074 ,096
0.2 Litre ,032 ,058 -,240 ,096
(Constant) 4,234 ,048 3,350 ,079
The results of the conjoint analysis on the total sample (Table 3) indicate that the greatest impact on the yoghurt-related preference is made by the type of milk it is produced from (the importance value of this attribute is 31.633 %). The following attributes are identified by relative importance for yoghurt preference: fruit flavor – 19.061 %; milk fat content – 15.526 %; producer – 12.312 %; special function – 6.943 %; volume – 6.936 %, whereas the impact of packaging and lactose content influence the preferences the least and almost equally – 3.868 % and 3.722 % respectively. The analysis also had to include preferences to different attribute levels. This was done by comparing utility estimate values for all the levels of a single attribute. The most preferred attribute level is shown by the highest utility estimate value, and so on. Based on the results, the “ideal yoghurt” at the level of all respondents is made from cow milk, without fruits added,
with 1.5 % milk fat, produced by Imlek, without special function, packed in 1 liter, without lactose content and in carton packaging. When analyzing the results at two defined market segments level (Table 4) one can notice that the first market segment comprises 41 and the second 57 respondents. These two market segments show differences both in the order of importance of preferred attributes and their levels.
flavored yoghurt, strawberry flavored yoghurt, sour cherry flavored yoghurt, apricot flavored yoghurt, and finally unflavored yoghurt). These attributes are followed by the attribute related to milk fat content, where yoghurt with 0.5 % milk fat content is the most preferred, and by the attribute related to the producers, where the most preferred yoghurt, like in the results of the total sample, is the one produced by Imlek.
The second market segment comprises respondents to whom three attributes are approximately similar by importance: presence of fruit in the yoghurt (23.129 %), milk from which the yoghurt was produced (20.616 %), and milk fat content (18.01 %). Furthermore, consumers in this market segment prefer non-flavored yoghurt, produced from cow milk with 1.5 % milk fat content. The favorite yoghurt producer for consumers in this segment is Mlekara Sabac, followed by Somboled, while Imlek takes up the penultimate place. Like in the first, consumers in this segment prefer yoghurts without special functions, which are lactose free and in carton packaging, although the importance values of these attributes in comparison to the earlier listed ones are relatively lower.
In addition to comparing by importance values and preference levels of yoghurt attributes (attribute levels with statistically significant differences between segments are printed in bold italic in Table 4), it is also possible to compare market segments by sociodemographic and behavioral characteristics given at the beginning of the questionnaire. As two market segments (categorical variables) were compared, if the comparison was done by preferences to different attribute levels and respondents’ age, testing two segments was performed by means of independent samples T-test when variables had normal distribution, and Mann-Whitney non-parametric test when variables did not have normal distribution. Mann-Whitney test was also used for establishing differences between segments by frequency of milk consumption, frequency of yoghurt consumption, and the amount of money spent for food. Chi-square test was used for comparing segments by gender and residence, i.e. accommodation. The results of these tests are given in appendices.
When sociodemographic and behavioral variables comprised in the questionnaire are included in the analysis, it can be seen that two market segments are statistically significantly different by the fact that the members of the second market segment are more mature, predominantly male, and consume yoghurt more often. It can be concluded that the second hypothesis is confirmed.
Interpretation and Implications of Marketing
Research Results
The results show that consumers in both market segments prefer cow milk yoghurt to goat milk yoghurt (where this question is the first and second respectively by importance for the members of these two market segments). Goat milk yoghurt is an innovation on the Serbian market, goat milk itself is often perceived as exceptionally healthful, but its taste is considered as less pleasant than that of cow milk. In the authors’ opinion, rejecting goat milk yoghurt should not be interpreted as non-acceptance of innovative products, especially in view
of the fact that the first market segment accepts another innovation (fruit-flavored yoghurt) - the authors consider fruit-flavored yoghurt as innovation since it emerged in Serbian market after the year 2000, but still has relatively small market share in comparison to traditional yoghurt (http://www.crier.rs). The interpretation could be sought in lower health consciousness levels on the one hand, which is to be expected at the respondents’ age, and unwillingness to compromise on taste on the other.
This interpretation matches some research conducted worldwide. As regards the argument suggesting that rejection of goat milk is due to the younger respondents' lower health consciousness, an example of similar results elsewhere is a study of organic products, where one of the essential purchase motives is health (Hughner et al., 2007). Another comparison is a research of functional products. Functional products emerged by the initiative of the representatives of the Japanese government in order to combat the anticipated trend of increasing chronic illnesses in their society (Shimizu, 2003), in the situation where the consumers worldwide are aware of and informed about the importance of nutrition for health, and their expectations from food are no longer related to survival, satiating hunger or even safety, but actually the potential contribution of diet to health (Diplock et al., 1999). Although there are differences between certain studies depending on product categories, a part of the articles actually explains that older people, due to their awareness of their own health, among other things, are more likely to purchase organic (Hughner
et al., 2007) or functional products (Childs & Poryzees, 1998). Bhaskaran and Hardley (2002) conclude that only about 20 % of young consumers who participated in their research, are driven by health attributes when buying food, while, unlike them, older consumers’ behavior can be qualified as preventive.
Moreover, as regards the second argument, suggesting rejection of goat milk due to unwillingness to compromise about taste, good examples are the studies (in this specific case, of functional products) confirming that consumers, even in the case of health-beneficial products, do not show a high degree of willingness to compromise on taste (Tourila & Cardelo, 2002; Verbeke, 2006).
The second fact resulting from the research is that, unlike the second market segment and the total sample, the first market segment prefers fruit flavored yoghurts as innovation on the Serbian market, and that it shows statistically significant difference from the second segment in terms of higher share of female respondents. This matches the studies regarding the difference between genders in their attitudes to food. Beardsworth et al.,
(2002) describe two patterns: one, which they call robust, denoting men’s attitudes to food, and the other, called virtuous, reflecting women’s attitude to food. Among other things, this implies that men are more traditional in terms of food, unlike women, who are more likely to accept new products. In this case, higher acceptance level of fruit-flavored yoghurts as innovation on the Serbian market by women confirms the above mentioned patterns.
far most important for yoghurt to be produced from cow milk and preferred fruit flavored yoghurts, comprised younger respondents. There are, however, other studies that found a difference between age groups, also within a relatively narrow age interval (e.g. young adults aged 25 to 34 and early middle-aged, 35 to 44) (Krystallis et al., 2008).
It is, however, also necessary to consider the managerial implications of the obtained results. If the results of the conjoined analysis were observed in terms of the total sample, it could be concluded that yoghurt consumers in the student populations are predominantly traditionalists – they find it the most important for yoghurt to be made from cow milk, without added fruit, with medium milk fat content. However, upon preference based market segmentation, we also get a picture of the market segment that prefers fruit-flavored yoghurts as innovation on the national market, which is statistically significantly different in terms of proportion of younger respondents, women, and those consuming yoghurt less frequently. These respondents find taste the most important, i.e. their favorite yoghurt must be made from cow milk, which, together with its other mentioned characteristics, qualifies them as gourmets inclined to innovation. These respondents show statistically significant difference from those in the other market segment in terms of their loyalty to Imlek, which is also most represented at the entire sample level, as shown in the already cited research of Progressive Magazin on the entire population of Serbia.
The stated above points to multiple implications for managers. Bearing in mind that these are predominantly young women, it is necessary to form a marketing mix targeting this segment, and position it in their conscience. Additional motivation research is necessary in order to obtain the opinions, inclinations and habits of this population, which could partly have been covered by this questionnaire, but was omitted due to the focus on other questions for the purpose of this article. The product’s visual identity, pricing, distribution channels, and integrated marketing communication activities need to be adjusted to the mentioned population and their preferences. For instance, if the research showed that developing a new product for this market segment would be profitable for Imlek, it could be assumed that the marketing mix should be created with “feminine” colored 0.5 litre packaging, at a somewhat higher price, both due to ingredients and the lower frequency of yoghurt consumption. In addition, the product should be promoted in time slots of the TV serials watched by 20-year-old girls (certainly Turkish TV serials popular on national TV channels), the billboards should be located near the University campus, and also advertised through radio stations most frequently listened by this population. Sales promotion actions could be initiated in fitness centres, especially at the times of aerobic exercises, and the group instructors, as opinion leaders, could be educated and stimulated with certain rewards. The promotion should also focus on taste, show pieces of fruit in the yogurt, the energy of the pretty girl featuring in the commercial, forming the image of a young, successful, strong female whose lifestyle includes accepting innovation.
On the other hand, respondents in the second market segment, including mostly men, older than members of the first market segment, are firm traditionalists. The yoghurt
they prefer – without fruit, made from cow milk, with medium milk fat content, is produced predominantly by Mlekara Sabac or Somboled. After the additional research, which is also necessary for these consumers as for consumers from the segment described above, the visual identity would certainly need to be formed so as to be acceptable for men as well, set a somewhat lower price due to more frequent consumption, organize the distribution so as to make the yoghurt available in bakeries and patisseries traditionally selling burek (traditional cheese or meat pie) as energy-giving food, whereas in supermarkets, this product could be placed near beer, another product popular among this population. In promotion, it would be definitely recommendable to emphasize that yoghurt fits into traditional menus, and also to focus on its importance for the organism when doing sports, or as a food supplement for those who cannot have regular meals due to working hours (in view of the fact that some of the student population at this age are already employed). In addition, opinion leaders to be educated and motivated to recommend such product to the target population are trainers at gyms, which the members of this population often attend.
Conclusions
Market segmentation constitutes a part of strategic marketing and implies dividing the market into smaller parts that are homogenous inside, and heterogeneous in relation to each other. As well as being a significant area of academic research, market segmentation has proven to be very useful concept to managers, so that issues related to market segmentation have been the subject of lively discussion both among theoreticians and practitioners. Issues emerging in such discourse as relevant can be summarized in several topics: managerial relevance and implementation, market segmentation variables, choice of variables, robustness of segmentation outputs (Quinn & Dibb, 2010) and have been relevant for more than three decades.
Including additional questions and extending the number of products could result in generalizing variables relevant to consumers’ preference to, for instance, food, which could even result in generating a model that would describe factors influencing consumers preference for food (in this case), and a clearer definition of variables relevant to individual product groups (theoretical corroboration of heterogeneousness, aimed at identifying variables to be included in models – Wedel & Karamakura, 2002). This
approach enables higher degree of comparability of results at different points of time, in different parts of the world (i.e. enables understanding the dynamic nature of preferences and composition of market segments – Wedel & Kamakura, 2002). In addition to the above, comparison with the results of realized purchases could enable the research of factors hindering the transition of consumers from the affective (preference) to behavioral (purchase) phase in consumer behavior.
Appendicies
CHI-SQUARE TESTS
GENDER COMPARISON BETWEEN CLUSTERS (MARKET SEGMENTS)
ACCOMMODATION COMPARISON BETWEEN CLUSTERS (MARKET SEGMENTS)
Value df
Asymp . Sig. (2-sided)
Exact Sig. (2-sided)
Exact Sig. (1-sided)
Value df
Asymp. Sig.
(2-sided)
Exact Sig. (2-sided)
Exact Sig. (1-sided)
Point Probabil
ity
Pearson
Chi-Square 4,924
a 1 0,026 Pearson
Chi-Square ,269
a 3 0,966 0,968
Continuity
Correctionb 3,861 1 0,049
Likelihood
Ratio 5,291 1 0,021
Likelihood
Ratio 0,273 3 0,965 0,968
Fisher's
Exact Test 0,041 0,022
Fisher's
Exact Test 0,403 0,968
Linear-by-Linear Association
4,874 1 0,027
Linear-by-Linear Association
,039b 1 0,844 0,916 0,464 0,083
N of Valid
Cases 98
N of Valid
Cases 98
a. 0 cells (,0%) have expected count less than 5. The minimum expected count is 8,37.
a. 2 cells (25,0%) have expected count less than 5. The minimum expected count is 1,26.
b. Computed only for a 2x2 table b. The standardized statistic is ,197.
Ward Method
gender
Total
male female
1
Count 4 37 41
% within Ward Method 9,8% 90,2% 100,0%
% within gender 20,0% 47,4% 41,8%
% of Total 4,1% 37,8% 41,8%
2
Count 16 41 57
% within Ward Method 28,1% 71,9% 100,0%
% within gender 80,0% 52,6% 58,2%
% of Total 16,3% 41,8% 58,2%
Total
Count 20 78 98
% within Ward Method 20,4% 79,6% 100,0%
% within gender 100,0% 100,0% 100,0%
% of Total 20,4% 79,6% 100,0%
INDEPENDENT SAMPLES TEST
Numeric variables with normal distribution
Levene's Test for Equality
of Variances t-test for Equality of Means
95% Confidence Interval of the Difference
F Sig. t Df Sig.
(2-tailed)
Mean Difference
Std. Error
Difference Lower Upper
cow Equal variances assumed ,932 ,337 10,687 96 ,000 1,47367 ,13789 1,19996 1,74737
Equal variances not
F Sig. t Df Sig. (2-tailed)
Mean Difference
Std. Error
Difference Lower Upper
goat Equal variances assumed ,932 ,337 -10,687 96 ,000 -1,47367 ,13789 -1,74737 -1,19996
Equal variances not
assumed -10,941 92,624 ,000 -1,47367 ,13469 -1,74115 -1,20618
2.8% Equal variances assumed 8,344 ,005 -1,946 96 ,055 -,27985 ,14381 -,56531 ,00560
Equal variances not
assumed -2,124 90,929 ,036 -,27985 ,13179 -,54163 -,01807
3.2% Equal variances assumed ,509 ,477 2,947 96 ,004 ,40161 ,13629 ,13107 ,67214
Equal variances not
assumed 3,038 94,014 ,003 ,40161 ,13217 ,13917 ,66404
none Equal variances assumed 10,61
1 ,002 -5,977 96 ,000 -1,14655 ,19182 -1,52731 -,76579
Equal variances not
assumed -6,449 93,722 ,000 -1,14655 ,17780 -1,49959 -,79351
wild berries Equal variances assumed ,764 ,384 4,135 96 ,000 ,51899 ,12552 ,26983 ,76814
Equal variances not
assumed 4,273 94,369 ,000 ,51899 ,12146 ,27783 ,76015
PET pottle Equal variances assumed ,539 ,464 ,245 96 ,807 ,01143 ,04659 -,08106 ,10392
Equal variances not
assumed ,253 94,005 ,801 ,01143 ,04519 -,07829 ,10115
carton Equal variances assumed ,539 ,464 -,245 96 ,807 -,01143 ,04659 -,10392 ,08106
Equal variances not
assumed -,253 94,005 ,801 -,01143 ,04519 -,10115 ,07829
1 litre Equal variances assumed ,765 ,384 -3,402 96 ,001 -,23466 ,06898 -,37158 -,09773
Equal variances not
assumed -3,440 89,614 ,001 -,23466 ,06821 -,37019 -,09913
0.2 litre Equal variances assumed 3,383 ,069 4,099 96 ,000 ,27198 ,06635 ,14028 ,40368
Equal variances not
assumed 4,264 95,234 ,000 ,27198 ,06379 ,14535 ,39862
MANN-WHITNEY U TEST STATISTICSa
Numeric variables that do not have
normal distribution Wilcoxon W Z Asymp. Sig. (2-tailed)
age 874,000 1735,000 -2,209 ,027
milk frequency 847,500 1550,500 -,857 ,391
yoghurt frequency 865,000 1726,000 -2,368 ,018
food spending 1081,000 2734,000 -,657 ,511
Imlek 805,000 2458,000 -2,618 ,009
Mlekara Subotica 937,500 2590,500 -1,664 ,096
Somboled 1070,500 1931,500 -,706 ,480
Mlekara Sabac 842,000 1703,000 -2,352 ,019
0% 792,000 2445,000 -2,712 ,007
0.5% 1071,000 2724,000 -,702 ,482
1.5% 731,000 1592,000 -3,151 ,002
strawberry 871,500 2524,500 -2,139 ,032
apricot 582,500 2235,500 -4,221 ,000
sour cherry 1098,000 2751,000 -,508 ,612
none 1001,000 1862,000 -1,207 ,228
probiotic 879,500 2532,500 -2,082 ,037
immuno 1125,000 1986,000 -,313 ,754
present 1125,000 1986,000 -,313 ,754
none 1125,000 2778,000 -,313 ,754
½ litre 1154,500 2015,500 -,101 ,920
Ranks
Ward Method N Mean Rank Sum of Ranks
age 1 41 42,32 1735,00
2 57 54,67 3116,00
Total 98
yoghurt frequency 1 41 42,10 1726,00
2 57 54,82 3125,00
Total 98
References
Beardsworth, A., Bryman, A., Keil, T., Goode, J., Haslam, C., & Lancashire, E. (2002). Women, Men and Food: The Significance of Gender for Nutritional Attitudes and Choices. British Food Journal, 104(7), 470-491. http://dx.doi.org/10.1108/00070700210418767
Bhaskaran, S., & Hardley, F. (2002). Buyers Beliefs, Attitudes and Behaviour: Foods With Therapeutic Claims. Journal of Consumer Marketing, 19(7), 591-606. http://dx.doi.org/10.1108/07363760210451410
Childs, N. M., & Poryzees, G. H. (1998). Food that Help Prevent Desease: Consumer Attitudes and Public Policy Implications. British Food Journal, 100(9), 419-426. http://dx.doi.org/10.1108/00070709810247825
Delarue, J., & Loescher, E. (2004). Dynamics of Food Preferences: A Ccase Study with Chewing Gums. Food Quality and Preference, 15(7-8), 771-779. http://dx.doi.org/10.1016/j.foodqual.2003.11.005
Diplock, A. T., Aggett, P. J., Ashwell, M., Bornet, F., Fern, E. B., & Robertfroid, M. B. (1999). Scientific Concepts of Functional Foods in Europe: Consensus Document. British Journal of Nutrition, 81(suppl. 1), S1-S27.
Djokic, N., Salai, S., & Mesaros, I. (2012, September). Approaches to Organic Produce Market Segmentation. Paper Presented at the 1st WSEAS International Conference on Economics, Political And Law Science (EPLS '12), Zlin, The Czech Republic
Drewnowski, A., & Hann, C. (1999). Food Preferences and Reported Frequencies of Food Consumption as Predictors of Current Diet in Young Women. American Journal of Clinical Nutrition, 70(1),28-36.
Elrod, T., Louviere, J., & Davey, K. S. (1992). An Empirical Comparison of Ratings-Based and Choice-Based Conjoint Models. Journal of Marketing Research, 29(3), 368-377. http://dx.doi.org/10.2307/3172746
Everitt, B. S., Landau, S., & Leese, M. (2001). Cluster Analysis. London: Arnold.
FOCUS-BALKANS (2010). Study Report on Consumer Motivations and Behaviours for Products with Health Claims. Belgrade: FOCUS-BALKANS, Food Consumer Sciences in the Balkans
Gore, P. A. (2000). Cluster Analysis. In H. E. A. Tinsley & S. D. Brown (Eds.), Handbook of Applied Multivariate Statistical and Mathematical Modeling (297-321). New York: Academic Press
Green, P. E., & Srinivasan, V. (1978). Conjoint Analysis in Consumer Research: Issues and Outlook. Journal of Consumer Research, 5(2), 103-123. http://dx.doi.org/10.1086/208721
Green, P., Krieger, A., & Wind, J. (2004). Thirty Years of Conjoint Analysis: Reflection and Prospects. In Y. Wind, & P. Green (Eds.), Marketing Research and Modeling: Progress and Prospects. (117-141). Berlin: Springer Verlag. Gustafsson, A., Herrmann, A., & Huber, F. (eds.) (2007). Conjoint Measurement: Methods and Applications. Berlin:
Springer Verlag. http://dx.doi.org/10.1007/978-3-540-71404-0
Honkanen, P. (2010). Food Preference Based Segments in Russia. Food Quality & Preference, 21(1), 65-74. http://dx.doi.org/10.1016/j.foodqual.2009.08.005
Honkanen, P., Olsen, S. O., & Myrland, Ø. (2004). Preference-Based Segmentation: A Study of Meal Preferences Among Norwegian Teenagers. Journal of Consumer Behaviour, 3(3), 235-250. http://dx.doi.org/10.1002/cb.137
Hughner, R. S., McDonagh, P., Prothero, A., Shultz, C. J. & Stanton, J. (2007). Who are Organic Food Cconsumers? A Compilation and Review of why People Purchase Organic Food. Journal of Consumer Behaviour, 6(2-3), 1-17. http://dx.doi.org/10.1002/cb.210
Jobber, D., & Fahy, J. (2006). Osnovi Marketinga. Beograd: Data Status
Kardes, F. R. (1999). Consumer Behaviour: Managerial Decision Making. Reading, M.A.: Addison-Wesley.
Kim, R. B. (2012). Consumer Attitude of Risk and benefits Toward Genetically Modified (GM) foods in South Korea: Implications for Food Policy. Inzinerine Ekonomika-Engineering Economics, 23(2), 189-199.
Krystallis, A., Maglaras, G., & Mamalis, S. (2008). Motivations and Cognitive Structures of Consumers in their Purchasing of Functional Food. Food Quality and Preference, 19(6), 525-538. http://dx.doi.org/10.1016/j.foodqual. 2007.12.005
Kuzmanovic, M. (2004, September). Razvoj Poslovnih Resenja pomocu conjoint analize. Paper Presented at the IX International Simposium Management – the key Factors of Success - SymOrg, Zlatibor, The Republic of Serbia Moore, W. L. (2004). A Cross-Validity Comparison of Rating-Based and Choice-Based Conjoint Analysis Models.
International Journal of Research in Marketing, 21(3), 299-312. http://dx.doi.org/10.1016/j.ijresmar.2004.01.002 Olsen, S. O., Prebensen, N., & Larsen, T. A. (2009). Including Ambivalence as a Bases for Benefit Segmentation: A Study
of Convinience Food in Norway. European Journal of Marketing, 43(5), 762-783. http://dx.doi.org/10.1108/030 90560910947034
Quinn, L., & Dibb, S. (2010). Evaluating Market-Segmentation Research Priorities: Targeting Re-Emancipation. Journal of Marketing Management. 26(13-14), 1239-1255. http://dx.doi.org/10.1080/0267257X.2010.523010
Salai, S., & Bozidarevic, D. (2009). Marketing istrazivanje. Subotica: Ekonomski fakultet Subotica
Shimizu, T. (2003). Health claims and scientific substantiation of functional foods–Japanese system aiming the global standard. Current Topics in Nutraceutical Research, 1(2), 1-12.
Smith, W. R. (1956). Product Differentiation and Market Segmentation as Alternative Marketing Strategies. Journal of Marketing. 21(3), 3-8. http://dx.doi.org/10.2307/1247695
Tourila, T., & Cardelo, A. V. (2002). Consumers Responces to an off Flavour in Juice in the Presence of Specific Health Claims. Food Quality and Preference, 13(7-8), 561-569. http://dx.doi.org/10.1016/S0950-3293(01)00076-3
Verbeke, W. (2006). Functional Foods: Consumer Willingness to Compromise on Taste to Health. Food Quality and Preference, 17(1-2), 126-131. http://dx.doi.org/10.1016/j.foodqual.2005.03.003
Vriens, M., Wedel, M., & Wilms, T. (1996). Metric Conjoint Segmentation Methods: a Monte Carlo Comparison. Journal of Marketing Research, 33(1), 73-85. http://dx.doi.org/10.2307/3152014
Wedel, M. & Kamakura, W. A. (2002). Introduction to the Special Issue on Market Segmentation. International Journal of Research in Marketing, 19(3), 181-183. http://dx.doi.org/10.1016/S0167-8116(02)00075-7
Wedel, M., & Kamakura, W. A. (1998). Market Segmentation: Conceptual and Methodological Foundations. London: Kluwer Academic Publishers.
Wilson-Jeanselme, M., & Reynolds, J. (2006). The Advantages of Preference-Based Segmentation: An Investigation of Online Grocery Retailing. Journal of Targeting, Measurement and Analysis for Marketing, 14(4), 297-308. http://dx.doi.org/10.1057/palgrave.jt.5740190
Wind, Y. (1978). Issues and Advances in Segmentation Research. Journal of Marketing Research, 15(3), 317– 337. http://dx.doi.org/10.2307/3150580
Yankelovich, D. (1964). New Criteria for Market Segmentation. Harvard Business Review. 42(2), 83-90.
Yankelovich, D., & Meer, D. (2006). Rediscovering Market Segmentation. Harvard Business Review, 84(6), 141-145. http://www.crier.rs
http://www.sawtoothsoftware.com/download/techpap/caexcel.pdf
Nenad Djokic, Suzana Salai,Ruzica Kovac-Znidersic, Ines Djokic, Gordana Tomic
Jungtinės ir klasterinės analizės, skirtos preferencijų pagrįstam rinkos segmentavimui, naudojimas
Santrauka
Rinkos segmentavimas reiškia rinkos suskirstymą į mažesnes dalis. Segmentai nėra homogeninės vartotojų grupės, natūraliai atsirandančios rinkoje. Jos būna nustatytos rinkodaros vadybininko strategine nuožiūra. Rinkos segmentavimas yra strateginio marketingo dalis. Ją sudaro tikslinės rinkos nustatymas ir pozicionavimas, prieš kuriuos eina marketingo tyrimas, o paskui marketingo komplekso (produkto, kainos, paskirstymo ir rėmimo) kūrimas, įdiegimas bei kontrolė.
Rinkos segmentavimo sąvoka vadybininkams pasirodė ne tik naudinga, bet ir įdomi akademiniams tyrimams atlikti. Klausimai, kurie buvo aktualūs daugiau nei tris dešimtmečius ir susiję su rinkos segmentavimu (valdymo aktualumas ir įgyvendimas, rinkos segmetavimo kintamieji, kintamųjų pasirinkimas, rinkos segmentavimo našumo patikimumas), yra aktualūs ir iki šių dienų, tik su tam tikrais pakeitimais kalbant apie nurodytų klausimų prioritetų vietą. Vienas iš aktualių klausimų, kuris laikomas pagrindine problema ir skirtas šiam darbui: preferencijų pagrįsto rinkos segmentavimo tyrimas. Daugelis tikslų, susijusių su nurodyta problema, yra nustatyti. Visų pirma, kalba eina apie adekvačios metodikos, kuria nurodytas segmentavimas galėtų būti apibrėžtas šiame darbe, t. y. reitingais pagrįstos jungtinės analizės, (kartu su klasterine analize), naudojimo pristatymas ir
demonstravimas. Be jau anksčiau tirtų dalykų, šiame darbe numatyti ir apibrėžti kiti darbo tikslai: ištirti nurodyto metodo galimybes, pranašumus ir
išsiaiškinti vartotojų jogurto pirkimo įpročius Serbijos respublikoje. Rezultatai buvo paskelbti 2011 ir 2012 metais „Progressive Magazin“ leidinyje. Darbo autoriai konsultavosi dėl jogurto savybių ir jų lygmenų parinkimo su pieno produktų pramonės atstovais. Pateiktas klausimynas turėjo ir tam tikrų klausimų, susijusių su respondentų sociodemografinėmis, psichografinėmis ir elgsenos charakteristikomis. Nurodyti klausimai susiję su respondentų amžiumi ir lytimi, gyvenimu studijavimo metu, pieno ir jogurto vartojimo dažnumu, taip pat pinigų suma, kurią išleidžia maistui kiekvieną mėnesį.
Sudarant klausimyną, konsultuotasi su daugeliu kitų ekspertų, kurie išmano rinkodaros tyrimus. Atlikto preliminaraus tyrimo metu, kuriame dalyvavo 32 studentai, paaiškėjo, kad kai kuriuos klausimus reikia naujai suformuluoti. Vėliau tyrimas buvo atliktas 2012 metų gegužės mėnesį. Daugelis asistentų, kurie dėsto Novi Sad universitete, padalino studentams klausimynus paskaitos pabaigoje ir paprašė juos grąžinti užpildytus po pertraukos, trunkančios apie 1 valandą. Studentams buvo paaiškinta, kad tokiu būdu yra skatinama naudotis rinkodaros tyrimo metodu, kuris beveik nenaudojamas vietinėse sąlygose. Skatinant studentus domėtis rinkodara, jiems buvo pasiūlyta, po klausimyno užpildymo, dalyvauti specialiai organizuotoje paskaitoje, kurios metu jie galėtų daugiau sužinoti apie minėtą metodą. Respondentų buvo paprašyta, kad jie įvertintų preferenciją, teikiamą kiekvienam pavieniam, pasiūlytam jogurto savybių ir jų lygmenų deriniui, nuo 0 (jogurto preferencijos mažiausias lygis) iki 10 (aukščiausias lygis). Buvo išdalinta 250 klausimynų, grąžinta 123. Eliminavus respondentų klausimynus, kurie nevartoja pasirinkto produkto arba kurių preferencijos visiems pasiūlytiems produktams įvertintos vienodai, liko 98 klausimynai, kurie buvo įtraukti į galutinę analizę.
Atlikus apklausą nustatyta, kad didesnę įtaką, teikiant pirmenybę jogurtui, turi pieno rūšis, iš kurios jis gaminamas. Remiantis santykine jogurto preferencijos reikšme išskirtos šios savybės: vaisių buvimas, pieno riebumo sudėtis, gamintojas, tam tikra paskirtis, talpa. Tačiau pakuotės ir laktozės jogurte buvimas beveik vienodas ir jis turi mažiausią įtaką. Vėliau įtrauktos į analizę preferencijos, teikiamos pavieniam savybių lygmeniui. Tai galima nustatyti, palyginant naudingumo vertę visiems vienos savybės lygmenims. Remiantis rezultatais, galima daryti išvadą, kad „idealus jogurtas“ yra pagamintas iš karvės pieno, be vaisių, su 1,5 proc. pieno riebumu, „Imlek“ ženklo. Dar galima pridurti, kad visi repondentai ypač teikė pirmenybę jogurtui, neturinčiam atskiros paskirties, 1 litro talpos, be laktozės bei kartoninėje pakuotėje.
Remiantis bendro pavyzdžio rezultatais, naudojant klasterinę analizę bei remiantis teikiamoms preferencijoms pavieniams jogurto savybių lygmenims, nustatyti du segmentai. Vėliau, naudojant tam tikrus statistinius testus, buvo ištirti skirtumai tarp jų. Pirmą rinkos segmentą sudaro vartotojai, kurie laiko pačiu svarbiausiu aspektu tai, kad jogurtas būtų pagamintas iš kokybiško pieno. Antroje vietoje, (su daugiau nei tris kartus mažiausiu reikšmingumo lygmeniu) yra vaisiai jogurte. Taigi, skirtingai nuo visų ankstesnių respondentų rezultatų, vartotojai šiame rinkos segmente teikia pirmenybę vaisiniams jogurtams (pirmenybių seka pagal šios savybės lygmenis yra tokia: miško uogų skonio jogurtas, braškių skonio jogurtas, vyšnių skonio jogurtas, abrikosų skonio jogurtas ir pačioje sąrašo pabaigoje jogurtas be jokių papildomų skonių). Kita pagal reikšmę savybė yra susijusi su pieno riebumo procentu, kur pirmenybė teikiama 0,5 proc. pieno riebumo jogurtui, o tik paskui savybė susijusi su gamintoju, kur pirmenybė teikiama „Imlek“ gamintojo jogurtui. Antrą rinkos segmentą sudaro respondentai, kuriems trys savybės yra panašaus reikšmingumo lygmenio: vaisių buvimas jogurte, pienas, iš kurio pagamintas jogurtas, taip pat pieno riebumo procentas. Šios rinkos segmento vartotojai teikia pirmenybę nevaisiniam jogurtui, pagamintam iš karvės pieno ir turinčiam 1,5 proc. pieno riebumo. Mėgstamiausias šio segmento dalyvių jogurto gamintojas yra „Mlekara Šabac“, paskui „Somboled“, o „Imlek“ tik paskutinėje vietoje. Šios rinkos segmento vartotojai, kaip ir pirmo segmento, teikia pirmenybę jogurtui be tam tikros paskirties, be laktozės ir kartoninėje pakuotėje, nors šių savybių reikšmingumo lygmuo, lyginant su anksčiau išvardintu, yra santykinai mažesnis.
Kai į tyrimą įtraukiami sociodemografiniai ir elgesenos kriterijai, esantys klausimyne, nustatyta, kad skiriasi du rinkos segmentų dalyviai nuo kitų: vyresnis amžius, jį sudaro daugiau vyrų ir vartotojai, kurie priklauso šiam rinkos segmentui daug dažniau vartoja jogurtą. Gauti rezultatai yra paaiškinti panašiuose tyrimuose visame pasaulyje. Iš gautų rezultatų galima pastebėti ir tam tikras valdymo implikacijas. Taigi remiantis minėtais skirtumais, darbe pateikiamos konkrečios rekomendacijos pirmam, ir atitinkamai antram marketingo komplekso segmentui. Demonstruojant parinkto metodo naudojimą, galima pastebėti jo pranašumus, turint omenyje aktualių klausimų, susijusių su rinkos segmentavimu, aiškinimąsi. Šalia jau pasiūlyto ir parodyto valdymo aktualumo ir įgyvendimo, kuris laikomas vienu iš rinkos segmentavimo prioritetų, parodyta (ir tai klausimyne, kuriame palyginti mažai klausimų), kokie segmentavimo kintamieji yra svarbūs rinkos segmentų profiliavimo metu. Nurodytame pavyzdyje tai yra lytis, amžius bei jogurto vartojimo dažnumas (t. y. galimas rinkos segmentavimo kintamųjų nustatymas ir kintamųjų pasirinkimas). Įtraukiant papildomus klausimus bei didinant produktų skaičių, galima būtų apibendrinti kintamuosius, svarbius vartotojų preferencijoms. Lyginant maistą galima būtų sugeniruoti modelį, kuris apibūdintų veiksnius, turinčius įtaką vartotojų teikiamoms pirmenybėms (šiuo atveju maistui). Taip pat aiškiau nustatyti kintamuosius, kurie svarbūs tam tikroms produktų grupėms (teoriškai pagrįsti heterogeniškumą, turint tikslą nustatyti kintamuosius, kurie būtų įtraukti į modelius). Nurodytas metodas leidžia palyginti rezultatus skirtingu metu, skirtinguose pasaulio kraštuose ( t. y. leidžia suprasti dinaminę teikiamų pirmenybių savybę bei markeingo segmento sudedamąsias dalis). Taigi be to, kas pasakyta, lyginant įvykdyto pirkimo duomenis, leista ištirti faktorius, kurie užkerta kelią pereiti vartotojams iš emocinės fazės (teikiamos pirmenybės) į elgesio fazę (pirkimas) vartotojo elgsenoje.
Raktažodžiai: marketingo tyrimai, rinkos segmentavimas, rinkos segmentavimo kriterijai, preferencijų pagrįstas rinkos segmentavimas, jungtinė analizė,
klasterinė analizė.
The article has been reviewed.