Vol.8 (2018) No. 1
ISSN: 2088-5334
Experimental Study of Morphological Changes and Flow Structure
around the Vegetated Groyne
Pratiwi Aziz
#, Akihiro Kadota
* #Graduate School of Science and Engineering, Ehime University, 3, Bunkyo-cho, Matsuyama, 790-8577, Japan E-mail: [email protected]
*Department of Civil and Environmental Engineering, Ehime University, 3, Bunkyo-cho, Matsuyama, 790-8577, Japan E-mail: [email protected]
Abstract— There are many steep rivers in Japan, one of them is Shigenobu river, and the water pressure at the time of flooding is
severe. This study focuses on clarifying the vegetated groyne not only to prevent scouring and sedimentation problems but also to optimize for ecosystems and landscapes, which cuts the upper half of the existing groyne constructed and installs a permeable part at the top of it. In this research, investigation of the more efficient vegetated groyne was carried out. The vegetation has been represented as the wooden bar with setting various sizes (diameter of the wooden), changing the density of the vegetation part to be installed, with setting different conditions. The flow visualization and bed changes are the two components which analysed. The measurements in the laboratory flume were characterized by observation of flow structures with particle image velocimetry. The results show that the effect becomes vegetated groyne, the flow rate difference with the inner side of the river has been stabilized. Sediment accumulation and local scouring are reduced, and clearly, there is an effect of suppressing excessive scouring and sedimentation as compared with the existing groyne. With paying attention to the area ratio of the wood rod in the upper part of the groyne, the effect of suppressing riverbed fluctuation was more demonstrated when 1/5 than 1/10. Moreover, for the diameter of the wood stick, it was revealed that the vegetated groyne with the diameter of 8 mm and 5 mm exerts more effect than 10 mm.
Keywords— Flow visualization; morphological changes; vegetated groyne; Shigenobu river.
I. INTRODUCTION
Rivers are something related to the interests of many people and have been regarded as social goods from long ago. Various river maintenance managements have been carried out until now, to keep it in accordance with its function. The sedimentary content and the quality of water were influencing the condition of the river. There are three processes, erosion, transport and deposition that are interacting along the river from the upstream to downstream of the river. The velocity of water an important role in the erosion activity and sediment production, the velocity depends on the intensity of rainfall [1], [2]. The distribution of rainfall, the river discharge, flow rate and amount sediment production were interdependencies between each other. The river discharge rate was vital in the aspect of flood controls, stabilization or development of the river [1].
There are many steep rivers in Japan, one of them is Shigenobu river flowing through Matsuyama, Ehime. It makes the water pressure at the time of flooding to be severe. So, the groyne has been established as one of river construction methods against this severity. The characterized
rivers in Japan are considerably steep gradients due to the narrow and mountainous topography of the country.
Groyne is a river structure installed in a form protruding from the riverbank to reduce the flow velocity in the vicinity to the river and change the flow direction. On one side, the groynes enhance the velocity in the main channel. On the other hand, a slow flow zone during submerged flow conditions, or either dead zones in the region between the groynes during emerged conditions. This velocity difference leads to the formation of a mixing layer, exchange of mass and momentum between the groyne fields (slow), and the main channel (fast) takes place [3].
the existing groyne and making it permeable (vegetated), it is possible to achieve steep riverbed change. It prevents movement and stabilizes river channel, and leads into flood controllers at the time of flooding. Then, by leaving the lower part half, effects are expected as unchanging protection as in the case of normal water, and the effect of alleviating the flow when the water increase is expected. By cut down the water level of conventional concrete impermeable groyne and adding vegetation to the upper part, it's considered to be a river structure. Studies on the vegetated groyne and their development of effect on the flow and the structure have been improved with experimental and numerical. A. Kadota, T. Okamoto, M. Sanjou, H. Yokoyama, and Y. Shibayama (2016) studied the development of a turbulent flow structure around the vegetated groyne. The Particle Image Velocimetry (PIV) was used to measure the turbulence flow structure that conducted in open-channel flows. The impermeable groyne and vegetated groynes were compared to the variation of permeability. The results showed that the permeability of the groyne influence the distance of a peak in Reynold's stress that occurs behind the groyne. The value of Reynold's stress peaks at the crest height was increased, while the permeability was decreased [9].
A. N. Sukhodolov, T. A. Sukhodolova, and J. Krick (2016) examined that effects of riparian and aquatic vegetation on flow hydrodynamics in groyne fields with field experiments. The field experiments were conducted in a natural river comprising large-scale groyne models populated with rigid and flexible artificial vegetation. Vegetation alters a slight of hydrodynamics of the flow interface between the main river and the groyne field [10].
For examining the effect of the riverbed by the vegetated groyne, two of the model were installed in the experimental waterway. Visualization and riverbed change experiment is carried out. It's undertaken to compare and verify the difference in flow and riverbed variation. In this research, an investigation into more efficient vegetated groyne was done by changing the density of the vegetated part to be installed, and the size of the vegetated with setting various conditions. In the flow visualization experiment, measurements of the instantaneous flow velocity around the groyne model were conducted with the high-speed camera by using the particle tracking method (PTV method) which is one of the measurement methods of particle image and flow velocity. In the riverbed change experiment, measurements the riverbed before and after passing through the riverbed was conducted by using three laser displacement meters and considering the tendency of riverbed fluctuation in the vegetated groyne. In the present study, the function of the existing groyne, and the effect rectification of the river path which passes through in the Shigenobu river will be evaluated by comparing several experimental conditions. Finally, the evaluation of the experiment variation was also performed to investigate the optimal conditions of the vegetated groyne for stabilizing the riverbed.
II. MATERIAL AND METHOD
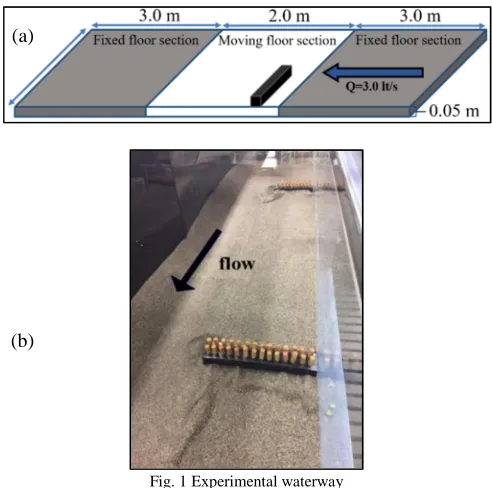
In this present study, a laboratory experiment was conducted. In this experiment, a linear open channel consisting of a waterway length of 8.0 m and a width of 0.5
m. A 3.0 to 5.0 m section from the upstream of the middle section of the waterway is set as a moving floor section with sand which average particle diameter d = 0.5 mm collected from scattered at the Shigenobu river estuary. A 0.0 to 3.0 m sections and at 5.0 to 8.0 m until the end of the waterway is rubbed. The plate was spread with h = 5.0 cm to make a fixed floor section. In addition, a groyne model was installed on the left bank side 3.4 m from the upstream with the flow rates Q = 3.0 l/s. The describing of the experimental waterway as shown in Fig. 1. After the flow and the bed condition stabilized from the start of running water, DETECT HAS -L2 was used for photographing. It captures 100 Hz continuous images for 20 seconds and acquires about 2000 images. To apply the PTV method, a laser light source (DPSS Green Laser GL - 800 mW) used as a slit light source in order to irradiate the particle image. Incense UH-1080 (average particle size 125 μm, specific gravity 0.915-0.96) was used as scattering particles of visualization. Before the experiment, mixing with water and ethanol was done. The mixing adjusts to the amount corresponding to the water. The photo of the movement of the particle was taken and makes visualization around the groyne model.
Fig. 1 Experimental waterway
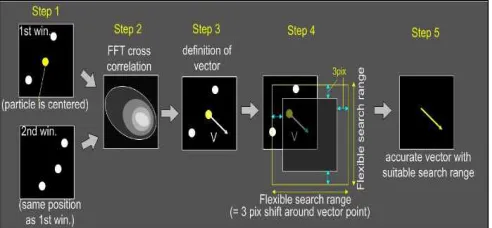
Particle Tracking Velocimetry (PTV), which is one of the particle image flow velocity measurement, is a method of automatically tracking the movement of scattering particles flowing in water in an image at a particular time interval and measuring the flow field. On the other hand, the Particle Image Velocimetry (PIV) is a method of defining arbitrary search regions in the first image from two particle images, retrieving a similar particle pattern from the second image by a direct cross-correlation method. Currently, the PTV method is positioned as one method of PIV method in the sense that flow velocity is measured from a particle image, but the point that high resolution can be measured by tracking individual particles is different from the PTV method. In this research, by taking advantage of these two methods used in PIV analysis, considering minimizing the disadvantages, a method of simultaneously using the FFT
(a)
cross-correlation method and the direct cross-correlation method is called a binary cross-correlation method and applied it to PTV analysis step of this research. First, image processing such as sliding, binarization, etc and determinations of each particle position are performed in the image subjected to the basic image processing (pre-processing). Then, the correlation calculation is started. Here, the temporary flow velocity field is first evaluated by the FFT method capable of high-speed. Calculation for two consecutive images, and this is used as the reference vector. By setting the search area from this reference vector and performing calculation only within the search area by the next calculation of direct cross-correlation, the useless search area is reduced, and effective direct cross-correlation function value is calculated. The step of the PTV analysis from two consecutive images can be described simply in Fig. 2.
Fig. 2 The step of PTV analysis in which particle movement is obtained from two consecutive images
The experimental models are shown in Fig. 3. Groyne model created (about 25.5 cm in length × 3.0 cm in height × 4.5 cm in width) based on the existing groyne near 6.3 km in Shigenobu river. In addition, a vegetated groyne model was newly made based on the constructed model. The height of this model is cut down 1 cm as the vegetation model at the top of the groyne, so that the height was set at 2 cm and a vegetated groyne model was created. The diameter of the wooden rod is set to 5 mm, 8 mm, 10 mm in case at equal intervals. Experiments are carried out under the conditions of Table 1 for each case, with the area of the upper part occupied by the transmission type vegetation being 1/5 and 1/10. The riverbed channels of Shigenobu River are sand and gravel. In normal water time, almost no running water is seen. At the time of flooding, the movement of gravel is greatly due to a steep river. When periods of rainfall are rarely observed for a long period of time, the expansion of the vegetation area in the sediment deposition occurs. In addition, the flow concentrates in the low waterway section which the water passage section. Besides that, the local scouring occurs due to the movement of the gravel, so the scouring of the river channel continues.
The riverbed was measured by the three laser displacement meters (KEYEMCE CMOS laser application sensor IL2000, IL600). In this measurement, the x and y coordinates, and the bed elevation z at the specific point will be provided. This equipment is setting freely on the flume to facilitate the measurement of x, y and z coordinates along the experimental waterway area. The laser displacement meter was moved manually, and the value was measured
from the riverbed was done. After measured the x, y and z coordinates at 20 points per second, save the values in Excel. Measurement data saved in, and a riverbed contour maps are created by collecting data in MATLAB.
Fig. 3 Experimental models
TABLEI EXPERIMENTAL CONDITION
Groyne model Flow condition
Wooden area at the top
Diameter of a stick wooden Impermeable
Groyne
Submerged - -
Emerged - -
Vegetated Groyne Submerged
1/10 5 mm 8 mm 10 mm 1/5 5 mm 8 mm 10 mm
III.RESULTS AND DISCUSSION
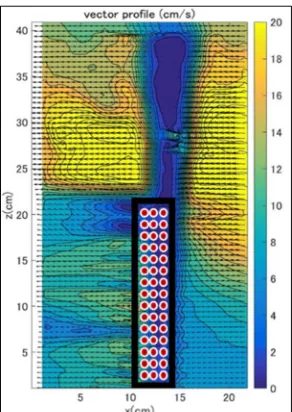
The mean flow structure is important to clarify for utilize the overall flow image and fundamental characteristics around the groyne. It will be clarified by flow visualization experiment around the groyne. In this section, the results from flow visualization experiment are shown by the distribution map of basic turbulence metrics such as the average flow velocity (vector profile), vorticity, and Reynold's stress, because these three things are very influential [4]. The result distribution maps of the average flow velocity vectors around the groyne in various experimental cases are shown in Fig. 4-Fig. 10.
the flow rate through the groyne is slower for the model with the larger area ratio of the wood stick.
Fig. 4 Distribution map of the average flow velocity for impermeable groyne in submerged conditions
Fig. 5 Distribution map of the average flow velocity for vegetated groyne with density 1/10, diameter 10mm
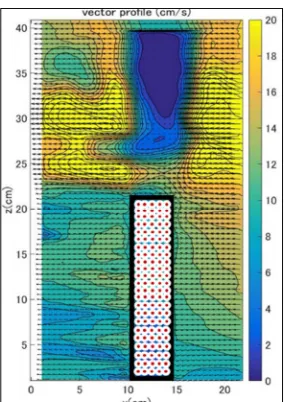
Fig. 6 Distribution map of the average flow velocity for vegetated groyne with density 1/5, diameter 10mm
Fig. 7 Distribution map of the average flow velocity for vegetated groyne with density 1/10, diameter 8mm
Fig. 8 Distribution map of the average flow velocity for vegetated groyne with density 1/5, diameter 8mm
Fig. 10 Distribution map of the average flow velocity for vegetated groyne with density 1/5, diameter 5mm
In addition, compared to the difference in the diameter of the wooden bars, the flow rate of the vegetated groyne models with diameters of 8 mm, and 5 mm is decelerating compared with a diameter of 10 mm. This is thought to be related to a decrease in shear stress, which causes extreme movement of the sediment transport. The high density of vegetation affects the velocity due to the turbulence intensities near bed changes and interfere main stream conditions [7].
The result distribution maps of vorticity around the groyne in various experimental cases are shown in Fig. 11-Fig. 17. The value of vorticity positive if the vortex is clockwise, and the value is negative if counterclockwise. In case of vorticity distribution of the impermeable groyne, it seems that a large vortex structure is formed behind the groyne. On the other hand, when observing the vorticity distribution of the vegetated groyne, apparently a substantial change occurs inside the groyne. In addition, there is a vortex of scouring occurs near the vegetated groyne due to the downward flow that is driven by the vegetation strength banks [6].
Fig. 11 Distribution map of vorticity for impermeable groyne in submerged conditions
Fig. 12 Distribution map of vorticity for vegetated groyne with density 1/10, diameter 10 mm
Fig. 13 Distribution map of vorticity for vegetated groyne with density 1/5, diameter 10 mm
Fig. 15 Distribution map of vorticity for vegetated groyne with density 1/5, diameter 8 mm
Fig. 16 Distribution map of vorticity for vegetated groyne with density 1/10, diameter 5 mm
Fig. 17 Distribution map of vorticity for vegetated groyne with density 1/5, diameter 5 mm
The vegetated groyne model with a small area ratio and a large diameter produces great vorticity or turbulence flow in the downstream. The flow moves into the vortex core makes the intensity of the turbulence is increases drastic. Getting closer the obstacle, the intensity slightly increased [11].
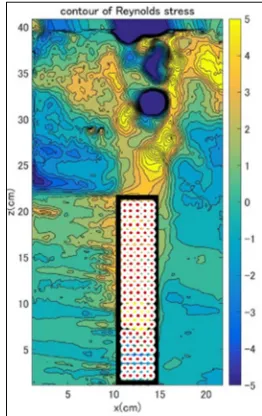
Next, the result distribution maps of Reynolds stress around the groyne in various experimental cases are shown in Fig. 18-Fig. 24. In the case of the impermeable groynes, the distribution in the downstream part near groyne clearly changes from the distribution at the groyne tip. On the other hand, when the vegetated groyne model is installed, along with the flow that permeates from the pile group, the negative shear stress is distributed on the left bank side of the downstream. These Reynolds stress profiles significant variable was similar that observed with E. M. Yager and M. W. Schmeeckle (2013) [7]. The positive peak value of Reynolds stresses is reached in the upstream, and a negative peak value is reached in the downstream of the vegetation. Moreover, generally, the Reynolds stress more negative around the vegetated groyne.
Fig. 18 Distribution map of Reynolds stress for impermeable groyne in submerged conditions
Fig. 20 Distribution map of Reynolds stress for vegetated groyne with density 1/5, diameter 10 mm
Fig. 21 Distribution map of Reynolds stress for vegetated groyne with density 1/10, diameter 8 mm
Fig. 22 Distribution map of Reynolds stress for vegetated groyne with density 1/5, diameter 8 mm
Fig. 23 Distribution map of Reynolds stress for vegetated groyne with density 1/10, diameter 5 mm
Fig. 24 Distribution map of Reynolds stress for vegetated groyne with density 1/5, diameter 5 mm
The experiment for bed variation was carried out under the same conditions of the flow visualization experiment. It was conducted at the same spot to investigate the relation to the flow visualization experiment. Water flow rates Q = 3.0 l/s is passed through this experimental waterway from the upstream for 30 minutes and riverbed fluctuation before and after water flow is measured.
remarkably performed because the flow velocity becomes fast due to the high descending flow. The picked-up sand is transported to the downstream side according to the flow in the scour hole, and as the scouring progresses, the sand of the upstream side collapses when the inclination of the scour hole exceeds the repose angle in water.
Fig. 25 Bed changes for impermeable groyne in submerged condition
Fig. 26 Bed changes for vegetated groyne with the density 1/10, diameter 10 mm
Fig. 27 Bed changes for vegetated groyne with the density 1/5, diameter 10 mm
Fig. 28 Bed changes for vegetated groyne with the density 1/10, diameter 8 mm
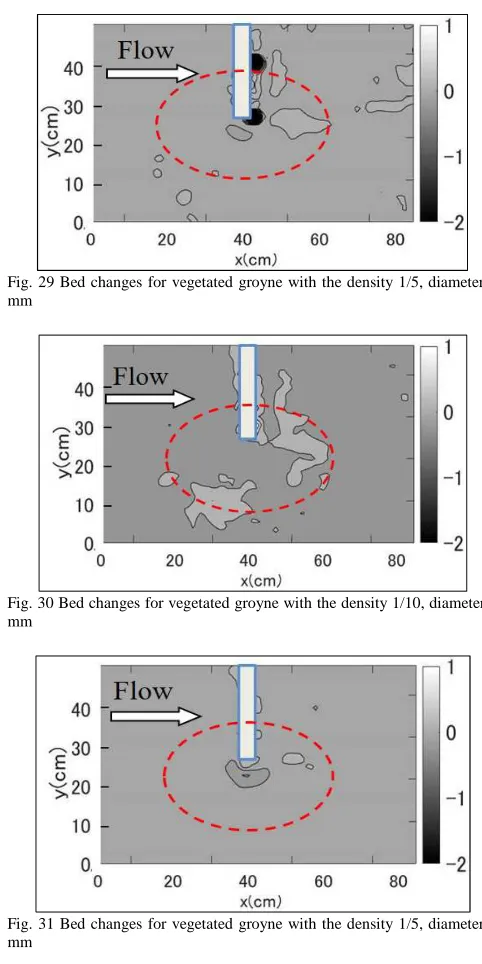
Fig. 29 Bed changes for vegetated groyne with the density 1/5, diameter 8 mm
Fig. 30 Bed changes for vegetated groyne with the density 1/10, diameter 5 mm
Fig. 31 Bed changes for vegetated groyne with the density 1/5, diameter 5 mm
From this, it is shown that the depth of scouring increases also in this experiment, which is related to the enlargement of the scour hole. Moreover, the sand of riverbed scoured around the groyne is transported to the downstream and accumulated from the back of the groyne to the downstream side. With the passage of time, the scour hole became larger, and the higher accumulated range and the maximum sediment height tended to increase as the transported riverbed sand collected correspondingly.
was through the resistance of the vegetation due to the the drag [10]. On the other hand, in regard to the difference in the density of the vegetated groyne, with same wood rod diameter, comparing the density of the wood rods occupying the upper part of the groyne, the riverbed fluctuation is suppressed for vegetation density was 1/5 compared 1/10, the flow velocity is decelerating. The variation of vegetation density is greatly affected the bed changes due to the significant structural differences [12]. Regarding the comparison of the results with the diameter of the wood rod, it can be seen that for a wood bar diameter of 10 mm, the deposition area and the washing hole are larger than the other 8 mm and 5 mm results. Regarding the vegetated groyne model with a diameter of 10 mm, the number of wooden rods in the vegetation part is of course fewer compared with the model with 8 mm and 5 mm, so the effect of flow velocity reduction is small.
IV.CONCLUSION
In this study, we surveyed the area around 6.2 - 6.4 km from the mouth of Shigenobu river where the scouring phenomenon of the river channels occurred. The experiment model was created by eliminating the top half of the existing groyne and set up a permeable section at those parts. The combination of both structures in the proposed model was called as the vegetated groyne. In order to carry out measures to stabilize river channels by suppressing sudden changes in flow, flow visualization and riverbed variation experiment are implemented. An analysis to identify the effect by introducing vegetated groyne for riverbed maintaining is conducted. In addition, when presenting a vegetated groyne, by evaluating the conditions of the optimal vegetated groyne for stabilizing the riverbed, aimed at focusing on the density of the vegetation part and the size of vegetation.
On the other hand, the vegetated groyne has the function of allowing water flow to flow down the groyne by adding transparency to the impermeable groyne. It has been confirmed that flow rate difference with the inner side of the river has been stabilized, and it is confirmed that sediment accumulation and local scouring are reduced, and clearly there is an effect of suppressing excessive scouring and sedimentation as compared with the existing groyne. With paying attention to the area ratio of the wood rod in the upper part of the groyne and the size of the vegetation, the effect of suppressing riverbed fluctuation was more demonstrated when 1/5 than 1/10. As to the diameter of the wood stick, it was revealed that the vegetated groyne with the diameter of 8 mm and 5 mm exerts more effect than 10 mm. In addition, from the results for the riverbed change
analysis, it was confirmed that the scouring depth and the deposition depth were smaller in the riverbed variation experiment, but the scouring range and the deposition range did it very similar.
Based on the above results, it is judged that there is an effect of suppressing an increase of local scouring of river channels around the vegetated groyne compared to the existing groyne (impermeable groyne). It is thought that riverbed remodelling effect can be expected. In addition, it is considered that the vegetated groyne is more effective when vegetation denseness becomes higher. As a future prospect, realizing the most efficient vegetated groyne is concretely considered. For that purpose, it is necessary to experiment in various cases, to improve the accuracy and to propose specific river channel management utilizing vegetated groyne.
REFERENCES
[1] N. A. Wahab, M. Khairul, A. Kamarudin, M. B. Gasim, R. Umar, F. M. Ata, and N. H. Sulaiman, “Assessment of Total Suspended Sediment and Bed Sediment Grains in Upstream Areas of Lata Berangin, Terengganu,” Int. J. Adv. Sci. Eng. Inf. Technol., vol. 6, no. 5, pp. 757–763, 2016.
[2] M. Khairul, A. Kamarudin, M. E. Toriman, N. A. Wahab, H. Rosli, M. Ata, M. Nazmi, and M. Faudzi, “Sedimentation Study on Upstream Reach of Selected Rivers in Pahang River Basin, Malaysia,” Int. J. Adv. Sci. Eng. Inf. Technol., vol. 7, no. 1, pp. 35–41, 2017. [3] M. F. M. Yossef and W. S. J. Uijttewaal, “On The Dynamics Of The
Flow Near Groynes In The Context Of Morphological Modelling,” in XXX IAHR Congress, 2003, pp. 361–368.
[4] T. Stoesser, G. P. Salvador, W. Rodi, and P. Diplas, “Large eddy simulation of turbulent flow through submerged vegetation,” Transp. Porous Media, vol. 78, no. 3 SPEC. ISS., pp. 347–365, 2009. [5] L. Zong and H. Nepf, “Spatial distribution of deposition within a
patch of vegetation,” Water Resour. Res., vol. 47, no. 3, 2011. [6] C.-L. Jang and Y. Shimizu, “Vegetation effects on the morphological
behavior of alluvial channels,” J. Hydraul. Res., vol. 45, no. 6, pp. 763–772, 2007.
[7] E. M. Yager and M. W. Schmeeckle, “The influence of vegetation on turbulence and bed load transport,” J. Geophys. Res. Earth Surf., vol. 118, no. 3, pp. 1585–1601, 2013.
[8] T. Fischer-Antze, T. Stoesser, P. Bates, and N. R. B. Olsen, “3D numerical modelling of open-channel flow with submerged vegetation,” J. Hydraul. Res., vol. 39, no. 3, pp. 303–310, 2001. [9] A. Kadota, T. Okamoto, M. Sanjou, H. Yokoyama, and Y.
Shibayama, “Development of vortex structure around vegetated groyne,” in River Flow 2016, 2016, pp. 2087–2093.
[10] A. N. Sukhodolov, T. A. Sukhodolova, and J. Krick, “Effects of vegetation on turbulent flow structure in groyne fields,” J. Hydraul. Res., vol. 55, no. 1, pp. 1–15, 2017.
[11] H. B. Kim and S. J. Lee, “Time-resolved velocity field measurements of separated flow in front of a vertical fence,” Exp. Fluids, vol. 31, no. 3, pp. 249–257, 2001.