and Esfhan Alam Kherani1
1National Institute for Space Research – INPE, Av. dos Astronautas, 1758, Jd. Granja-CEP: 12227-010 SJC, SP, Brazil 2Department of Space Geophysics, Institute of Geophysics and Astronomy – IGA, Calle 212, 2906, La Coronela, La Lisa, Havana, Cuba
3State Key Laboratory of Space Weather, National Space Science Center NSSC, Chinese Academy of Sciences (CAS), No. 1 Nanertiao, Zhongguancun, Haidian district, 100190, Beijing, China
Correspondence to:Siomel Savio Odriozola ([email protected])
Received: 30 July 2016 – Revised: 23 February 2017 – Accepted: 23 February 2017 – Published: 16 March 2017
Abstract. A two-stage VS-30 Orion rocket was launched from the equatorial rocket launching station in Alcântara, Brazil, on 8 December 2012 soon after sunset (19:00 LT), carrying a Langmuir probe operating alternately in swept and constant bias modes. At the time of launch, ground equip-ment operated at equatorial stations showed rapid rise in the base of the F layer, indicating the pre-reversal enhancement of the F region vertical drift and creating ionospheric con-ditions favorable for the generation of plasma bubbles. Ver-tical profiles of electron density estimated from Langmuir probe data showed wave patterns and small- and medium-scale plasma irregularities in the valley region (100–300 km) during the rocket upleg and downleg. These irregularities re-semble those detected by the very high frequency (VHF) radar installed at Jicamarca and so-called equatorial quasi-periodic echoes. We present evidence suggesting that these observations could be the first detection of this type of irreg-ularity made by instruments onboard a rocket.
Keywords. Ionosphere (equatorial ionosphere; plasma tem-perature and density; plasma waves and instabilities)
1 Introduction
Many ionospheric studies using rocket-borne probes have fo-cused their attention on nighttime equatorial plasma irregu-larities. A significant part of these studies has been devoted to the analysis of irregularities located at typical F region heights (e.g., Rino et al., 1981; LaBelle et al., 1986; Jahn and
LaBelle, 1998; Muralikrishna et al., 2004). Studies using in situ measurements of equatorial nighttime E region irregular-ities, however, are quite a few, as noted by Sinha et al. (2011). The lack of references is most noticeable when it comes to the intermediate region between the E and F layers (∼130– 300 km).
Although data from other studies show irregular structures in the electron concentration in the F valley region (Abdu et al., 1991; Vickrey et al., 1984; Sinha et al., 1999; Raizada and Sinha, 2000; Hysell et al., 2005; Muralikrishna and Abdu, 2006), up to now, only Vickrey et al. (1984) and Raizada and Sinha (2000) have analyzed the irregularities detected in this region. Both studies used measurements ob-tained using a Langmuir probe onboard rockets that flew in low-latitude trajectories.
Plasma irregularities located at typical E and F valley heights have been studied before using VHF radar observa-tions. Woodman and Chau (2001) were the first to character-ize irregular structures in E and lower F regions using obser-vations from the Jicamarca Radio Observatory (JRO). They used the term “Equatorial QuasiPeriodic” or EQP to label these irregular echoes.
414 S. Savio Odriozola et al.: Rocket observation of equatorial plasma irregularities
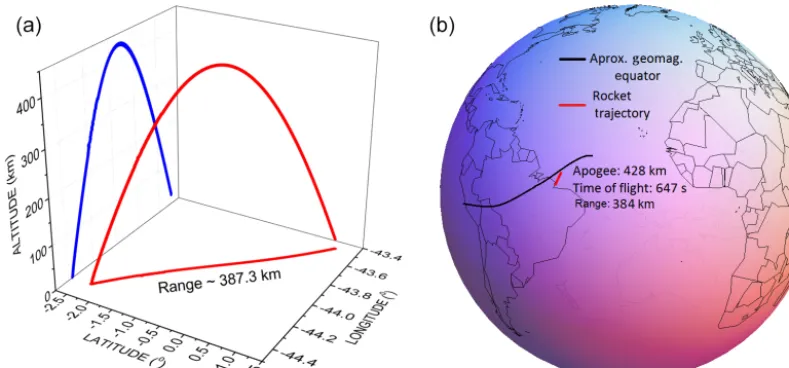
Figure 1.Rocket trajectory(a)and flight details(b). The blue parabola in(b)is the projection of the trajectory onto a vertical plane.
In the equatorial region over Brazil, a statistical study with observations made during 581 nights (from 2001 to 2008) was conducted by Kherani et al. (2012) using a low-power coherent scatter radar located at the São Luís equatorial sta-tion. Similar to the results of Woodman and Chau (2001), the structures were observed during occurrences of an ascending irregular bottom-type or bottom-side F layer and at the same time or prior to an ascending and well-developed plume. Fur-thermore, and unlike Jicamarca, the research showed that the frequency of occurrence of this type of irregularity was ex-tremely low and the few observations of such events were concentrated in summer months (Southern Hemisphere) and years of high solar activity.
In this work, the vertical distribution of electron density was obtained using a Langmuir probe as a payload of a two-stage rocket, which flew toward the magnetic equator from the rocket launching station in Alcântara, Brazil. Both the up-leg and downup-leg profiles, showed small- and medium-scale plasma irregularities in the intermediate region between the E and F layers. Given the characteristics of these profiles, in our results we propose that these irregularities are the EQP irregularities only detected, so far, by VHF coherent scatter radars. In the next section, the rocket flight and payload de-tails, ionosonde observations and Langmuir probe data will be presented. Later, our observations will be compared with a range time intensity (RTI) map previously obtained at Jica-marca Radio Observatory. We will conclude by summing up our results and considerations.
2 Observations 2.1 Rocket flight
As part of the Iguaiba operation, a two-stage VS-30 Orion rocket was launched from the equatorial rocket launching
station in Alcântara (CLA) located at 2.4◦S, 44.4◦W (dip latitude 5.5◦S), Brazil, on 8 December 2012 (LT=UT−3). The launch time (19:00 LT) was carefully selected in order to intercept irregular structures that might arise soon after sun-set. Flight parameters and the rocket trajectory are shown in Fig. 1.
As can be seen, the trajectory was toward the magnetic equator in the northeast. The horizontal range was∼384 km, and the apogee of the rocket reached typical F region alti-tudes (∼428 km). The flight was tracked by three radars over 647 s. The rocket carried three instruments: a two-axis mag-netometer, a GPS receiver prototype and a conical Langmuir probe (CLP). Data from a GPS receiver confirm the vehicle’s trajectory provided by the radars. From magnetometer data, it was possible to estimate the rotation (∼5 rps) and preces-sion (∼0.09 rps) of the rocket along the flight.
2.2 Digisonde observations
Ground stations located at São Luís (2.6◦S, 44.2◦W, dip lat-itude 6◦S) and Fortaleza (3.9◦S, 38.4◦W, dip latitude 15◦S) regularly probe the ionosphere using digisondes at the same time of rocket launch. São Luís station is located only 35 km south of CLA; therefore, it was used to monitor the ideal con-ditions (pre-launch rocket) that precede the bubble’s onset, while Fortaleza station is positioned∼684 km southeast of the launch center. Evidence of the presence of plasma irreg-ularities was observed in the ionograms of both stations.
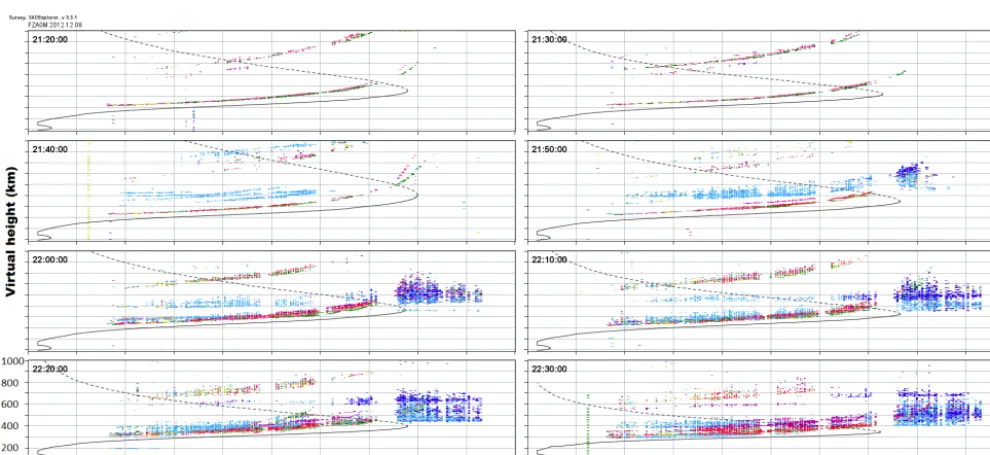
Figure 2.Sequence of ionograms taken on 8 December 2012 (18:20–19:30 LT) at São Luís. Spread F begins around 19:00 LT.
Figure 3.Sequence of ionograms taken on 8 December 2012 (18:20–19:30 LT) at Fortaleza. Spread F begins around 19:30 LT.
prior to the sunset. The spread F condition is evident in the ionograms for the rest of the night.
Figure 3 shows the ionograms obtained at Fortaleza simul-taneously with those appearing in Fig. 2. In this case the man-ifestation of a spread echo first appeared in a signal coming from the north-northeast (echoes in light blue color). Sig-nals vertical above Fortaleza station show a range spread F at 19:30 LT or 30 min after the appearance of the same con-dition at São Luís and the rocket’s launch. The rise ofh0minF
over Fortaleza is not as pronounced as that observed in São Luís.
[image:3.612.51.546.338.565.2]416 S. Savio Odriozola et al.: Rocket observation of equatorial plasma irregularities
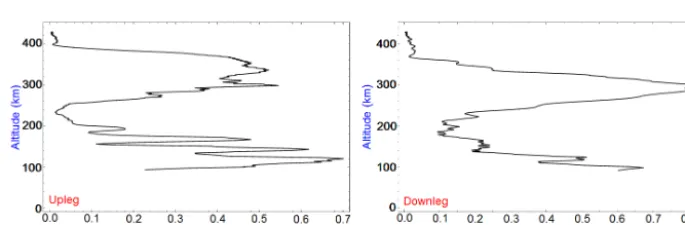
Figure 4.Electron density profiles obtained with a Langmuir probe data onboard a VS-30 Orion rocket on 8 December 2012, 19:00 LT.
2.3 Langmuir probe measurements
The Langmuir probe used in this experiment was mounted on the nose tip of the rocket and was able to operate alternately in swept and constant bias modes. During the swept mode, the bias applied to the probe was linearly increased from−1 to 2.5 V in 1.5 s and then maintained (constant bias mode) at 2.5 V for 1 s. The current collected by the probe during the constant bias mode is directly proportional to the local elec-tron density (Ne) and can be used to estimate theNe height profile. This current is filtered onboard in two bands: the low-pass filter, which limits the sample rate to∼250 Hz (referred to as DC), and the high-pass filter, which allows sample rates as high as∼2.2 kHz (referred to as AC). From the AC sig-nal, the probe could measure electron density irregularities in a wide range of scale sizes, depending on the velocity of rocket. For instance, at typical rocket velocities, the probe can detect fluctuations of up to 1 m at 150 km of altitude as well as up to 0.6 m at 316 km. TheNeheight profiles shown in Fig. 4 were obtained from the DC signal.
Between 100 and 300 km of altitude, several irregularities are visible in both the upleg and downleg. This type of ir-regularity is rarely found or discussed in the literature us-ing in situ measurements (e.g., Hysell et al., 2005; Vick-rey et al., 1984; Raizada and Sinha, 2000). During previ-ous rocket experiments over the Brazilian territory, only two experiments carried out in Natal (5.8◦S, 35.2◦W, dip lat-itude 12◦) showed a similar electron density vertical pro-file: one was a Javelin sounding rocket launched by NASA on 18 November 1973 at 21:22 UT (Vickrey et al., 1984); the second was a Sonda III rocket launched on 11 Decem-ber 1985 at 23:30 UT (Abdu et al., 1991). It is important to note that the trajectories of these rockets were off the geo-magnetic equator by more than 8◦.
Above 320 km the profiles do not show any depletion that can be identified as a plasma bubble, even though ionograms indicate the presence of large-scale irregularities. The most interesting features appear between 200 and 300 km during
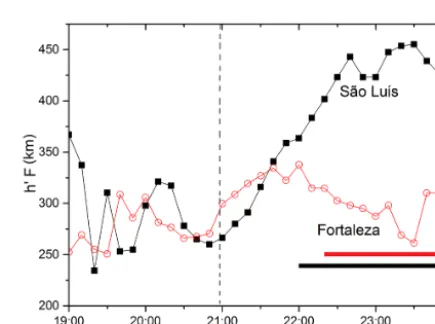
Figure 5. Upward and subsequent downward movement of the F layer observed at São Luís and Fortaleza during the flight of the rocket on 8 December 2012. The local sunset at São Luís repre-sented by the vertical dashed line. The local sunset at Fortaleza oc-curred∼24 min before São Luís. The red and black bars represent the range of time during which a spread F condition was observed in the ionograms taken at the Fortaleza and São Luís stations, re-spectively.
the downleg (Fig. 4b). TheNeheight profiles exhibit a wave vertical pattern with an apparent vertical wavelength of 20– 28 km. The altitude in which these irregularities appeared and the quasi-periodic nature of the irregularities in a height range typical of the valley region were the key features that motivated the comparative study presented in the next sec-tion.
3 Results and discussions
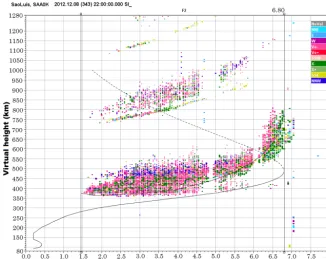
[image:4.612.317.535.266.428.2]Figure 6.Ionogram obtained at São Luís at 19:00 LT. The F peak height of theNevertical profile (black dashed line) was 474 km.
the solar terminator close to sunset hours. However, Bitten-court and Abdu (1981) showed that when the F layer height is above a threshold of 300 km, the apparent F layer verti-cal displacement velocity, inferred from ionosonde measure-ments, is the same as the vertical plasma drift velocity. The variation of the virtual height for both stations, depicted in Fig. 5, shows a rapid upward movement of the F layer at São Luís starting around 18:50 LT (21:50 UT) and during the lo-cal sunset. This movement continued well beyond the time of the launch and theh0minF reach a value of near 450 km. In Fortaleza, theh0minF ascent was neither very long nor abrupt. This is expected due to the separation from the magnetic equator of the two locations. Over São Luís, the geomagnetic field lines are more horizontal than over Fortaleza, and PRE in the vertical drift is more pronounced over locations with lower dip latitudes.
We can affirm that large-scale irregularities were settled at F region heights over Alcântara by the time of launch based on two facts: firstly, the PRE is related to the variation in conductivity along geomagnetic field lines between conju-gate regions and this has a direct relation with the develop-ment of equatorial irregularities. Secondly, from Figs. 2 and 3 we see that the spread F conditions first appeared over São Luís and then over Fortaleza, recalling that there is∼24 min time difference between the two locations.
In Fig. 6 we show a single ionogram over São Luís taken at the same time of the launch. The rocket could not reach the F peak at∼480 km, and therefore the plasma depletion eventually found above the F layer base was not detected by
the probe. Another aspect to be mentioned is that the irreg-ular structures detected by the probe and below 300 km do not appear in the ionograms. As noted by Woodman (2009), valley-type irregularities do not produce significant spread traces in ionograms. Additionally, after a careful inspection of ionograms in Fig. 2, it can be noted that the sounding fre-quencies start at 1.5 MHz in all of the cases. According to theNe height profile, represented in a black curve over the echoes in Fig. 6, the true height that corresponds with this minimum sounding frequency is around 280 km. The major-ity of irregularities detected by the Langmuir probe were be-low this altitude and could have produced echoes at frequen-cies below 1.5 MHz.
418 S. Savio Odriozola et al.: Rocket observation of equatorial plasma irregularities
Figure 7. Solar terminator and geomagnetic field lines projected onto the American sector map corresponding to the date and time of the observations made in Jicamarca(a)and Alcântara(b).
Before proceeding with the description of this compari-son, it is important to discuss the differences and similarities between the locations from which the data compared in this work were obtained. Both the Alcântara launch station and Jicamarca are located very close to the geomagnetic equa-tor, differing by magnetic declination and the geomagnetic secular variation, which are greater over Alcântara. This dif-ference in the angle of magnetic declination ultimately con-trols the seasonal occurrence of the conditions related with plasma bubble onset over the geomagnetic equator (Abdu et al., 1981). An alignment between the magnetic field line and the solar terminator favors the conditions for the growth of instabilities close to the geomagnetic equator. In Fig. 7, it can be seen that this alignment is similar in both Jica-marca (left panel) and Alcântara (right panel). This feature allowed us to assume that the conditions encountered by the rocket during its flight were similar to those present during the VHF radar observation. Although the RTI map and theNe height profile were obtained at longitudinally separated loca-tions and different times, the comparison can be carried out. As discussed at the end of this section and noted by Kherani et al. (2012) and Woodman and Chau (2001), the irregulari-ties that appear in the E and valley regions are closely related to bottom-type and top-side (plumes or bubbles) irregulari-ties.
Because we did not have the original RTI map, it was decided to work with gray levels of the color-inverted im-age from the paper of Woodman and Chau (2001) and cal-culate the levels of grayscale integrated at fixed heights in-side the shaded area in Fig. 8. The original RTI map presents the irregularities as a SNR, being the background noise the random signals generated by radio stars, i.e., the noise is not altitude dependent. The signal came from irregularities backscattering the waves emitted by the radar following the Bragg condition. In the case of Jicamarca, the scales of these irregularities are 3 m and can be assumed as tracers for intermediate- and large-scale structures in the plasma, whose boundaries are demarcated by the backscatter (Hysell, 2000). The SNR is represented in decibels, given the wide range of values that can have this ratio. Our representation
Figure 8.Rocket trajectory of the experiment conducted in Decem-ber 2012 superimposed over the color-inverted RTI map taken at Jicamarca in October 1993 (reproduced from Woodman and Chau, 2001). We assume that the shadowed region in faint blue represents the possible trajectories that may have had the rocket in a physical scenario similar to that measured at Jicamarca.
is a linearization of the original SNR and can be considered as an approximate picture of the physical scenario present at the time of the observations studied in Woodman and Chau (2001). The aim of this procedure is to catch the spatial dis-tribution (horizontal range or time in the RTI map; altitude) of the echoes (irregularities).
In our redefined grayscale of the original RTI map, a black color (gray level=0) represents the noise or a region with-out any plasma irregularities that might eventually produce a backscatter signal. Conversely, white regions (gray level=1) correspond to plasma irregularities and turbulent regions that provoke echoes measured by the radar. The area that was se-lected for the calculation of the integrated grayscale levels (faint blue in Fig. 8) represents all possible trajectories that may have shown the rocket in an ionosphere with a scenario similar to that reported by Woodman and Chau (2001) over Jicamarca.
[image:6.612.50.287.66.177.2]e
hNei. We consider that theNeprofile measured by the probe is a superposition of the average ionosphere and the fluctu-ations that eventually the presence of different irregularities along the rocket’s trajectory may cause.
As a purpose for our comparison,δNe was considered as the in situ analogue of the SNR obtained by the radar ob-servations in the sense that both data represent the spatial distribution of irregularities. In our in situ measurements we have such a distribution along the path of the rocket. This spatial distribution is observed in a narrow band as it passes above the radar, with a zonal plasma drift of∼110 m s−1in an eastward direction in the case of the VHF radar installed at Jicamarca. The main difference between these observational methods is that in the first case the instrument moves with such a velocity that it allows us to consider the plasma as be-ing at rest while the probe intersects different irregularities along the trajectory of the rocket. In the second case, the ir-regularities appear in the radar’s field of view as it moves in an eastward direction under quiet geomagnetic conditions.
The results appearing in Fig. 10 show a moving average of the Ne irregularity fluctuation profile (δNe) obtained in the manner explained above.
In order to make the comparison more straightforward, it was decided overlap the Figs. 9 and 10. The result is shown in Fig. 11.
In spite of comparing data obtained with different instru-ments and in different locations and time periods, the sim-ilarity of the two profiles is quite prominent. During the upleg part of the flight (Fig. 11, left panel), the integrated SNR from radar data decreases between 100 and 120 km be-cause the region measured by radar at Jicamarca is furthest from the equatorial electrojet. After this decrease, an absence of irregular structures appears in a range between 120 and 190 km in the original RTI map and as a consequence the in-tegrated grayscale levels reach their minimum values. Mean-while, successive depletions at∼130,∼160 and∼190 km (Fig. 4a), each being less pronounced than the previous one, are represented as three successive peaks in the left panels of Figs. 10 and 11. The last pick or increase in theδNe pro-file around 190 km has almost the same altitude as the first increase in the integrated grayscale levels, responding to the
striations is visible on the RTI map (Fig. 8). The grayscale changes from clear to dark regions alternately and the small fluctuations on the integrated grayscale levels over these re-gions observed in Figs. 9 and 11 are a direct consequence of this feature. These fluctuations resemble the wave-like part of theNeheight profile detected by in situ measurements during the downleg; depicted in Fig. 4b. TheδNeheight profile cal-culated from rocket data does not clearly show this behavior due to the smoothing process carried out to obtain the curves shown in Fig. 10. In this part of the profile, differing from the upleg part of the flight, the integrated grayscale levels are shifted to lower altitudes of about 20 to 60 km (depending on the altitude) in respect to the irregularity fluctuation profile from our in situ measurements.
Although the Langmuir probe onboard the rocket did not intercept any large-scale irregularities that could be associ-ated with a plasma bubble or a plume, the ionograms shown in Fig. 2 indicate that the irregularities found at altitudes be-low the base of the F layer appear simultaneously with irreg-ular F structures of larger scale (type and/or bottom-side F layer and plumes). This feature was observed in pre-vious studies carried out in Brazil (Kherani et al., 2012). In that work, it was noted that the slope of the valley-type ir-regularities, as observed on an RTI map, was proportional to the ascension rate of bottom-type and/or bottom-side F layer irregularities. This is easily recognizable from Fig. 8 for the case of Jicamarca.
According to Abdu et al. (2009) and Takahashi et al. (2010), the ascension rate of the type and/or bottom-side F layer is representative of the zonal electric field of F irregular structures under the modulation of wave-like distur-bance. This leads to numerous studies (e.g., Alam Kherani et al., 2004; Mukherjee and Patra, 2014; Kherani and Patra, 2015) aiming to understand the physical origin of this valley-type plasma irregularity through the possible link with the fringe field (polarization field) of F irregularities.
420 S. Savio Odriozola et al.: Rocket observation of equatorial plasma irregularities
Figure 9.Integrated grayscale levels of the modified RTI map shown in Fig. 8. Irregular structures are represented by higher integrated grayscale levels.
Figure 10. Irregularity fluctuation profile (δNe) obtained from the data collected by the Langmuir probe onboard the rocket. Irregular structures are represented by higher values ofδNe.
2004). Frequently, type-II E region irregularities are located at this altitude in the evening. Therefore, this structures could be the plasma source that is transported via eastward electric field, giving rise to the valley echoes detected in this study.
More recently, Kherani and Patra (2015) showed that the fringe field associated with large-scale irregularities pene-trates only within the bell of±5◦from the magnetic equator.
These features can explain why valley-type irregularities are not observed in the RTI maps from VHF radar observations at low latitudes (Patra and Venkateswara Rao, 2007; Mukherjee and Patra, 2014). Also, Kherani and Patra (2015) explained the electrodynamic origin of the asymmetries noted in the raising structures (Fig. 8) in the E and F valley regions. Previ-ous observations (Woodman and Chau, 2001; Kherani et al., 2012) show that the eastern rise of valley irregularities is more prominent compared with its western counterpart. Our results (see theNeheight profiles in Fig. 4) confirm this fact.
4 Conclusions
The in situ detection of valley-type irregularities has been presented and discussed. Using observations from digisondes installed at equatorial (São Luís, dip latitude=6◦S) and low-latitude (Fortaleza, dip low-latitude=15◦S) stations we were able to affirm that large-scale irregularities were present at F region heights during the launch of a two-stage rocket that carried a Langmuir probe as a payload. During its trajectory,
the rocket was able to intercept irregular plasma structures of small and medium scales located in intermediate regions between the E and F layers. We needed an observational ref-erence frame that would be able to explain our in situ obser-vations in the best possible way considering the scarcity of data. The key feature in our experiment (different from other observations using instruments onboard a rocket) was the al-titude at which these irregularities appeared and the quasi-periodic nature of the irregularities in a height range that has been previously detected in Jicamarca.
Knowing this, we compare the spatial distribution of irreg-ularities as observed by two different instruments: a Lang-muir probe installed as the payload of a rocket and a VHF radar operating at a different location but under the geomag-netic equator, similar to the rocket’s trajectory. Therefore, we do not attempt a pari passu comparison between VHF radar observation and Langmuir probe measurements. In this work, we constructed altitudinal profiles of plasma irregular-ities with the data obtained by these two instruments and then compared these profiles.
[image:8.612.127.470.217.330.2]The comparison leads us to conclude that the irregulari-ties detected in this work are signatures of irregulariirregulari-ties in the valley region previously labeled as Equatorial QuasiPeri-odic. The nature of the irregularities cannot be determined only from the rocket measurements; thus, simultaneous radar measurements are needed in order to enhance the conclusion validity about the nature of the electron density structures observed in our rocket measurements.
Attempts made so far using numerical simulations have been able to explain many properties of the irregular struc-tures detected in the present rocket experiment and also ob-served with VHF measurements. However, further numerical experiments need to be done to reproduce the quasi-periodic distribution of valley-type irregularities.
Data availability. The rocket data used in the present work are part of a very short database of in situ measurements. In order to be suitable for analysis, it demands an exhaustive step of data processing based on documentation as well as oral communica-tions not available to the general public. Moreover, these data are currently in use by INPE’s students in their PhD projects focused on other aspects of the experiment. An alternative for public accessibility of these data would also depend on a con-venient scientific database that could receive them in the future. The ionograms shown in Figs. 2, 3 and 6 can be visualized in http://www2.inpe.br/climaespacial/portal/ionosondes-home/ and requested by filling out the form below: http://www2.inpe.br/ climaespacial/SWMonitorUser/faces/register.xhtml, from where it is also possible to request the parameters shown in Fig. 5.
Competing interests. The authors declare that they have no conflict of interest.
Acknowledgements. The rocket experiments reported here were re-alized with the cooperation and help of the staff members of the following institutes:
– National Institute for Space Research – INPE, S.J.Campos, SP, Brazil.
– Space and Astronautics Institute – IAE/DCTA, S.J.Campos, SP, Brazil.
– Barreira do Inferno Launch Center – CLBI/DCTA, Natal, RN, Brazil.
– Alcântara Launch Center – CLA/DCTA, Alcântara, MA, Brazil.
Thank you to the CNPQ agency (Project: 870480/1997-9, Process: 140315/2014-4).
Siomel Savio Odriozola thanks the CNPQ agency for the PhD scholarship.
Francisco Carlos de Meneses acknowledges the support given by CAS Fellowship for Postdoctoral and Visiting Scholars from De-veloping Countries under grant number 201377GB0001 and CNPQ (312704/2015-1).
The topical editor, J. Makela, thanks the two anonymous refer-ees for help in evaluating this paper.
References
Abdu, M., Bittencourt, J., and Batista, I.: Magnetic declination con-trol of the equatorial F region dynamo electric field development and spread F, J. Geophys. Res.-Space, 86, 11443–11446, 1981. Abdu, M., Muralikrishna, P., Batista, I., and Sobral, J.: Rocket
ob-servation of equatorial plasma bubbles over Natal, Brazil, using a high-frequency capacitance probe, J. Geophys. Res.-Space, 96, 7689–7695, 1991.
Abdu, M. A., Alam Kherani, E., Batista, I. S., de Paula, E. R., Fritts, D. C., and Sobral, J. H. A.: Gravity wave initiation of equatorial spread F/plasma bubble irregularities based on observational data from the SpreadFEx campaign, Ann. Geophys., 27, 2607–2622, doi:10.5194/angeo-27-2607-2009, 2009.
Alam Kherani, E., De Paula, E. R., and Bertoni, F. C.: Effects of the fringe field of Rayleigh-Taylor instability in the equato-rial E and valley regions, J. Geophys. Res.-Space, 109, A12310, doi:10.1029/2003JA010364, 2004.
[image:9.612.125.469.67.185.2]422 S. Savio Odriozola et al.: Rocket observation of equatorial plasma irregularities
Chau, J. L. and Hysell, D. L.: High altitude large-scale plasma waves in the equatorial electrojet at twilight, Ann. Geophys., 22, 4071–4076, doi:10.5194/angeo-22-4071-2004, 2004.
de Paula, E., Kherani, E. A., Cueva, R., and Camargo, L.: Observa-tions of pre-midnight 5-m irregularities in the equatorial F region over São Luís, Brazil: Solar-flux dependence and seasonal varia-tions, J. Atmos. Sol.-Terr. Phy., 73, 1544–1554, 2011.
de Paula, E. R. and Hysell, D. L.: The São Luís 30 MHz coherent scatter ionospheric radar: system description and initial results, Radio Sci., 39, RS1014, doi:10.1029/2003RS002914, 2004. Hysell, D.: An overview and synthesis of plasma irregularities in
equatorial spread F, J. Atmos. Sol.-Terr. Phy., 62, 1037–1056, 2000.
Hysell, D. L., Larsen, M. F., Swenson, C. M., Barjatya, A., Wheeler, T., Sarango, M., Woodman, R. F., and Chau, J.: Onset conditions for equatorial spread F determined during EQUIS II, Geophys. Res. Lett., 32, L24104, doi:10.1029/2005GL024743, 2005. Jahn, J.-M. and LaBelle, J.: Rocket measurements of high-altitude
spread F irregularities at the magnetic dip equator, J. Geophys. Res.-Space, 103, 23427–23441, 1998.
Kherani, E. and Patra, A.: Fringe field dynamics over equatorial and low-latitude ionosphere: A three-dimensional perspective, J. Geophys. Res.-Space, 120, 6941–6947, 2015.
Kherani, E. A., de Paula, E., Cueva, R., and Camargo, L.: Obser-vations of nighttime equatorial-upper-E-valley region irregular structures from Sao Luis radar and their occurrence statistics: a manifestation of vertical coupling between E and F regions, J. Atmos. Sol.-Terr. Phy., 75, 64–70, 2012.
LaBelle, J., Kelley, M., and Seyler, C.: An analysis of the role of drift waves in equatorial spread F, J. Geophys. Res.-Space, 91, 5513–5525, 1986.
Mukherjee, S. and Patra, A.: Parallel plate capacitor analogy of equatorial plasma bubble and associated fringe fields with im-plications to equatorial valley region irregularities, J. Geophys. Res.-Space, 119, 6631–6641, 2014.
Muralikrishna, P. and Abdu, M. A.: Rocket measurements of iono-spheric electron density from Brazil in the last two decades, Adv. Space Res., 37, 1091–1096, 2006.
Muralikrishna, P., Vieira, L., and Abdu, M.: Experimental obser-vations of medium and small scale electrostatic waves associ-ated with ionospheric electron density fluctuations, Geofis. Int.-Mexico, 43, 173–186, 2004.
Patra, A. and Venkateswara Rao, N.: Low-latitude valley region ir-regularities studied using the Gadanki radar, J. Geophys. Res.-Space, 112, A03303, doi:10.1029/2006JA011857, 2007. Pimenta, A., Bittencourt, J., Fagundes, P., Sahai, Y., Buriti, R.,
Taka-hashi, H., and Taylor, M. J.: Ionospheric plasma bubble zonal drifts over the tropical region: a study using OI 630 nm emission all-sky images, J. Atmos. Sol.-Terr. Phy., 65, 1117–1126, 2003.
Raizada, S. and Sinha, H. S. S.: Some new features of electron den-sity irregularities over SHAR during strong spread F, Ann. Geo-phys., 18, 141–151, doi:10.1007/s00585-000-0141-8, 2000. Rino, C., Tsunoda, R., Petriceks, J., Livingston, R., Kelley, M., and
Baker, K.: Simultaneous rocket-borne beacon and in situ mea-surements of equatorial spread F-intermediate wavelength re-sults, J. Geophys. Res., 86, 2411–2420, 1981.
Rodrigues, F., De Paula, E., Abdu, M., Jardim, A., Iyer, K., Kintner, P., and Hysell, D.: Equatorial spread F irregular-ity characteristics over Sao Luis, Brazil, using VHF radar and GPS scintillation techniques, Radio Sci., 39, RS1S31, doi:10.1029/2002RS002826, 2004.
Savio, S., Muralikrishna, P., Batista, I., and de Meneses, F.: Wave structures observed in the equatorial F-region plasma density and temperature during the sunset period, Adv. Space Res., 58, 2043– 2051, 2016.
Sinha, H., Raizada, S., and Misra, R.: First simultaneous in situ measurement of electron density and electric field fluctuations during spread F in the Indian zone, Geophys. Res. Lett., 26, 1669–1672, 1999.
Sinha, H., Pandey, R., Sharma, S., and Misra, R.: Nighttime E re-gion plasma irregularities over an equatorial station Trivandrum, J. Atmos. Sol.-Terr. Phy., 73, 2444–2452, 2011.
Takahashi, H., Abdu, M. A., Taylor, M. J., Pautet, P.-D., de Paula, E., Kherani, E. A., Medeiros, A. F., Wrasse, C. M., Batista, I. S., Sobral, J. H. A., Gobbi, D., Arruda, D., Paulino, I., Vadas, S., and Fritts, D.: Equatorial ionosphere bottom-type spread F observed by OI 630.0 nm airglow imaging, Geophys. Res. Lett., 37, L03102, doi:10.1029/2009GL041802, 2010.
Vickrey, J. F., Kelley, M. C., Pfaff, R., and Goldman, S. R.: Low-altitude image striations associated with bottomside equatorial spread F: Observations and theory, J. Geophys. Res.-Space, 89, 2955–2961, 1984.
Woodman, R. F.: Spread F – an old equatorial aeronomy problem finally resolved?, Ann. Geophys., 27, 1915–1934, doi:10.5194/angeo-27-1915-2009, 2009.