Ann. Geophys., 31, 1559–1567, 2013 www.ann-geophys.net/31/1559/2013/ doi:10.5194/angeo-31-1559-2013
© Author(s) 2013. CC Attribution 3.0 License.
EGU Journal Logos (RGB)
Advances in
Geosciences
Open Access
Natural Hazards
and Earth System
Sciences
Open Access
Annales
Geophysicae
Open Access
Nonlinear Processes
in Geophysics
Open Access
Atmospheric
Chemistry
and Physics
Open Access
Atmospheric
Chemistry
and Physics
Open Access
Discussions
Atmospheric
Measurement
Techniques
Open Access
Atmospheric
Measurement
Techniques
Open Access
Discussions
Biogeosciences
Open Access Open Access
Biogeosciences
Discussions
Climate
of the Past
Open Access Open Access
Climate
of the Past
Discussions
Earth System
Dynamics
Open Access Open Access
Earth System
Dynamics
Discussions
Geoscientific
Instrumentation
Methods and
Data Systems
Open Access
Geoscientific
Instrumentation
Methods and
Data Systems
Open Access
Discussions
Geoscientific
Model Development
Open Access Open Access
Geoscientific
Model Development
Discussions
Hydrology and
Earth System
Sciences
Open Access
Hydrology and
Earth System
Sciences
Open Access
Discussions
Ocean Science
Open Access Open Access
Ocean Science
Discussions
Solid Earth
Open Access Open Access
Solid Earth
DiscussionsThe Cryosphere
Open Access Open Access
The Cryosphere
Natural Hazards
and Earth System
Sciences
Open Access
Discussions
Magnetic field and dynamic pressure ULF fluctuations in
coronal-mass-ejection-driven sheath regions
E. K. J. Kilpua1, H. Hietala2, H. E. J. Koskinen1,3, D. Fontaine4, and L. Turc4 1Department of Physics, P.O. Box 64, University of Helsinki, Finland
2Space and Atmospheric Physics Group, The Blackett Laboratory, Imperial College, London SW7 2AZ, UK 3Finnish Meteorological Institute, P.O. Box 503, Helsinki, Finland
4Laboratoire de Physique des Plasmas, Ecole Polytechnique, Route de Saclay 91128 Palaiseau, France
Correspondence to: E. K. J. Kilpua ([email protected])
Received: 3 March 2013 – Revised: 27 May 2013 – Accepted: 2 August 2013 – Published: 10 September 2013
Abstract. Compressed sheath regions form ahead of
inter-planetary coronal mass ejections (ICMEs) that are suffi-ciently faster than the preceding solar wind. The turbulent sheath regions are important drivers of magnetospheric ac-tivity, but due to their complex internal structure, relatively little is known on the distribution of the magnetic field and plasma variations in them. In this paper we investigate ul-tra low frequency (ULF) fluctuations in the interplanetary magnetic field (IMF) and in dynamic pressure (Pdyn) using a superposed epoch analysis of 41 sheath regions observed during solar cycle 23. We find strongest fluctuation power near the shock and in the vicinity of the ICME leading edge. The IMF andPdynULF power have different profiles within the sheath; the former is enhanced in the leading part of the sheath, while the latter is increased in the trailing part of the sheath. We also find that the ICME properties affect the level and distribution of the ULF power in sheath regions. For ex-ample, sheath regions associated with strong or fast ICMEs, or those that are crossed at intermediate distances from the center, have strongest ULF power and large variation in the power throughout the sheath region. The weaker or slower ICMEs, or those that are crossed centrally, have in general considerably weaker ULF power with relatively smooth pro-files. The strong and abrupt decrease of the IMF ULF power at the ICME leading edge could be used to distinguish the ICME from the preceding sheath plasma.
Keywords. Interplanetary physics (interplanetary magnetic
fields; solar wind plasma) – Space plasma physics (waves and instabilities)
1 Introduction
Coronal mass ejections (CMEs) are spectacular eruptions of solar plasma and magnetic field into the interplanetary space. When an interplanetary CME (ICME) moves super-magnetosonically with respect to the ambient solar wind, a fast forward shock develops ahead of it. The solar wind plasma and interplanetary magnetic field (IMF) are com-pressed at the shock and pile up in the front of the ICME to form a turbulent sheath region. It is now well established that ICME sheath regions cause intense magnetospheric storms (Tsurutani et al., 1988; Huttunen et al., 2002). The effect of sheath regions is particularly strong in the high-latitude mag-netosphere (Huttunen and Koskinen, 2004). There the rapid variations in the ionospheric current systems are associated with auroral displays and space weather hazards, such as ge-omagnetically induced currents in the pipelines and electric transfer systems (Huttunen et al., 2008).
It is likely that the turbulent structure of sheath regions contributes to their distinct geomagnetic effects. There is in-creasing evidence that fluctuations in the interplanetary mag-netic field (IMF) and in solar wind dynamic pressure (Pdyn) can have a substantial contribution to how solar wind energy transfers to the magnetosphere–ionosphere system and the global ionospheric and magnetospheric convection pattern. Kim et al. (2009) showed that the IMF north–south compo-nent (BZ) and Pdyn fluctuations in the ultra low frequency
(ULF) range can significantly influence the dayside iono-spheric convection. The solar wind ULF fluctuations have a clear effect also on the nightside plasma sheet dynamics and
structure as well as on the substorm occurrence (Lyons et al., 2009). In addition, Borovsky and Funsten (2002) demon-strated that the enhanced upstream IMF turbulence increases the momentum transfer from the magnetosheath into the magnetosphere, resulting in more stirring of the magneto-sphere and higher geomagnetic activity.
Previous studies have also shown that the upstream solar wind ULF fluctuations inPdynand IMF from a few minutes
to 10 min have a strong correlation with similar frequency range fluctuations in the magnetosphere (e.g., Kepko et al., 2005; Kessel et al., 2004; Kessel, 2010; Simms et al., 2008). In the magnetospheric context these waves are called Pc5 fluctuations. These fluctuations and their correlation with the upstream solar wind conditions have been studied intensively due to the importance of Pc5 waves in the energetic particle transport and energization of electrons to relativistic levels (e.g., Baker et al., 1998).
The internal structure of sheath regions is highly complex as they are composed of different layers of IMF and solar wind plasma that accumulate over the several days it takes for a CME to travel from the Sun to the Earth. The down-stream region close to the ICME-driven shock is known to have large amplitude magnetic field variations (e.g., Kataoka et al., 2005). However, relatively little is known on how the magnetic field and solar wind plasma fluctuations are dis-tributed within the sheath, and how they depend on the driver and shock properties.
The variations of the small-scale turbulence in the Earth’s magnetosheath from the bow shock to the magnetopause have been studied relatively extensively (e.g., Luhmann et al., 1986; Schwartz et al., 1996; Sahraoui et al., 2003; Lucek et al., 2005; Shevyrev et al., 2005; Yordanova et al., 2008), but there are distinct differences between the ICME sheaths and the planetary magnetosheaths (Kaymaz and Sis-coe, 2006; Siscoe and Odstrcil, 2008). As pointed out by (Kaymaz and Siscoe, 2006), the differences are likely at-tributed to the long history of accretion of inhomogenous IMF and plasma in ICME sheath regions. In addition, ICME sheath regions are a combination of a “propagation sheath” and an “expansion sheath” (Siscoe and Odstrcil, 2008): the former refers to the sheath that forms around an object prop-agating relative to solar wind, and the latter is due to an ex-panding object.
In this paper we investigate the level and distribution of IMF andPdynULF waves in ICME sheath regions using a superposed epoch analysis. We concentrate on the interval from 3 to 10 min, which approximately corresponds to the magnetospheric Pc5 range. We also group the events accord-ing to the driver ICME and shock characteristics. The paper is organized as follows. In Sect. 2 we present the methods and definitions used. In Sect. 3 we present our statistical re-sults, and in Sects. 4 and 5 we discuss and summarize our findings.
netospheric context these waves are called Pc5 fluctuations.
70
These fluctuations and their correlation with the upstream so-lar wind conditions have been studied intensively due to the importance of Pc5 waves in the energetic particle transport and energization of electrons to relativistic levels (e.g., Baker et al., 1998).
75
The internal structure of sheath regions is highly complex as they are composed of different layers of IMF and solar wind plasma that accumulate over the several days it takes for a CME to travel from the Sun to the Earth. The down-stream region close to the ICME-driven shock is known to
80
have large amplitude magnetic field variations (e.g., Kataoka et al., 2005). However, relatively little is known on how the magnetic field and solar wind plasma fluctuations are dis-tributed within the sheath and how they depend on the driver and shock properties.
85
The variations of the small-scale turbulence in the Earth’s magnetosheath from the bow shock to the magnetopause have been studied relatively extensively (e.g., Luhmann, Russell, and Elphic, 1986; Schwartz, Burgess, and Moses, 1996; Sahraoui et al., 2003; Lucek et al., 2005; Shevyrev et
90
al., 2005; Yordanova et al., 2008), but there are distinct dif-ferences between the ICME sheaths and the planetary mag-netosheaths (Kaymaz and Siscoe, 2006; Siscoe and Odstrcil, 2008). As pointed-out by Kaymaz and Siscoe (2006), the differences are likely attributed to the long history of
accre-95
tion of inhomogenous IMF and plasma in ICME sheath re-gions. In addition, ICME sheath regions are a combination of a ”propagation sheath” and an ”expansion sheath” (Siscoe and Odstrcil, 2008): the former refers to the sheath which forms around an object propagating relative to solar wind and
100
the latter is due to an expanding object.
In this paper we investigate the level and distribution of IMF andPdyn ULF waves in ICME sheath regions using a
superposed epoch analysis. We concentrate on the interval from 3 to 10 minutes, which approximately corresponds to
105
the magnetospheric Pc5 range. We also group the events ac-cording to the driver ICME and shock characteristics. The paper is organized as follows: In Section 2 we present the used methods and definitions. In Section 3 we present our statistical results and in Section 4 and 5 we discuss and
sum-110
marize our findings.
2 Data and methods
We use ACE 16-second Level 2 magnetic field data from MAG (Smith et al., 2008) and 64-second Level 2 plasma data from SWE (Ogilvie et al., 1995). The data are obtained
115
through CDAWeb. ACE is positioned at the Lagrangian point L1, roughly 1.5 million kilometers upstream from the Earth. The sheath events are selected using the ACE ICME cata-log maintained at the ACE Science Center. In the ACE cat-alog ICMEs are divided into three groups according to the
120
spacecraft closest approach distance from the ICME center
mid−sheath after
pre−shock post−shock pre−LE post−LE
4h
2h 1h 1h 1h 1h 4h 2h
7.8h
shock leading edge
before
stretched/compressed to
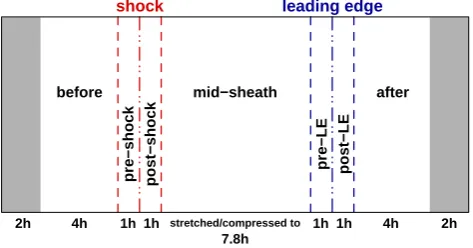
Fig. 1. The cartoon shows different regions and their durations used in this analysis. The red dashed line marks the shock and the blue dashed line indicates the ICME leading edge. The gray domains in the beginning and the end of the displayed region are the intervals that are included in the calculation of the wavelet spectrograms, but not included in the actual analysis.
(i.e., the impact parameter). This categorization (Jian et al., 2006) is based on the time variations of the total pressure (sum of the magnetic pressure and plasma thermal pressure) perpendicular to the magnetic field (P t) within the ICME:
125
In Group 1 theP tprofile has a central maximum, in Group
2 it has a plateau-like profile, and in Group 3 it has a grad-ual decrease after a sharp increase at the ICME leading edge. ICMEs in Group 1 are crossed close to the center, while for Group 2 and Group 3 the impact parameter from the center
130
increases (see the summary from Table 1). It is often diffi-cult to determine the leading edge time for Group 3 ICMEs (many Group 3 ICMEs in the ACE catalog lack the leading edge time), and therefore we include here only Group 1 and Group 2 events.
135
In total, our data set comprises 41 sheath regions observed during solar cycle 23 (1998 - 2006). The average duration of these sheath regions is 9.8 hours. The durations range from 3.1 hours to 28.1 hours with a standard deviation of 4.9 hours. We calculate the Morlet wavelet spectra from seven hours
140
before the shock to seven hours after the ICME leading edge. The cone of influence, determined by the wavelet analysis, is a region where the edge effects due to the use of finite length series become important. In this study we restrict to data outside the cone of influence. When we calculate the ULF
145
power spectra we exclude two hours from both ends of the initial interval.
To investigate the ULF fluctuation power within and close to the sheath regions we define seven domains that are sum-marized schematically in Figure 1. The regions are: before,
150
pre-shock, post-shock, mid-sheath, pre-LE, post-LE and af-ter, where LE stands for the (ICME) ”leading edge”. The before and after regions have duration of four hours and the pre-shock, post-shock, pre-LE, and post-LE regions last one hour.
155
The duration of the mid-sheath region varies from event to Fig. 1. The panel shows different regions and their durations used in this analysis. The red dashed line marks the shock, and the blue dashed line indicates the ICME leading edge. The gray domains in the beginning and the end of the displayed region are the intervals that are included in the calculation of the wavelet spectrograms, but not included in the actual analysis.
2 Data and methods
We use ACE 16 s level 2 magnetic field data from MAG (Smith et al., 2008) and 64 s level 2 plasma data from SWE (Ogilvie et al., 1995). The data are obtained through CDAWeb. ACE is positioned at the Lagrangian point L1, roughly 1.5 million kilometers upstream from the Earth.
The sheath events are selected using the ACE ICME cata-log maintained at the ACE Science Center. In the ACE cat-alog, ICMEs are divided into three groups according to the spacecraft closest approach distance from the ICME center (i.e., the impact parameter). This categorization (Jian et al., 2006) is based on the time variations of the total pressure (sum of the magnetic pressure and plasma thermal pressure) perpendicular to the magnetic field (P t) within the ICME: in Group 1 theP t profile has a central maximum, in Group 2 it has a plateau-like profile, and in Group 3 it has a gradual decrease after a sharp increase at the ICME leading edge. ICMEs in Group 1 are crossed close to the center, while for Group 2 and Group 3 the impact parameter from the center increases (see the summary from Table 1). It is often diffi-cult to determine the leading edge time for Group 3 ICMEs (many Group 3 ICMEs in the ACE catalog lack the leading edge time), and therefore we include here only Group 1 and Group 2 events.
In total, our data set comprises 41 sheath regions observed during solar cycle 23 (1998–2006). The average duration of these sheath regions is 9.8 h. The durations range from 3.1 to 28.1 h with a standard deviation of 4.9 h.
[image:2.595.310.547.64.188.2]E. K. J. Kilpua et al.: Magnetic field and dynamic pressure ULF fluctuations 1561
Table 1.P tcategorization according to Jian et al., 2006.
Group 1 Group 2 Group 3
[image:3.595.113.482.183.316.2]P tprofile central maximum plateau sharp increase, gradual decrease Impact parameter central encounter intermediate distance glancing encounter
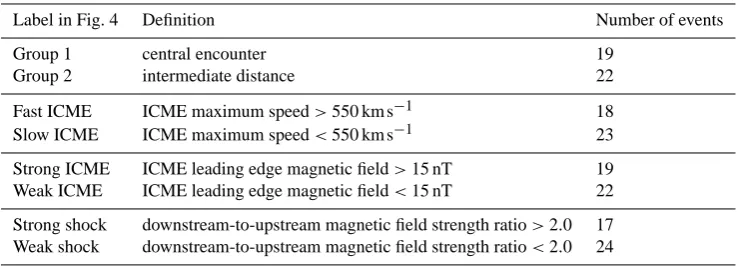
Table 2. Division of events with different criteria. The first column gives the name shown in Fig. 4, the second column the definition, and the last column the number of events with that criteria.
Label in Fig. 4 Definition Number of events
Group 1 central encounter 19
Group 2 intermediate distance 22
Fast ICME ICME maximum speed>550 km s−1 18
Slow ICME ICME maximum speed<550 km s−1 23
Strong ICME ICME leading edge magnetic field>15 nT 19 Weak ICME ICME leading edge magnetic field<15 nT 22
Strong shock downstream-to-upstream magnetic field strength ratio>2.0 17 Weak shock downstream-to-upstream magnetic field strength ratio<2.0 24
ULF power spectra we exclude two hours from both ends of the initial interval.
To investigate the ULF fluctuation power within and close to the sheath regions we define seven domains that are sum-marized schematically in Fig. 1. The regions are as follows: before, pre-shock, post-shock, mid-sheath, pre-LE, post-LE, and after, where LE stands for the (ICME) “leading edge”. The before and after regions have duration of four hours and the pre-shock, post-shock, pre-LE, and post-LE regions last one hour.
The duration of the mid-sheath region varies from event to event. For the superposed epoch analysis we stretch or com-press all mid-sheath regions to 7.8 h corresponding to the av-erage sheath duration of 9.8 h where the 1 h post-shock and pre-LE regions have been subtracted. Note that the stretching of ULF power has been done after the wavelet analysis.
We separate the aforementioned 1 h regions around the shock and the leading edge because these are the regions where important microscale physical processes are expected to take place (e.g., Schwartz et al., 1996; Lucek et al., 2005; Blanco-Cano et al., 2006; Yordanova et al., 2008; De-sai et al., 2011). We emphasize that these regions are not stretched/compressed or otherwise modified for the super-posed epoch analysis.
To examine how the ICME and shock properties affect the distribution and level of ULF fluctuation in the sheath, we divide our events with the following criteria (see Ta-ble 2) to (1) Group 1 and Group 2 events, (2) slow and fast ICMEs using the ICME leading edge speed, (3) strong and weak ICMEs using the ICME leading edge magnetic field,
and (4) strong and weak shocks using the downstream-to-upstream magnetic field strength ratio. Our choice to use magnetic field strength ratio instead of Mach number to es-timate the shock strength is based on large uncertainties that would be introduced when calculating the Mach num-ber from single spacecraft measurements with an algorith-mic approach for our statistical study. Further, magnetic field measurements are more accurate/reliable than plasma den-sity measurements.
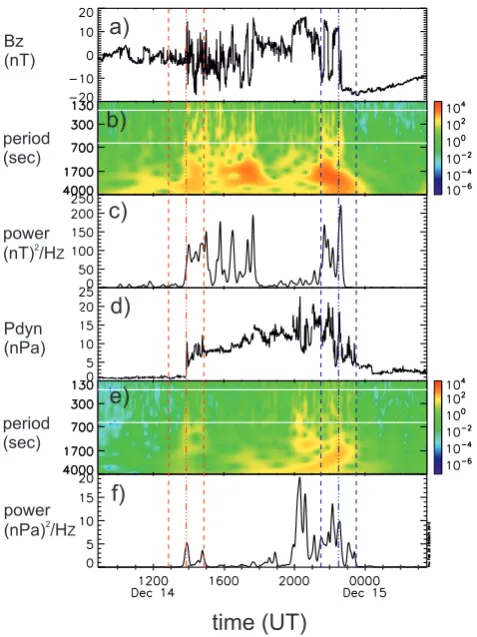
Figure 2 shows an example event that occurred on 14 De-cember 2006. The shock was observed at ACE on 14 ber at 13:52 UTC and the ICME leading edge on 14 Decem-ber, 22:30 UTC. For this ICME the leading edge magnetic field was 18.6 nT, and the leading edge speed 890 km s−1. According to the ACE ICME catalog this ICME was crossed at an intermediate distance from the center (Group 2). The duration of the mid-sheath region for the event shown in Fig. 2 is 5.6 h.
The wavelet spectrograms for the GSMBZ andPdyn are
shown in Fig. 2b and e, respectively. We use here GSM components because it is a natural coordinate system when investigating the solar wind interaction with the magneto-sphere. The pair of horizontal lines bounds the ULF range, and the fluctuation powers calculated in that range are shown in Fig. 2c and f, respectively. For the superposed epoch anal-ysis we calculate the wavelet spectrograms and the fluctua-tion power forBX andBY in the similar manner as forBZ.
Figure 2c shows that the BZ power was high in the
Bz (nT)
Pdyn (nPa) period (sec)
period (sec) power (nT)2
/HZ
a)
b)
c)
d)
e)
f)
time (UT)
power (nPa)2
[image:4.595.304.543.58.357.2]/HZ
Fig. 2. Example event on 14 December 2006. The panels show the following from top to bottom: (a) IMFZcomponent in GSM (BZ), (b) wavelet spectrogram forBZ, (c)BZULF power, (d) solar wind Pdyn, (e) wavelet spectrogram forPdyn, and (f)Pdyn ULF power.
The red dash-dotted line marks the shock, and the blue dash-dotted line the leading edge. The 1 h regions adjacent to the shock and the leading edge are bounded by the pairs of dashed lines. In panels (b) and (e) the pair of white lines bounds the 3 to 10 min frequency range we have used to calculate the ULF powers in panels (c) and (f).
the pre-LE region, after which it decreased sharply at the leading edge and remained low in the post-LE region and during the first hours of the ICME. In contrast, thePdynULF
power (Fig. 2f) was highest during the latter part of the mid-sheath and in the pre-LE region. Weaker enhancements were observed in the post-shock and post-LE regions.
3 Statistical results
3.1 Superposed epoch analysis
Figure 3 shows the results of the superposed epoch analysis for the IMF GSM components andPdyn. We see that the
vari-ations inBZandBY are roughly similar in different regions.
The largest power in the fluctuations is inBZ, while the
low-est fluctuation power is evidently inBX. In the following, we
Bx ULF Power (nT /Hz)2
Pdyn ULF Power (nPa /Hz)2
a)
b)
-5 0 +5 +10 +15 time from shock (hours)
c)
d)
By ULFPower (nT /Hz)2
[image:4.595.48.287.60.379.2]Bz ULF Power (nT /Hz)2
Fig. 3. The results of the superposed epoch analysis of the 41 stud-ied events. The curves show the median (black), and the upper (red) and lower (blue) quartiles for ULF power in (a)BX, (b)BY, (c)BZ, and (d)Pdynfluctuations. The red dash-dotted line shows
the shock, and the blue dash-dotted line the leading edge. The 1 h (non-stretched) regions adjacent to the shock and the leading edge are bounded by the pairs of dashed lines.
will useBZas the representative IMF component, but we will
note if there were clear differences in the characteristics be-tween different components. In Table 3 we also give quartile powers ofBZandPdynfluctuations in different regions. Due
to the behavior ofBZandPdynULF powers described below,
we have separated the mid-sheath region into the leading and trailing parts in Table 3.
We immediately notice that theBZULF power is
signifi-cantly higher throughout the sheath region when compared to the surrounding solar wind. The transition out of the sheath region is marked at both edges by strong and abrupt decrease in the fluctuation power. From Table 3 we also see that the
BZpower in the before, pre-shock, and after regions is lower
than in the other regions. Figure 3a and Table 3 show that theBZ ULF power peaks in the post-shock and pLE
re-gions. For the lower quartile power the strongest peak is in the pre-LE region. Note that for BY there is no obvious
peak for the upper quartile power in the pre-LE region, but it peaks strongly in the post-shock region. TheBZ power is
E. K. J. Kilpua et al.: Magnetic field and dynamic pressure ULF fluctuations 1563
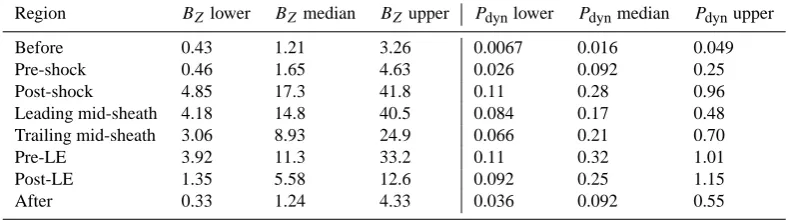
Table 3. The averages of the lower quartile, median, and upper quartileBZandPdynULF powers in different regions (see Fig. 1). Note that
we have separated here the mid-sheath into the leading and trailing sections. The units are (nT2Hz−1) and (nPa2Hz−1) for theBZandPdyn
ULF powers, respectively.
Region BZlower BZmedian BZupper Pdynlower Pdynmedian Pdynupper
Before 0.43 1.21 3.26 0.0067 0.016 0.049
Pre-shock 0.46 1.65 4.63 0.026 0.092 0.25
Post-shock 4.85 17.3 41.8 0.11 0.28 0.96
Leading mid-sheath 4.18 14.8 40.5 0.084 0.17 0.48
Trailing mid-sheath 3.06 8.93 24.9 0.066 0.21 0.70
Pre-LE 3.92 11.3 33.2 0.11 0.32 1.01
Post-LE 1.35 5.58 12.6 0.092 0.25 1.15
After 0.33 1.24 4.33 0.036 0.092 0.55
calculate that the power in the leading mid-sheath is 20, 45, and 68 % higher than in the trailing mid-sheath for the lower quartile, median, and upper quartile powers, respectively. It is also seen from Fig. 3 that all three power curves forBX
show considerably flatter profiles than forBY andBZ.
ThePdynULF power (Fig. 3b) is also strongly elevated in the sheath region when compared with the preceding solar wind. For the median and lower quartile curves (see also Ta-ble 3) the power decreases after the leading edge, but for the strongest events (red upper quartile curve), the power lev-els stay high throughout the front part of the ICME. Sim-ilar to BZ ULF power, the Pdyn ULF power peaks in the
post-shock and pre-LE regions, but in contrast, the trailing half of the mid-sheath has stronger Pdyn ULF power than
the leading half. While the lower quartile and median power are only slightly higher in the trailing part (Table 3), for the strongest events the power in the trailing part is 117 % higher than in the leading part. It is also seen from Table 3 that the lower quartile curve has a very flat distribution throughout the sheath. The large difference between the power levels of the upper quartile and median curves indicate that there were a few events with particularly strongPdyn ULF fluctuation power.
3.2 Effect of ICME/shock properties on sheath ULF fluctuations
We calculated the median and quartile curves ofBZandPdyn
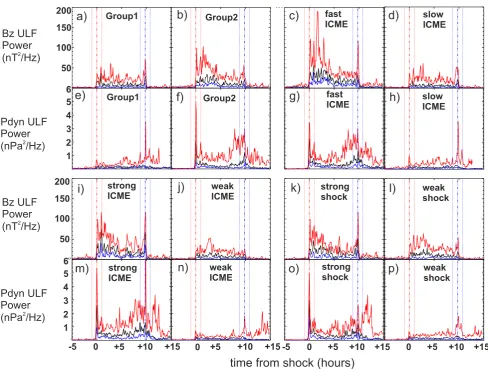
ULF power in each of the seven regions (Fig. 1) for different categories defined in Table 2. The results are shown in Fig. 4. First, let us compare the level of power in the different categories (Table 2). We see that fast or strong ICMEs are associated with much higher ULF power both forPdyn and BZthan slow or weak ICMEs. The power is also somewhat
higher in sheath regions of ICMEs that are crossed from in-termediate distances from the center (Group 2) than centrally encountered ICMEs (Group 1). Sheath regions behind strong shocks have also stronger ULF power, in particular forPdyn.
Next, we find that the distribution of ULF power between different regions has also distinct differences depending on the shock/driver properties. For Group 2 events theBZpower
peaks in the post-shock region and in the first half of the mid-sheath, while for Group 1 events theBZ power clearly
has a flatter profile. The mainBZ power peak for Group 1
events occurs at the leading edge. ThePdynpower has a sharp peak in the post-shock region, and is strongly enhanced in the latter part of the mid-sheath and in the pre-LE region for Group 2 events, while for Group 1 events a sharp peak is found in the post-LE region.
For fast ICMEs there is a very strong increase in theBZ
power in the post-shock region and during the first part of the mid-sheath, while for slower ICMEs the increase in power close to the shock is more modest.PdynULF power shows a
broad enhancement starting from the latter part of the mid-sheath for fast ICMEs, while for slow ICMEs the levels stay relatively smooth, except the upper quartile curve showing a sharp peak at the leading edge. The power peak in the post-shock region is also considerably stronger for fast ICMEs than for slow ICMEs.
The distribution of BZ power seems rather similar in
sheath regions behind strong and weak shocks. The only re-markable difference is that the peaks in the BZ power at
sheath boundaries are more pronounced in the case of a strong shock. ThePdyn power has the sharpest peak in the
post-shock region for events associated with strong shocks, while for events with weak shocks the main enhancement is in the post-LE region. ThePdynpower has also much larger
variations in the mid-sheath region for the strong shock cate-gory than for the events associated with weak shocks.
The sheath regions of strong ICMEs exhibit high BZ
b)
c)
fastd)
ICME slowICME
Group2
fast
ICME slowICME
f)
Group2g)
h)
weak shock strong
shock weak
ICME
j)
k)
l)
weak shock strong
shock weak
ICME
n)
o)
p)
strong ICME
strong ICME
m)
200 150
100
50
6 5 4 3
i)
Bz ULF Power (nT /Hz)2
Pdyn ULF Power
(nPa /Hz)2 2 1
+15 0 +5 +10 +15 -5 0 +5 +10 +15 0 +5 +10 +15
0 +5 +10
-5
time from shock (hours)
200150
100
50
6 5 4 3 2 1
a)
Group1e)
Group1Pdyn ULF Power (nPa /Hz)2
[image:6.595.52.541.58.427.2]Bz ULF Power (nT /Hz)2
Fig. 4.BZandPdynULF power separated into different categories (see Table 2).
power remains high also through the first hours of the ICME. The events associated with weak ICMEs have the strongest
Pdynpower in the post-LE region and within the ICME. Interplanetary shocks have been shown to be preceded by regions of enhanced fluctuations in various frequency regimes (Greenstadt et al., 1982; Desai et al., 2011; Kajdiˇc et al., 2012), i.e., by wave precursors or foreshocks. Our study concentrates on the sheath regions with much higher level of power, but some notions can be made about the before and pre-shock regions. In our data set, the main difference between events in the different categories was that for fast ICMEs, the upper quartile curve showed a clear increase in the power towards the shock, while for low-speed ICMEs the profile stayed relatively flat until the shock was reached. From Table 3 we also see that the average values of powers in the pre-shock region are higher than in the before-region. Differences are most pronounced for thePdyn ULF power. For example, the averagePdynpower calculated from the up-per quartile curve is 5.8 times higher in the pre-shock region than in the before region.
4 Discussion
We showed thatBY andBZ components exhibited roughly
similar variations in the sheath region and in its surround-ings, whileBX had a considerably flatter profile and lower
fluctuation power. The largest fluctuation power was inBZ.
We found that the IMF andPdyn ULF power have opposite profiles in the mid-sheath region (Fig. 3 and Table 3); the IMF ULF power (in particular inBZandBY) is strongly
en-hanced during the first half of the mid-sheath, while thePdyn
ULF power is more enhanced during the latter half of the mid-sheath, in particular for the strongest events. The mis-match in profiles could be explained by processes associated with the magnetic field evolution andPdyn piling in ICME
sheaths as discussed below.
E. K. J. Kilpua et al.: Magnetic field and dynamic pressure ULF fluctuations 1565
magnetosheaths where plasma flows around the obstacle and magnetic field magnitude increases from the shock towards the object. The observations show that in the Earth’s magne-tosheath, the variations in the temperature anisotropy lead to different turbulent behavior behind the bow shock and close to the magnetopause (Lucek et al., 2005). We also note that it is likely that current sheets and other magnetic field irregular-ities close to the ICME leading edge have had time to interact and, for example, reconnect, while the magnetic field that has more recently passed through the shock in the front part of the sheath is less evolved.
Both IMF and Pdyn ULF power showed strong peaks in the post-shock region and in the vicinity of the leading edge (in particular forBZ). These peaks are likely related
to the microscale physical processes taking place near these boundaries. In particular, several studies have reported in-tense wave activity and large amplitude magnetic field fluc-tuations within shock downstream regions (e.g., Kennel et al., 1982; Schwartz et al., 1996; Bamert et al., 2004; Kataoka et al., 2005; Kajdiˇc et al., 2012). The neighborhood of the ICME leading edge is a much less studied region in terms of plasma wave activity and plasma instabilities.
The findings described above imply that magnetospheric activity associated with solar wind ULF fluctuations in sheath regions (e.g., changes in convection and plasma sheet dynamics, Pc5 waves) is expected to be strongest at the be-ginning of the sheath and around the ICME leading edge. In addition, the magnetospheric processes induced by IMF ULF fluctuations are generally expected before the effects from thePdynULF fluctuations. It is a relevant as to ques-tion whether solar wind Pdyn and IMF ULF fluctuations drive different magnetospheric activity. Studies have shown thatPdynULF fluctuations excite in particular compressional Pc5 waves in the magnetosphere and on the ground (e.g., Kessel, 2008; Liu et al., 2009), while IMF ULF fluctuations have been associated more strongly with toroidal Pc5 waves through enhanced Kelvin–Helmholtz instability on the mag-netopause (Kessel et al., 2004). The details of these processes are beyond the scope of this paper. Weak or slow ICMEs, or those that are encountered centrally, have in general weak ULF power with low variability, and thus are not expected to stir the magnetosphere significantly.
The determination of geomagnetic consequences is further complicated because solar wind plasma and IMF properties change while while transmitting through the bow shock into the magnetosheath. Thus, it is expected that turbulent char-acteristics of the ICME sheath and embedded ULF fluctu-ations are also modified when the sheath interacts with the bow shock. The interaction begins already in the foreshock region, where a large variety of different plasma waves exist (e.g., Eastwood et al., 2005). It is also possible that part of the ULF fluctuations that eventually hit the magnetopause are generated by local sources in the foreshock and bow shock downstream regions (see e.g., Gutysnka et al., 2012; Hartinger et al., 2012, and references therein). The details of
the ICME sheath–bow shock/magnetosheath interaction are a particularly interesting topic that we hope to investigate in the near future.
Sheath regions associated with strong or fast ICMEs had the strongest ULF power and rather similar power profiles (Fig. 4). These correlations might be expected as Gonzalez et al. (1998) showed that faster ICMEs tend to possess higher magnetic fields, and faster ICMEs should drive stronger shocks. However, the resemblance between the power lev-els and profiles for sheath regions of Group 2 and strong ICMEs is surprising. The magnetic field intensity should de-crease with increasing impact parameter as ICMEs should have stronger fields in their core than close to their flanks. Nevertheless, such connections should be taken with caution because ICME properties vary considerably from event to event.
The high ULF power in sheath regions of Group 2 ICMEs could be related to stronger magnetic field line draping at the flanks of the ICME than at its nose (e.g., Gosling and Mc-Comas, 1987; Kaymaz and Siscoe, 2006). It is also possible that, due to geometrical constraints, the ICME shock nose is less likely to be quasi-parallel than the flanks. Thus, the higher turbulence associated to downstream regions of quasi-parallel shocks could contribute to the stronger ULF power in Group 2 events.
The enhancement in theBZULF power in the post-shock
region and in the first part of the mid-sheath was particularly strong for fast ICMEs. As mentioned above, faster ICMEs should have stronger shocks. The enhancement in power was indeed present for the strong shock category, but not as spec-tacularly. An additional property of the fast ICMEs is that their travel times from the Sun to the Earth are shorter, which may affect the level and nature of turbulence in their sheaths. Due to the diversity of ICME-related in situ signatures it is often difficult to determine unambiguously the ICME bound-aries (e.g., Richardson and Cane, 2010). As demonstrated in Fig. 3 the IMF ULF power drops sharply and abruptly when the spacecraft moves from the sheath into the ICME. The smoothness of the magnetic field is indeed one of the ICME identification criteria, but it is difficult to determine quantita-tively. Thus, the IMF ULF power could possibly be used for identifying ICME front boundaries. It will be a future study to investigate in more detail how ULF activity behaves close to the ICME boundaries, and whether its variations could be used to distinguish between different ICME structures.
5 Summary and conclusions
In this paper we have studied how ULF fluctuations in IMF and in solar wind dynamic pressure (Pdyn) are distributed
activity and the lack of statistical studies on the large-scale sheath properties.
We found that the strongest peaks in the ULF power are concentrated just after the shock and in the vicinity of the ICME leading edge. The IMF ULF power was high in the leading part of the sheath, while thePdyn ULF power was
most enhanced in the trailing part of the sheath. The mis-match inPdynand IMF ULF power profiles within the sheath
could be related to the effects from the piling of solar wind plasma in front of the ICME and general magnetic field evo-lution in sheath regions. Different IMF andPdynpower pro-files may have significant consequences on the level and temporal evolution of the magnetospheric activity induced by sheath regions. The strongest ULF power was observed in sheath regions of strong or fast ICMEs, or ICMEs that were crossed at the intermediate distances from the center. We concluded that this is presumably attributed to stronger shocks driven by fast ICMEs and significant magnetic field line draping at the ICME flanks.
Deeper understanding of overall sheath properties and their geomagnetic consequences requires a more extensive analysis of magnetic field and solar wind fluctuations in different frequency ranges and their separate effects on the magnetosphere–ionosphere system. In addition, clues to how sheath properties evolve from the Sun to the Earth can be achieved by revisiting the Helios data and exploiting the ob-servations from the European Space Agency’s Solar Orbiter, scheduled for launch in 2017. These missions have their per-ihelion as close as 0.3 AU from the Sun.
Acknowledgements. We thank N. Ness for the ACE MFI data, and D. J. McComas for the ACE SWE data. We thank L. Jian for the ACE ICME catalog. The Academy of Finland (project 1218152) and V¨ais¨al¨a Foundation are thanked for financial support. The work of Heli Hietala was funded by the UK Science and Technology Fa-cilities Council (STFC).
Topical Editor C. Owen thanks the two anonymous referees for their help in evaluating this paper.
References
Baker, D. N., Pulkkinen, T. I., Li, K. X., and Kanekal, S. G.: Coro-nal mass ejections, magnetic clouds and relativistic magneto-spheric electron events: ISTP, J. Geophys. Res., 103, 17279– 17291, 1998.
Bamert, K., Kallenbach, R., Ness, N. F., Smith, C. W., Tera-sawa, T., Hilchenbach, M., Wimmer-Schweingruber, R. F., and Klecker, B.: Hydromagnetic wave excitation upstream of an interplanetary traveling shock, Astrophys. J., 601, L99–L102, doi:10.1086/381962, 2004.
Blanco-Cano, X., Omidi, N., and Russell, C. T.: Macrostruc-ture of collisionless bow shocks: 2. ULF waves in the foreshock and magnetosheath, J. Geophys. Res., 111, A10, doi:10.1029/2005JA011421, 2006.
Borovsky, J. E. and Funsten, H. O.: Role of solar wind turbulence in the coupling of the solar wind to the Earth’s magnetosphere, J. Geophys. Res., 108, L20101, doi:10.1029/2002JA009601, 2002. Desai, M. I., Dayeh, M. A., Smith, C. W., Lee, M. A., and Mason, G. M.: Ion acceleration near CME-Driven interplanetary shocks, in: 32nd International Cosmic Ray Conference, vol. 10, p. 53, 2011.
Eastwood, J. P., Lucek, E. A., Mazelle, C., Meziane, K., Narita, Y., Pickett, J., and Treumann, R. A.: The foreshock, Space Sci. Rev., 118, 41–94, 2005.
Golsing, J. T. and McComas, D. J.: Field line draping about fast coronal mass ejecta: A source of strong out-of-the-ecliptic in-terplanetary magnetic fields, Geophys. Res. Lett., 14, 355–358, 1987.
Gonzalez, W. D., de Gonzalez, A. L., Dal Lago, A., Tsurutani, B. T., Arballo, J. K., Lakhina, G. K., Buti, B., Ho, C. M., and Wu, S.-T.: Magnetic cloud field intensities and solar wind velocities, Sol. Phys., 25, 963–966, 1998.
Greenstadt, E. W., Scarf, F. L., Fredricks, R. W., Kennel, C. F., and Smith, E. J.: Plasma wave levels and IMF orientations preced-ing observations of interplanetary shocks by ISEE-3, J. Geophys. Res., 9, 668–671, doi:10.1029/GL009i006p00668, 1982. Gutynska, O., ˇSimunek, J., ˇSafr´ankov´a, J., Nˇemeˇcek, Z., and Pˇrech,
L.: Multipoint study of magnetosheath magnetic field fluctua-tions and their relation to the foreshock, J. Geophys. Res., 117, A4, doi:10.1029/2011JA017240, 2012.
Hartinger, M., Vassilis, A., Moldwin, M. B., Nishimura, Y., Turner, D. L., Glassmeier, K.-H., Kivelson, M. G., Matzka, J., and Stolle, C.: Observations of a Pc5 global (cavity/waveguide) mode out-side the plasmasphere by THEMIS, J. Geophys. Res., 117, A6, doi:10.1029/2011JA017266, 2012.
Huttunen, K. E. J. and Koskinen, H. E. J.: Importance of post-shock streams and sheath region as drivers of intense magnetospheric storms and high-latitude activity, Ann. Geophys., 22, 1729–1738, doi:10.5194/angeo-22-1729-2004, 2004.
Huttunen, K. E. J., Koskinen, H. E. J., and Schwenn, R.: Variability of magnetospheric storms driven by different solar wind pertur-bations, J. Geophys. Res., 107, SMP 20-1–SMP 20-8, 2002. Huttunen, K. E. J., Kilpua, S. P., Pulkkinen, A., Viljanen, A., and
Tanskanen, E.: Solar wind drivers of large geomagnetically in-duced currents during the solar cycle 23, Space Weather, 6, S10002, doi:10.1029/2007SW000374, 2008.
Jian, L. K., Russell, C. T., Luhmann, J. G., and Skoug, R. M.: Prop-erties of interplanetary coronal mass ejections at one AU during 1995–2004, Sol. Phys., 239, 393–436, 2006.
Kajdiˇc, P., Blanco-Cano, X., Aguilar-Rodriguez, E, Russell, C. T., Jian, L. K., and Luhmann, J. G.: Waves upstream and down-stream of interplanetary shocks driven by coronal mass ejections, J. Geophys. Res., 117, A6, doi:10.1029/2011JA017381, 2012. Kataoka, R., Watari, S., Shimada, N., Shimazu, H., and Marubashi,
K.: Downstream structures of interplanetary fast shocks asso-ciated with coronal mass ejections, Geophys. Res. Lett., 32, L12103, doi:10.1029/2005GL022777, 2005.
Kaymaz, Z. and Siscoe, G.: Field-Line Draping Around ICMES, Sol. Phys., 239, 437–448, 2006.
E. K. J. Kilpua et al.: Magnetic field and dynamic pressure ULF fluctuations 1567
Kepko, L., Spence, H. E., and Singer, H. J.: ULF waves in the solar wind as direct drivers of magnetospheric pulsations, Geophys. Res. Lett., 29, 39-1–39-4, doi:10.1029/2001GL014405, 2002. Kessel, R. L.: Solar wind excitation of Pc5 fluctuations in the
magnetosphere and on the ground, J. Geophys. Res., 113, A4, doi:10.1029/2007JA012255, 2008.
Kessel, R. L., Mann, I. R., Fung, S. F., Milling, D. K., and O’Connell, N.: Correlation of Pc5 wave power inside and outside themagnetosphere during high speed streams, Ann. Geophys., 22, 629–641, doi:10.5194/angeo-22-629-2004, 2004.
Kim, J., Lyons, L. R., Zou, S., Boudouridis, A., Lee, D.-Y., Heinselman, C., and McCready, M.: Evidence that so-lar wind fluctuations substantially affect the strength of day-side ionospheric convection, J. Geophys. Res., 114, A11, doi:10.1029/2009JA014280, 2009.
Liu, W., Sarris, T. E., Li, X., Elkington, S. R., Ergun, R., An-gelopoulos, V., Bonnell, J., and Glassmeier, K. H.: Electric and magnetic field observations of Pc4 and Pc5 pulsations in the in-ner magnetosphere: A statistical study, J. Geophys. Res., 114, A12, doi:10.1029/2009JA014243, 2009.
Lucek, E. A., Constantinescu, D., Goldstein, M. L., Pickett, J., Pinc¸on, J. L., Sahraoui, F., Treumann, R. A., and Walker, S. N.: The Magnetosheath, Space Sci. Rev., 118, 95–152, doi:10.1007/s11214-005-3825-2, 2005.
Luhmann, J. G., Russell, C. T., and Elphic, R. C.: Spatial distributions of magnetic field fluctuations in the day-side magnetosheath, J. Geophys. Res., 91, 1711–1715, doi:10.1029/JA091iA02p01711, 1986.
Lyons, L. R., Kim, H.-J., Xing, X., Zou, S., Lee, D.-Y., Heinselman, C., Nicolls, M. J., Angelopoulos, V., Larson, D., McFadden, J., Runov, A., and Fornacon, K.-H.: Evidence that solar wind fluc-tuations substantially affect global convection and substorm oc-currence, J. Geophys. Res., 114, 11, doi:10.1029/2009JA014281, 2009.
Ogilvie, K., Chornay, D., Fritzenreiter, R., Hunsaker, F., Keller, J., Lobell, J., Miller, G., Scudder, J., Sittler, E. C., J., Torbert, R., Bodet, D., Needell, G., Lazarus, A., Steinberg, J., Tappan, J., Mavretic, A., and Gergin, E.: SWE, a comprehensive plasma in-strument for the WIND spacecraft, Space Sci. Rev., 71, 55–77, doi:10.1007/BF00751326, 1995.
Richardson, I. G. and Cane, H. V.: Near-Earth interplanetary coro-nal mass ejections during solar cycle 23 (1996–2009): cat-alog and summary of properties, Sol. Phys., 264, 189–237, doi:10.1007/s11207-010-9568-6, 2010.
Sahraoui, F., Pincon, J.L., Belmont, G., Rezeau, L., Cornilleau-Wehrlin, N., Robert, P., Mellul, L., Bosqued, J. M., Balogh, A., Canu, P., and Chanteur, G., ULF wave identification in the mag-netosheath: The k-filtering technique applied to Cluster II data, J. Geophys. Res., 108, A9, doi:10.1029/2002JA009587, 2003. Schwartz, S. J., Burgess, D., and Moses, J. J.: Low-frequency waves
in the Earth’s magnetosheath: present status, Ann. Geophys., 14, 1134–1150, doi:10.1007/s00585-996-1134-z, 1996.
Shevyrev, N. N., Zastenker, G. N., Eiges, P. E., and Richardson, J. D.: Low frequency waves observed by Interball-1 in fore-shock and magnetosheath, Adv. Space Res., 37, 1516–1521, doi:10.1016/j.asr.2005.07.072, 2005.
Simms, L. E., Pilipenko, V. A., and Engebretson, M. J.: Determining the key drivers of magnetospheric Pc5 wave power, J. Geophys. Res., 115, A10, doi:10.1029/2009JA015025, 2010.
Siscoe, G. and Odstrcil, D.: Ways in which ICME sheaths differ from magnetosheaths, J. Geophys. Res., 113, A9, doi:10.1029/2008JA013142, 2008.
Smith, C., L’Heureux, J., Ness, N., Acuna, M., Burlaga, L., and Scheifele, J.: The ACE Magnetic Fields Experiment, Space Sci. Rev., 86, 613–632, doi:10.1023/A:1005092216668, 1998. Tsurutani, B. T., Smith, E. J., Gonzalez, W. D., Tang, F., and
Aka-sofu, S. I.: Origin of interplanetary southward magnetic fields re-sponsible for major magnetic storms near solar maximum (1978– 1979), J. Geophys. Res., 93, 8519–8531, 1998.