A Community-based Cloud Computing Caching Service
Unekwu Idachaba
School of Computing
University of Kent Kent, United Kingdom e-mail: [email protected]
Frank Wang
School of Computing
University of Kent Kent, United Kingdom e-mail: [email protected]
Abstract—Caching has become an important technology in the development of cloud computing-based high-performance web services. Caches reduce the request to response latency experienced by users, and reduce workload on backend databases. They need a high cache-hit rate to be fit for purpose, and this rate is dependent on the cache management policy used. Existing cache management policies are not designed to prevent cache pollution or cache monopoly problems, which impacts negatively on the cache-hit rate. This paper proposes a community-based caching approach (CC) to address these two problems. CC was evaluated for performance against thirteen commercially available cache management policies, and results demonstrate that the cache-hit rate achieved by CC was between 0.7% and 55% better than the alternate cache management policies.
Keywords—Cache, Cloud Computing, Clustering, Artificial Bee Colony
I. INTRODUCTION
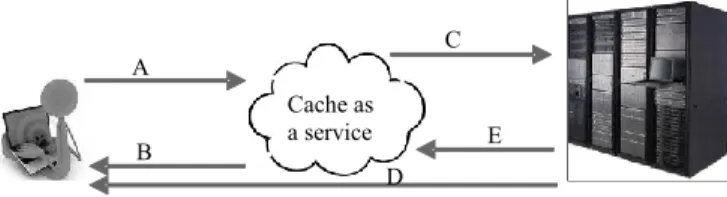
A cache holds copies of requested data close to the source of request, in anticipation of receiving the same request again. This reduces request to response latency, network traffic, and workload on web service backend databases. As shown in Fig. 1, when a user makes a request from a web service, the supporting cache is first checked for existence of a response to the request. If a response exists in the cache (cache-hit), the response is sent to the user. If a response does not exist in the cache (cache-miss), a response is extracted from the web service backend database, and a copy is sent to the cache.
Figure 1.Web Caching. A user makes a request (A) on a web service, and the supporting cache is checked. If a response exists in the cache (cache-hit), the response (B) is sent to the user. If a response does not exist in the cache (cache-miss), a response is extracted from the web service backend database (C and D) and a copy (E) is sent to the cache.
In the early 1980s, caches were used to support computer processing units for improved computer performance. Caches have since been shown to be useful in other areas, including in computer disk drive management,
database management systems, web browsers, proxy servers, and most recently, in cloud computing.
Since the early years of the internet, a lot has changed: there is a growing world population, the internet is more widely accessible, there are an increasing number of applications, and there has been a shift from static to dynamic content. These factors are responsible for generating enormous volumes of traffic, putting huge demands on the databases and cache resources which support web services. As a result, web service users may experience delays when retrieving web pages from remote sites. One obvious solution is to expand resources, and cloud computing is quickly becoming the preferred option in achieving this. Cloud computing represents a new shared consumption and delivery model for information technology services, and its scalability allows the dynamic expansion of resources based on demand [1][2][3]. However, the expansion of resources may involve an increase in economic cost. This paper presents a community-based caching approach (CC) which manages caches more intelligently rather than expanding them.
II. MOTIVATION AND CONTRIBUTION
This work is motivated by the emergence of caching as a cloud service, supporting web services in keeping up with the fast-growing demands of internet users on their backend database servers [4]. Current commercially-available management policies driving such cloud services were developed to support other environments, such as computer processing units and computer storage disks. They were not developed with the multi-tenant characteristic or homogeneity of scale of cloud computing in mind.
Also relevant is recent research into data mining, particularly use of the Artificial Bee Colony clustering algorithm, and the opportunity for exploiting the advantages of homogeneity in cloud computing multi-tenancy using data mining clustering methodology to make cloud computing-based caches ‘smarter’, producing a better cache-hit rate.
Caches are expensive and limited in size. A cache requires a policy to ‘manage’ it, or to dictate what is held or removed [5]. Current commercially-available cache management policies are prone to two problems: cache pollution (where users continue to fill the cache with requests which will not be referenced again) and cache monopoly (where some users monopolise the cache with a Cache as a service B A E C D
higher request rate). To highlight the research questions that flow from the consideration of these two problems, I introduce two scenarios based on web use behaviour.
Cache Pollution: A user who issues frequent unique
requests for data objects with zero reusability potential may evict other users’ cached data objects which have reusable potential before they are reused.
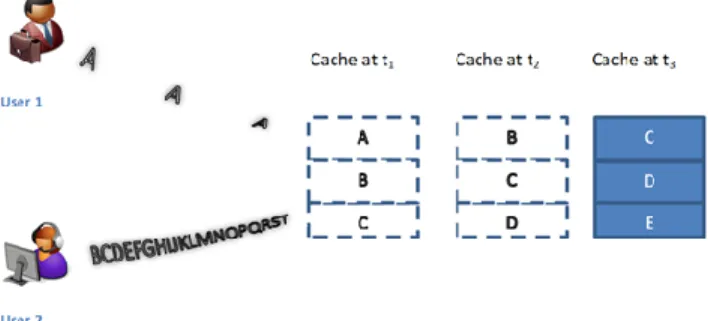
In Fig. 2 User 1 sends the same request with 13 units of time between each request, while User 2 sends different requests each unit of time. Between t1 and t3, requests from
User 1 appeared once and did not survive in the cache for reuse because User 2’s frequent and non-reusable requests would always evict it. This leads to cache pollution, where frequent non-reusable requests flood a cache. Caches are meant to hold data for reuse, and so the higher the reusability potential of a data object, the more it contributes to cache-hit rate and therefore better utilisation of the cache. Cache pollution prevents this effective use.
Cache Monopoly: In Fig. 2, assuming User 2 makes
some occasional repeat requests, there will be an issue of cache monopoly, as User 1 yet does not stand a chance of a cache-hit. If the cache’s shared resources are allocated based on overlapping interests across all users, the risk of monopoly can be minimised.
Figure 2. Cache Pollution and Monopoly.
Our research is aimed at optimising cache performance, examining the following questions:
(1) Can the reduction of cache pollution and cache monopoly improve cache-hit rate?
(2) Can identifying data objects with zero or little potential of being referenced again and proactively preventing them from being cached reduce cache pollution?
(3) Can grouping users based on shared interests and allocating cache resources based on these groups rather than individual users minimise cache monopoly?
(4) Can clustering successfully group users into communities of shared interest and associated interest levels?
From these questions we arrived at three summary research objectives:
(1) Design of a new cache management policy which prevents storage of data objects with little or no
reuse potential, and allocates cache resources based on groups (communities) of shared interests.
(2) Implementation of this new cache management policy, integrating a clustering algorithm to provide community and shared interest ranking information. (3) Evaluation the performance of the new cache
management policy against current commercially-available cache management policies.
The result, and the subject of this paper, is a novel community-based caching approach for cloud computing environments.
III. DESIGN
Our proposed CC approach for cache management identifies communities by grouping together users with common interests, based on their access patterns, using a clustering algorithm. It then profiles each community’s interests based on popularity within that community. This interest profile is used to prevent cache pollution by determining which data object is allowed into the cache and which cached data object is evicted. The identified communities are used to minimise cache monopoly by partitioning the cache and assigning each community to a cache partition (Fig. 3).
Figure 3.A community-based caching approach.
CC is inspired by the foraging activity of natural honey bees. The organisational techniques of foraging honey bees has been proven to solve many optimisation problems [6][7][8][9]. Two aspects of honey bee foraging activity in particular have informed my engineering approach— profitability-based deployment, and territorial organisation.
Profitability-based deployment: For a bee colony to
gather food efficiently, it deploys ‘employed foragers’ (E) to identify food sources and their profitability. The colony then deploys ‘unemployed foragers’ (onlooker bees: U and scout bees: S) to food sources based on identified profitability, to ensure that most of its nectar comes from the richest sources.
Territorial organisation: Back at the hive, food-storer
bee (FS) behaviour indicates the hive’s available nutrients— its level of stockpiled nectar, pollen and water. Bee colonies practice territorial defence. Hive guards (HG) react based on the status of the hive: during nectar shortages, they are less permissive of non-hive bees. But as nectar becomes
abundant guards become more permissive toward non-hive mates (Fig. 4) [10][11].
Figure 4.Honey bee foraging activity. The employed bee (E) provides its hive mates with information on identified food sources. The food-storer bee (FS) provides information about the hive’s status. Onlooker bees (U) and scout bees (S) use this information to ensure the hive gains the nutrients it needs. Hive guards (HG) use the information provided by FS to determine whether to allow non-hive mates through the hive gate.
CC is composed of a cache and a management layer. Consider the cache—which is partitioned into sub-caches— as a set of hives: it is supported by a ‘Cache Manager’ (CM), ‘Community Information Provider’ (CI-P) and a ‘Demography Information Provider’ (DI-P) as shown in Fig. 5 and Fig. 6. CC periodically deploys its employed forager (CI-P) to gather information about food sources (incoming requests), identifying those belonging to the same patch (community), and building a profitability profile for each patch. The storer bee (DI-P) provides status information on each sub-cache. Unemployed bees (CM) choose which food source to harvest based on the profitability profile made available by employed foragers. Guard bees only allow the use of sub-cache resources if there are surplus unused resources.
Cache Manager (CM): Unemployed Bees and Hive Guard Bees
M an ag em en t La ye r Community Information Provider (CI-P) Employed Forager Demography Information Provider (DI-P) Food-Storer Bees
Sub-caches: Territories and Hives Cache Requests: food sources and Hive resources
Figure 5.Mapping CC to Natural Honey Bee Foraging.
The CM is responsible for users’ ‘get’ requests, partitioning the cache into sub-caches (territories) and applying the cache replacement policy (insertion and eviction). It depends on the CI-P and DI-P to achieve these responsibilities. The CI-P runs a clustering algorithm at set intervals, providing the CM with community membership information and interest profiles.
The clustering algorithm used by CI-P is a modified ABC algorithm: Q2ABC [12]. The ABC clustering algorithm was chosen because of the simplicity of implementing and modifying it, the research interest it has drawn since its introduction, the ease of incorporating other metaheuristic algorithms into it, its good performance against other population-based algorithms, and because its representation is centroid-based. DI-P provides CM with content quality and the availability status of each sub-cache. Each cluster identified by the clustering algorithm represents a community of users with shared interests. The centroid of each cluster represents the popularity levels of requests made within each cluster.
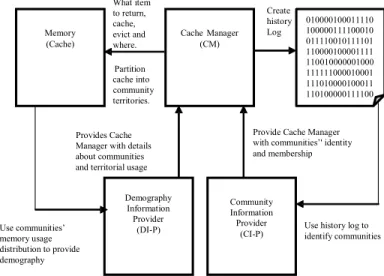
Figure 6. Relationship between Cache Manager (CM), Demography Information Provider (DI-P) and Community Information Provider (CI-P).
The CM makes decisions based on the information provided by the DI-P and CI-P. The CM captures historic data for the CI-P.
Under the CC policy, the number of sub-caches is set to the given maximum number of communities plus one additional sub-cache assigned to requests with an unknown or unestablished community identity. When a cache insertion request is made, the CM retrieves the request’s community identification and associated sub-cache, then carries out actions as described in Fig. 7.
Unloading Create nectar history Log Food store
Provide Cache Manager Dancing
with communities’' identity area
and membership Food source
Use history log to identify communities Begin Foraging Cache HG Manager E (CM) E 010000100011110 100000111100010 FS 011110010111101 110000100001111 O 110 010000001000 S 111111000010001 111010000100011 R 110100000111100 andom se Community arch for a Information food source Provider Field (CI Hive - P) O S Memory (Cache) Demography Information Provider (DI-P) What item to return, cache, evict and where. Partition cache into community territories. Provides Cache Manager with details about communities and territorial usage
Use communities’ memory usage distribution to provide demography
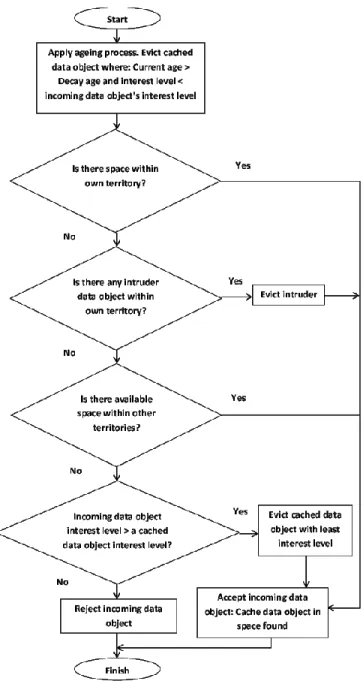
Figure 7.Community-based Caching Replacement Policy. When a cache request is made, the associated territory (sub-cache or partition) of the incoming data object is identified. The data object is cached firstly based on space availability in its associated territory before that in other territories, and secondly based on the comparison of interest levels between the incoming and the incumbent data objects.
IV. IMPLEMENTATION AND EVALUATION
We evaluated CC against Adaptive Replacement Cache (ARC), Clock, First-in-first-out (FIFO), Greedy Dual (GD), Greedy Dual Size Frequency (GDSF), Hybrid, Least Frequently Used (LFU), Low Inter-reference Recency Set (LIRS), Least Recently Used (LRU), Most Recently Used (MRU), Two Queue (2Q) and Random Replacement (RR) cache management policies using hit rate, cache-acceptance count and cache-rejection count as metrics. To
carry out the evaluation, we implemented CC within a simulation environment.
A. Simulation Environment
I installed a Memcached 1.2.6 server, Ncache express server, and Oracle coherence 12.1.3 server, alongside libraries for ARC, Clock, FIFO, GD, GDSF, Hybrid, LFU, LIRS, MRU, 2Q and RR cache management policies on a virtual machine with 2.4 GHz Intel Core 2 Duo, 2Gb base memory and 40Gb of storage. To ensure consistency, I set all caches to the same size, starting at 20Mb then scaling up to 40Mb and finally 80Mb. I also turned off the compression capabilities of the memcached and ncache cache servers. The CC cache-partition-count parameter was set to 3, the decay-age parameter to 10 times the cache size, and the community identification process trigger was set to go off after every one hundred cache requests. Datasets used for the evaluation included those of ClarkNet, EPA, Google Plus, Hyperreal, MemeTracker, MSNBC, NASA, Twitter, University of Saskatchewan (UOS) and USA.gov [13][14][15]. The simulation was repeated ten times independently for each dataset. Reported values from the simulation are averages of the values obtained from the repetitions.
B. Simulation Results
The simulation results have been divided into three groups. The first group shows results from the simulation based on a 20Mb cache size, while the second and third groups are based on a 40Mb and 80Mb cache size respectively.
Each group consists of tables showing cache-hit rate performances. Fig. 8–12 are charts showing cache monopoly management and cache pollution avoidance.
Results from the first set of experiments (cache size 20Mb) show that CC had a cache-hit rate between 0.7% and 55% better than the compared policies in six of the ten traffic data used (Table I). The second experiment shows that CC had a cache-hit rate between 1% and 49% better with seven of the ten trace traffic data used (Table II). The third experiment shows CC having a cache-hit rate between 1% and 21% better with six of the ten trace traffic data used (Table III). A t-Test (Paired Two Sample for Means) shows that CC cache-hit rate performance over the other cache policies (with the exception of GD, GDSF and LIRS) is statistically significant. Google Plus trace traffic data under CC showed a higher standard deviation and standard error compared with other cache policies.
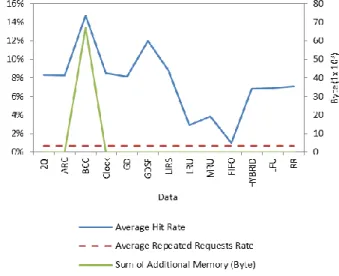
Fig. 8–10 show average cache-hit rate against expected cache-hit rate (average repeated requests rate) for cache size 20Mb. CC maintained a cache-hit rate above the expected rate across most frequency groups. There were two exceptions: (1) where all tested cache policies had an average cache-hit rate below the expected cache-hit rate, CC performance was closest to the expected cache-hit rate. This is because CC excludes data objects with no cache-hit potential from being cached, while managing those with cache-hit potential in order to minimise cache monopoly and optimise cache-hit rate. In our experiment there was one
TABLE IAVERAGE HIT RATE FOR 20MBCACHE MEMORY SIZE
Cache
Policy ClarkNet EPA
Plus Hyperreal MemeTracker MSNBC NASA Twitter UOS USAGov
2Q 6.9% 35.6% 1.9% 45.0% 17.7% 98.3% 45.9% 1.2% 38.3% 14.4% ARC 6.9% 33.9% 2.0% 40.5% 17.9% 89.8% 38.4% 1.2% 37.6% 15.3% BCC 14.2% 46.7% 2.4% 50.4% 15.8% 98.3% 56.9% 2.0% 51.4% 13.7% Clock 9.9% 42.2% 0.1% 34.5% 11.4% 98.3% 45.2% 1.3% 32.3% 6.9% GD 7.6% 38.5% 2.5% 44.9% 17.9% 98.3% 43.5% 1.0% 40.2% 17.6% GDSF 9.9% 43.6% 2.4% 45.8% 18.0% 98.3% 50.0% 1.3% 49.5% 17.6% LIRS 7.7% 36.7% 1.9% 45.5% 17.9% 98.3% 44.0% 1.5% 39.6% 17.8% LRU 3.5% 19.1% 1.7% 31.1% 17.6% 98.3% 24.9% 1.5% 28.4% 11.8% MRU 6.1% 12.4% 0.1% 16.9% 11.4% 98.3% 16.2% 0.9% 19.5% 5.4% FIFO 1.1% 1.6% 0.4% 2.6% 1.8% 97.5% 1.8% 0.4% 2.3% 1.3% HYBRID 7.8% 39.7% 1.4% 25.8% 15.4% 98.3% 37.5% 1.3% 41.6% 9.3% LFU 5.8% 39.5% 0.6% 26.7% 15.2% 98.3% 34.9% 0.8% 38.0% 8.1% RR 7.0% 33.2% 2.3% 39.3% 17.4% 98.3% 36.6% 0.9% 37.0% 16.2%
CC had a cache-hit rate between 0.7% and 55% better in six of the ten trace traffic data used.
TABLE IIAVERAGE HIT RATE FOR 40MBCACHE MEMORY SIZE
Cache
Policy ClarkNet EPA
Plus Hyperreal MemeTracker MSNBC NASA Twitter UOS USAGov
2Q 6.9% 35.6% 1.9% 45.0% 17.7% 98.3% 45.9% 1.2% 38.3% 14.4% ARC 6.9% 33.9% 2.0% 40.5% 17.9% 89.8% 38.4% 1.2% 37.6% 15.3% BCC 16.3% 49.6% 3.1% 54.8% 16.8% 98.3% 59.0% 2.1% 54.2% 15.5% Clock 9.9% 42.2% 0.1% 34.5% 11.4% 98.3% 45.2% 1.3% 32.3% 6.9% GD 7.6% 38.5% 2.5% 44.9% 17.9% 98.3% 43.5% 1.0% 40.2% 17.6% GDSF 9.9% 43.6% 2.4% 45.8% 18.0% 98.3% 50.0% 1.3% 49.5% 17.6% LIRS 7.7% 36.7% 1.9% 45.5% 17.9% 98.3% 44.0% 1.5% 39.6% 17.8% LRU 7.0% 28.0% 2.5% 41.3% 18.0% 98.3% 35.5% 2.0% 37.6% 16.8% MRU 6.1% 12.4% 0.1% 16.9% 11.4% 98.3% 16.2% 0.9% 19.5% 5.4% FIFO 2.2% 3.1% 1.0% 5.2% 3.5% 97.6% 3.6% 0.7% 4.6% 2.4% HYBRID 10.4% 43.2% 2.1% 37.7% 17.0% 98.3% 49.0% 1.8% 46.6% 15.0% LFU 9.6% 43.7% 1.1% 36.6% 16.9% 98.3% 49.4% 1.0% 44.7% 14.1% RR 7.5% 33.0% 2.3% 39.6% 17.4% 98.3% 37.6% 1.0% 36.9% 16.1%
CC had a cache-hit rate between 1% and 49% better in seven of the ten trace traffic data used.
group consisting of 7% of the total users that showed a high level of repeated requests (66% of repeated requests came from this group). CC saw this as cache monopoly and attempted to minimise it, resulting in a poor performance. The second exception (2) is where CC performed generally poorly. In one scenario, CC performance was below expected cache-hit rate and the cache-hit rate of some of the other cache management policies like ARC, GD, GDSF, LIRS and RR. This was because the USAGov traffic trace data had only a few repeated requests, with frequency group
1-10 accounting for 96% of users and 41% of repeated requests.
TABLE IIIAVERAGE HIT RATE FOR 80MBCACHE MEMORY SIZE
Cache
Policy ClarkNet EPA
Plus Hyperreal MemeTracker MSNBC NASA Twitter UOS USAGov
2Q 15.1% 47.1% 2.9% 52.4% 18.0% 98.3% 55.6% 1.4% 51.3% 20.3% ARC 12.8% 47.4% 3.0% 48.2% 18.5% 98.3% 49.7% 1.6% 48.2% 20.5% BCC 24.2% 54.0% 4.8% 60.0% 17.6% 98.3% 63.1% 2.7% 60.3% 21.0% Clock 11.5% 46.7% 0.1% 51.4% 12.5% 98.3% 54.6% 1.7% 41.0% 8.3% GD 15.2% 48.9% 3.6% 53.6% 18.4% 98.3% 56.6% 1.9% 54.6% 21.8% GDSF 17.6% 51.2% 3.6% 54.3% 18.3% 98.3% 58.7% 2.1% 58.2% 21.5% LIRS 14.0% 51.2% 2.5% 52.5% 18.3% 98.3% 57.9% 2.0% 54.0% 22.9% LRU 14.1% 41.5% 3.8% 48.7% 18.2% 98.3% 51.4% 2.5% 48.7% 21.6% MRU 8.8% 23.3% 0.1% 27.0% 12.0% 98.3% 26.0% 1.3% 30.2% 8.8% FIFO 8.6% 12.5% 4.1% 20.8% 13.9% 97.6% 14.6% 2.8% 18.4% 9.4% HYBRID 17.5% 49.2% 3.0% 52.5% 18.5% 98.3% 57.9% 2.1% 56.6% 19.1% LFU 15.0% 46.4% 2.1% 50.0% 17.4% 98.3% 56.6% 1.5% 55.8% 17.6% RR 13.0% 44.1% 3.4% 49.7% 18.0% 98.3% 49.6% 1.9% 49.5% 20.3%
CC had a cache-hit rate between 1% and 21% better with six of the ten trace traffic data used.
Figure 8.ClarkNet 1-10 frequency group actual and expected cache-hit rate (request-repeat rate). CC incurred an overhead of 0.09Mb (to store community membership and profile information) for this frequency group.
Figure 9. ClarkNet 11-20 frequency group actual and expected cache-hit rate (request-repeat rate). CC incurred an overhead of 0.07Mb (to store community membership and profile information) for this frequency group.
Figure 10. ClarkNet 21-30 frequency group actual and expected cache-hit rate (request-repeat rate). CC incurred an overhead of 0.06Mb (to store community membership and profile information) for this frequency group.
A key difference between CC and other cache policies is its ability to determine whether or not to cache a data object, based on that data object’s cache-hit potential. Other cache policies cache data objects irrespective of their cache hit potential. This poses a risk for cache pollution. CC prevented at least 80% of data objects (barring MSNBC trace traffic data) with no cache potential from entering the cache, reducing the chance of cache pollution (Fig. 11). The number of rejected data objects with cache-hit potential was under 6% compared with those accepted (Fig. 12).
Figure 11. CC rejection and acceptance of data objects with no cache-hit potential. CC kept at least 80% of data objects with no cache potential away from the cache, reducing the chance of cache pollution (except with regard to MSNBC trace traffic data).
Figure 12. CC rejection and acceptance of data objects with cache-hit potential. The number of rejected data objects with cache-hit rate potentials was under 6% compared with those accepted.
V. CONCLUSION
We propose taking a community-based caching (CC) approach. CC manages caching as a cloud services intelligently. It eliminates cache pollution and minimises monopoly problems inherent in other cache management policies, improving overall cache-hit rate. In our experiment, the cache-hit rate achieved by CC was between 0.7% and 55% better than that of other tested cache policies. Our t-Tests demonstrate that these improvements are statistically significant.
The simulation results and tests of statistical significance show that CC manages caches intelligently, achieving extra value for a server providing caching as a cloud service.
Future investigations should focus on how the size of historic data used in CC and the pre-set community count affect cache-hit rate.
ACKNOWLEDGMENTS
U. Idachaba would like to thank Professor Leon Chua, in his role as an EC Marie Curie Fellow at the University of Kent’s School of Computing, for his support.
REFERENCES
[1] M. Armbrust, “Above the clouds: A Berkeley view of cloud computing,” University of California, Berkeley, EECS Department. California: UCB/EECS, 2009.
[2] D. Dash, V. Kantere, and A. Ailamaki, “An economic model for self-tuned cloud caching,” IEEE International Conference on Data Engineering, pp. 1687–1693, Shanghai: IEEE, 2009.
[3] G. Pallis, A. Vakali, and J. Pokorny, “A clustering-based prefetching scheme on a Web cache environment,” Computers and Electrical Engineering, 34(4), pp. 309–323, 2008.
[4] J. Wang, “A survey of web caching schemes for the internet,” ACM SIGCOMM Computer Communication Review, 29(5), pp. 36–46, 1999.
[5] Y. Liangzhong, C. Guohong and C. Ying, “A generalized target-driven cache replacement policy for mobile environments,” IEEE Applications and the Internet, pp. 14–21, 2003.
[6] E. Bonabeau, and C. Meyer, “Swarm intelligence,” Harvard Business Review, 79(5), pp. 106–114, 2001.
[7] D. Pham, “Data Clustering Using the Bee Algorithm,” Proceedings of the 40th CIRP International Manufacturing Systems Seminar, pp. 233–358, Liverpool: CIRP, 2007.
[8] A. Jain, “Data clustering: a review,” ACM computing surveys (CSUR), 31(3), pp. 264–323, 1999.
[9] D. Karaboga, and C. Ozturk, “A novel clustering approach: Artificial Bee Colony (ABC) algorithm,” Applied Soft Computing, 11(1), pp. 652–657, 2011.
[10] T. Seeley, S. Camazine and J. Sneyd, “Collective decision-making in honey bees: how colonies choose among nectar sources,” Behavioral Ecology and Sociobiology, 28(4), pp. 277–290, 1991.
[11] T. Seeley, “The Honey Bee Colony as a Super Organism,” American Scientist, pp. 546–553, 1989.
[12] U. Idachaba, F. Z. Wang and N. Helian, “Quantity and Quality Aware Artificial Bee Colony Algorithm for Clustering,” International Journal of Computer, Information, Systems and Control Engineering, 7, pp. 341–344, 2013.
[13] A. Frank and A. Asuncion, “UCI Machine Learning Repository,” California: University of California, 2010.
[14] J. Leskovec, “Stanford Large Network Dataset Collection,” Retrieved January 1, 2013, from Stanford Network Analysis Project: http://snap.stanford.edu/data/index.html, 2009.
[15] P. Danzig, “Traces,” Retrieved January 1, 2013, from Internet Traffic Archive: http://ita.ee.lbl.gov/html/traces.html, 2008.