GSJ: Volume 6, Issue 8, August 2018, Online: ISSN 2320-9186
www.globalscientificjournal.com
ADVANCES
IN
THE
ANALYSIS
OF
SIMPLY
SUPPORTED
CONCRETE
BRIDGE
DECK
Ezi E.N., Onuamah, P.N., Ugwuanyi, D.C ,Agbo, I. O.
ABSTRACT: Highways and Railways will continue to be the major transportation modes in Nigeria for the
foreseeable future for the movement of people, goods and services. The intensity of the motor traffic is continuously increasing and will be further increased for some years. The analysis aims at improving on the beam and slab deck design by eliminating several joints associated with simply supported concrete decks. To accomplish these, the Guyon-Massonet-Bare method is used.
Keywords: Highways, bridge decks, construction technology, maintenance cost, girder spacings, lateral load
1 INTRODUCTION
Highways and Railways will continue to be the major transportation models in Nigeria for the forseable future for the movement of people, goods and services.
The intensity of the motor traffic is continuously increasing and will be further increased for some years. Therefore some of the existing bridge decks must be rebuilt or strengthened and new modern motorways built in order to reduce traffic congestion or eliminate long distance traffic.
Bridge deck which is the superstructure of any bridge is required to cross rivers, valleys, roads and railways at different levels. Bridge Engineering like other heavy civil engineering works offers the engineer the opportunity to apply his creative ability, knowledge of building materials technology, construction technology and applied mechanics to evolve structural forms in bridge structures which are both functional and aesthetically pleasing.
Bridge decks unlike buildings are designed to carry heavy ever changing moving load patterns during their life span. The life span of bridge decks vary from 50-100 years. The ever increasing cost of construction and maintenance calls for greater economy in bridge deck analysis, design and construction supervision.
To ascertain the different methods of analysis of a simply supported concrete bridge deck and the advances or improvement made to reduce several joints associated with simply supported bridge decks, due to the problems (disadvantages) associated with expansion joints, one has;
to carefully understand the technical knowhow on the analysis of a simply supported concrete bridge deck with reference to the beam and slab bridge deck, and the improvement or advances made presently to
eliminate too many joints at supports to give a reliable approach in terms of bridge deck configuration, economic, safety, low maintenance cost and construction method for fast project completion.
to determine the optimum lateral load distribution in concrete bridge deck analysis from the past up to the present and advances made and the implications.
to answer the integrity question using few expansion joints in a simply supported bridge deck,and the use of equal and mix girder spacings in lateral load distribution in bridge deck.
The significance of the study is on the technical knowhow on the analysis of a simply supported concrete bridge deck, and the inter-relationship of structural members in transferring loads.
1.1 Scope of Study
The scope of work are to understand the functions of the structural elements and their inter-relationship in transmitting loads, their internal behaviours in terms of stresses, bending, shear, etc, and the effect of external forces both artificial and natural, so as to produce reliable information, not just approximation, but effective analysis for proper design, detailing, construction, repairs and maintenance culture for a beam and slab bridge deck specifically [1].
1.2 Limitations of study
There are several types of concrete bridgedecks, but, it is only the beam and slab bridge deck type that is discussed in terms of methods of analysis, while the other types of bridge decks such as box girder, prestressing cables etc, and the use of computer software to model load were briefly summarized to reduce volume.
2 MAJOR PHASES IN BRIDGE DECK
ANALYSIS
GSJ: VOLUME 6, ISSUE 8, August 2018
353
2. Intended use of the bridge deck, the shape and the loading arrangement (very important), load analysis and detailed design
3. Method of analysis
4. Operation and maintenance
Concrete bridge configuration is usually made up of: 1. Superstructure (Bridge deck) and 2. Substructure The project focuses on the bridge deck that is simply supported and the advances or improvement made to reduce the problems associated with several joints in simply supported bride deck.
Bridge decks are considered as part of the highway or railway transportation system and its basic purpose is to satisfy the requirements of the transportation. Bridge decks are analyzed and designed to withstand extreme environmental forces, temperature etc. self weight, imposed loads and transient live loads.
2.1 Bridge Site Selection
Once a suitable bridge site has been selected, the engineer is faced with the problem of making the correct choice of bridge deck. The engineer has a range of bridge deck types and materials from which to select his
final solution. The basic analysis problem is the selection of the bridge deck type in terms of structural form and material which provided the most economical solution. The accessibility to the bridge site influences in a way the choice of bridge construction material and method of erection.
2.2 Intended Use of the Bridge Deck, Shape and Arrangement
In order to analyze bridge decks, there is need to understand the intended use of the bridge, the shape and the loading arrangement. It would be noted that the dynamic effect of foot bridge deck and highway bridge deck are not as much as the railway bridge. Once, the intended use of the bridge deck is determined the method of analysis has to be carefully selected either by manual calculations or by the use of computer software.
2.3 Method of Analysis
The choice of the method of analysis of bridgedeck follows after considering the following:
(i) The choice of a bridge deck (ii). The cross-section of bridgedeck. (iii). The loading conditions. (iv). The most economical design. (v). Are there any advantages in the adoption of most economical design. (vi). which analysis of bridgedeck that can be adopted to a particular site. (vii). Appearance (viii). Method of construction and capable contractor (ix). Materials availability.
(x). Drainage. (xi). Maintenance requirement.
(xii). Availability and lifting capacities. (xiii). Precast unit or cast in-situ. (xiv). Accessibility to site, mode of transportation and distance.
2.4 Operation and Maintenance
In analysis of bridge deck, safety is of paramount importance compared to construction cost. Also the maintenance cost, the method of construction, the type of loadings, the structural configuration are all interwoven for best method of analysis.
The effect of bearings, expansion joints and stiffness of structural elements are critical in the method of bridge deck analysis. The loading arrangements for worse effects on structural members need to be carefully considered, the load combinations and factor of safety also apply.
If a bridge deck becomes unfit for its purpose during its design life, it makes that particular section of the transport system unserviceable leading to diversions, fall in the capacity utilization of the network and expensive assessment and repair or replacement of the bridge. All these are as results of ineffectiveness in the method of analysis followed by design, construction method and construction supervision.
2.5 Types of Concrete Bridge Deck
Bridge deck can be classified into four categories, namely:- 1. The solid and voided slab (economic for less than 10m span), maximum depth 800mm. 2.The beam and slab (economic for less than 40m span). The box girder bridges (economic for greater than 40m span)
FIGURE 1.1: TYPES OF BRIDGE DECK
2.6 Loading of Bridgedecks
BS 5400: Part 1-14, 1983, [2] to [9]
Loads to be considered are:
1. Self weight of structures (Dead Load)
2. Superimposed dead load (surfacing, kerbs, etc)
SOLID SLAB VOIDED SLAB
BEAM AND SLAB BOX GIRDER
3. Longitudinal breaking/traction force 4. Impact load. 5. Wind load 6. Temperature 7. Shrinkage and creep
Different types of code determine the load on bridge structures e.g BritishCodes (BS), European Codes (Euro Codes), American Codes. BS is generally accepted in
Nigeria as majority of Nigerians are trained by British. Only vehicular loads and factor of safety would be briefly mentioned here, other loads could be found in BS5400 and British Design Manual Code, BD37/88, [9]. In BS5400 the following loads are considered:-
Permanent loads:
British Design Manual Code (BD/01):Part 14; Vol.1, section 3, 1990. [9]
These are defined as Dead Loads(cl 3.2.2) from the self weight of the structural elements and
Superimposed Dead Loads(cl. 3.2.3) from all other
materials such as road surfacing, water proofing, parapets, services, kerbs, e.t.c. Also included are loads due to imposed deformations such as shrinkage and creep.
Transient loads(cl 4.3.2):
British Design Manual Code (BD/01):Part 14; Vol.1, section 3, 1990. [9]
These are all loads other than permanent loads and are of short duration, such as traffic, pedestrian, temperature, wind loads and erection loads. Traffic load is divided into two parts. The normal traffic load
(HA) and abnormal traffic load (HB). In the case of railway live loads, RU is general railway loading for both goods and passenger, while RL is rapid transit passenger and light engineer work trains.
Highway Vertical Live Load a.) vertical load:
Clause 6.2.1 (i) HA- Uniform loading = 336 (1/L)0.67
L=bridge length under consideration For L=20m, HA (Udl) = 336 (1/20)0.67
= 45.1kN/m/notional lane
Clause 6.2.2 (ii) HB: 1 unit of axle load = 10kN 45 unit of axle load = 450kN
1 wheel load = = 112.5kN Factor of safety for material = 1.15 Factor of safety for loads:
Dead load (DL) = 1.15
Superimposed dead load (SDL) = 1.75
Live load (LL) for HB + HA loads = 1.3 Live load (LL) for HA load alone = 1.5 Live load (LL) for footway = 1.5
Load combination must be carefully selected based on code of practice and the worse effect in analysis is
considered in design as shown in fig 1.2: Deck Load and Arrangement (Page 12).
2.7 Factors Affecting the Structural Form of Concrete Bridge Deck
Bridge decks are frequently supported on bearings which transmit the loads to the abutments at the bridge deck ends or to piers or walls elsewhere [10]. Joints may be present to facilitate expansion or contraction of the deck at the ends or in the interior. Joints, however, have their disadvantages on bridge decks as follows:- 1. Maintenance of expansion joints due to wears and tears, and also blockage of openings of the joints.
2. Non smooth ride surface of deck at joints.
3.Non durability of bridge often associated with joints that are leaking which contaminate bearings or substructures with chloride contaminated water. 4.On the other hand, the durability of post tensioned
concrete bridges in which inadequate grouting of the ducts can lead to corrosion of the tendons. 5.Bridge decks that were easy to design are usually
simply supported spans but problems of leakages at joints and also bearings which require replacement many times over the lifetime of bridge. The advances, improvement or new development is use of few joints and bearings in bridge deck analysis. 6.Method of construction influences the distribution
of moment and force in bridge. Use of precast concrete and insitu concrete must be carefully selected to avoid failure at point of meeting in terms of shear, punching, cracks, relative deflection, slippery as a result of poor bond (inadequacy of reinforcement or rough surface) etc., hence, analysis must be carefully carried out.
2.8 Types of Bridge Decks and Advances (Improvement)
Different types of deck are as follows:
a)Beam and slab deck. b) Box girder deck. c) Incremental launch deck. d) Drop in span.
e)Integral bridge (deck monolithic with abutments and piers).F) Cable stayed bridge. g) Suspension bridge.
It should be noted that these types of decks can be combined to reduced cost depending on the condition of soil supporting piers and abutment and the profile of the bridge.
a) Beam and Slab Deck Structural Form
These are series of simply supported beams and slab on short span deck that is less than or equal to 40m. Different structural forms are as follows :-
1.Each span with bearing and expansion joint
(conventional). The bridge deck is simple to analysis,
GSJ: VOLUME 6, ISSUE 8, August 2018
355
The major disadvantage is too many joints and bearings that are no longer favoured in practice. Maximum moment is very high and most expensive in construction [10].As shown in fig. 1.3: Simply Supported Beam and Slab Convention (page 12).
2.9 Advances (Improvement) On Simple Supported Concrete Bridge Deck
Different structural forms are as follows:
1.Each precast beam with bearings at each ends and
slab continuous at supports.
This Bridge deck is simple and little bit tedious in analyses. It has advantage over the first case because the expansion joints have been eliminated. The reduction in maximum moment of beam and construction cost is negligible compared to span with expansion. The continuous slab has low structural stiffness and attracts low bending moment. There is a great concern among some designers about the integrity of this type of joints as it must undergo significant rotation during the service life of the bridge [10]. The analysis requires that the slab stiffness and length must be carefully selected to get reasonable percentage of reinforcement, as too much reinforcement may not indicate crack before collapse.See fig. 1.4: Simply Supported Beam and Slab with Continuous Slab at support. (Page 13)
2. Projection of Pier or Pier cap at support and continuous slab at support
The continuous slab at the support is supported underside by providing projected pier or pier cap shooting up to provide superstition support to the slab, thus making it more reliable but increases the cost of construction; but extra cost is justifiable when compared to continuous replacement of expansion joints during the service life of the deck. See fig 1.5: Simply Supported Beam and Slab with Continuous Slab on projected pier (elimination of joint), (page 13)
3. Precast beams and slab continuous over intermediate support with bearings
The bridge deck is simple to analyze and construct. Precast concrete or steel beams are placed initially in a series of simply supported spans. In-situ concrete is then used to make the finished bridge deck continuous over intermediate support. The in-situ concrete makes the beams continuous and also acts as diaphragm (cross beam). The only problem in the analysis is the inaccurate prediction of creep effect when precast beam is continuous with insitu concrete. However, experienced engineer will introduce a reduction factor to hogging moment for creep effect. See fig 1.6: Beam and Slab continuous over sliding bearings (page 13)
2.10 Lateral Load Distribution in Bridge Deck
Economy in bridge deck analysis and design can be achieved if the lateral load distribution characteristics can be accurately predicted [1], [11].
It has been found that ten (10) number girders (precast beam) is the number required for effective lateral load distribution for any bridge deck, any additional beyond ten (10) does not exist in lateral load distribution.
Optimum spacing of girders in bridge deck is obtained if girder is spaced at the width of one traffic lane, although bridge profile and other reasons come to play when selecting number of longitudinal deck girders (precast beam) as the efficiency of lateral distribution which depends on the number of the longitudinal girders, increasing with increase in the number of girders.
2.11 Studies of Interconnected Bridge Deck
Deck load distribution studies by Leonhardts and Makowski have led to the following conclusions about Grid Deck Bridges:
1.Except for reinforced concrete grid, a cross-girder is most effective when placed at mid-span of the bridge. 2.In reinforced concrete grillage, in which the torsional rigidity is more important, the effect of the position of the cross-girder is less pronounced, especially if there are several girders.
3.There is no improvement in the lateral load distribution, if more than 5 cross girders are used. It is considered by many bridge designers to be good practice, to have an odd number of cross girders, usually 1 or 3 for small span bridges and not more than 5 for large span bridges.
4.In steel bridges, because of the very low torsional rigidity of the cross girders, the influence of torsion rarely changes the stresses by more than a few % and the joints (even if they are welded) will behave as virtual hinges transmitting only forces and no moment.
5.The efficiency of lateral distribution depends on the number of the longitudinal girder.
6.It has been found that 10 number longitudinal girders is the maximum number required for effective lateral load distribution for any bridge deck, any additional girder beyond 10 does not assist in lateral load distribution.
7.Optimum spacing of girders in girder deck bridges is obtained if the girder is spaced at the width of one traffic lane.
8.Studies have shown that the middle third girders in a bridge deck carry comparatively less loads than the outer third girders [1]. Even when the HB vehicle is placed to produce maximum effect on the middle
third girders, that maximum loading is less than that produced on the outer thirds girders with the HB vehicle placed on the outer lane. This deck behavior could be utilized to great economic advantage in deck design by adopting mixed spacing for the girders in such a manner that the total maximum bending moment (i.e. Dead Loading bending moment, superimposed dead load bending moment and Live load bending moment) on the outer third girder is roughly equal to the maximum total bending moment on the middle third girder. The new Kaduna River Bridge would be used to illustrate the point.
3 METHOD OF BRIDGEDECK ANALYSIS
Different methods have been developed to solve this problem, namely;1.Orthotropic plate theory (Guyon Massonnet-Bares) [12]
2.Orthotropic plate theory (Design Curves) Morris and Little. 3. Simple Grillage. 4. Simple Analysis (Moment distribution and influence line method) 5. Finite element.6. Finite strip. 7. Space frame. 8. Finite difference
Two common methods are explained in the analysis of a simply supported bridgedeck. These are
(i) Guyon-Massonnet Bares Method (ii)Simplified Grillage Method
Guyon-Massonnet-Bares Method
The objective of load distribution is to assess the magnitude of the load sustained by each longitudinal member of the bridge deck and the extent to which the transverse members assist in distributing the load to the longitudinal members. The two extreme in terms of efficiency is represented by an isotropic slab (having the same elastic properties in all directions) and no torsion grillage. For no torsion grillage, load distribution is effected by Shear resistance at the joints. Slab distributes load by shear and torsion and this represent the optimum with regards to load distribution. In practice, reinforced concrete and prestressed decks will be between these two extremes [12].
Plate analysis of bridge deck has been carried out by the following:
1914 – Huber –R C slabs
1946 – Guyon – Torsionless deck
1950 – Massonet – torsion considered with tables for estimating load distribution coefficients. 1952 – Rowe - Practical application with 10% increase
in Massonet results to take into account of poission’s ratio.
1974 – Cusens – Extended application of Rowe by providing torsional moment coefficients in form of design curves.
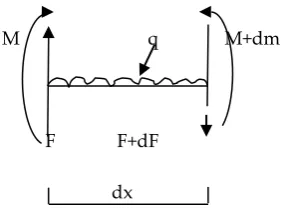
The Plate Equation:
M q M+dm
F F+dF
dx
Fig 3.01: Plate Equation
The orthotropic plate equation forms the basis of the Guyon-Massonnet-Bares method of assessing the maximum longitudinal and transverse bending moments in bridge decks using coefficient of lateral distribution.
Considering the equation of a simple beam Fig (3.01), for the algebraic sum of vertical forces qdx + (F + dF) – F = 0
:. qdx + dF = 0
= -q
For the algebraic sum of moments to be zero and ignoring second order terms
M - (M + dM) + Fdx = 0 Fdx - dM = 0
= F
Differentiating w.r.t. x
= = -q But M = EI
Where W = deflection of the beam :. = EI = -q
EI = -q (3.01)
In order to visualize the behavior of a plate influence, it is convenient to consider it in terms of two sets of beam strips (Fig (3.02).
For the above plate simply supported on 4 side q = qx + qxy
Substituting for q in (3.01) we have: :. + = -( )
(3.02)
y
x
q
xq
yGSJ: VOLUME 6, ISSUE 8, August 2018
357
If poisons ratio is taken into account then EI is replaced by D where
D = where t = plate thickness and
v = poisons ratio (approx 0.15 for concrete) For 1 – v2 ̃ 1
The equation of equilibrium of an element of slab to bending moment and twisting moment (Refs. Timoshenko S., Woinowsky -Kriegger S., 1987-Theory of Plates and Shells (page 81) and [13], [14], [15] and [16] is:
+ -
= -q (x,y)
(3.03)
It can be written in the form
+
+ = (3.04) where, w = deflection
In equation (3.03) the first two terms represent ideal beam strip action and the third involving twist is:
It has been assumed that the elastic properties of the material of the plate are the same in all directions. For the case of orthotropic plate the equation can be written in the form:
A + B + C = q
Where A, B, C relate to the flexural and torsional properties of the system.
P1 sin пx/L
x
The system of the simple bridge type as shown in Fig (3.03) is simply supported along the edges X = 0; X = L, and free along the remaining edges y = ±b. The system is acted upon by a sinusoidal line-load in the x-direction. The line along which the load is acting, called the “Load-line” and is parallel to the x-axis at a distance “e” from it, where “e” is the “load eccentricity” due to the line load.
P (x) = P1Sin
(3.06) The system deflects to a surface
w (x,y) = w(y) Sin
(3.07)
The x-direction, is defined again by a sinusoidal law. If the load P(x), as defined by equation (3.06) is distributed over the whole surface width 2b of the system, then the intensity of this load, uniform in the y-direction becomes:
Po (x) = PoSin
Where: Po =
Due to this load, the system deflects to a cylindrical surface defined by the equation:
Wo (x) = WoSin
(3.08) The ratio of the two deflections, as produced by the line-load P1 and by the distributed load Po respectively
is called “Principal Coefficient of lateral distribution”. Denoting the coefficient by K.
K = =
(3.09)
The value of the coefficient, k depends on the following factors: a) On the parameter of lateral stiffness (ө)
b)On the parameter of torsion (α)
c)On the relative eccentricity of the line-load e/b
d)On the relative ordinate of the considered point y/b The entire above factor are dimensionless.
The average deflection with respective to a given cross-section of the system is defined by the integral.
∫
(3.10)
Dividing both sides by Wo
∫
∫
Equation (3.11) states that the average ordinate of the influence line of k shall be equal to unity.
Equation (3.10) requires that average ordinate of the influence line of W shall be equal to the value of Wo,
i.e. the deflection Wo produced by the load Po =
distributed uniformly over the entire width 2b of the system.
Adopt numerical integration to evaluate equation (3.11) sub-divide the width 2b into 8 equal portions of
x
y
L
e
a
W(y)
Fig 3.03: Load Line Eccentricity
length 2b/8. This will result in 9 ordinates and the integral can either be evaluated according to Simpson’s rule or trapezoidal rule.
Recap: Simpson’s Rule:
ʃsads = (1st + last + 4sum of even + 2xsum of odds)
h =
∫
(3.12)
Equation (3.12) can be written as:
∫ ∑ ∑
n = 1,3,5,7 m = 2,4,6
Maxwell’s Reciprocal Theorem holds true for distribution coefficients
i.e. k(a,b) = k(b,a)
The coefficient k depends also on the torsional parameter α.
In order to dispense with the necessity of calculating kα for every particular value of α, Massonnet deduced
on the basis of a great number of numerical investigations the interpolation formula
kα = ko+(k1-ko) √ (3.14)
Where ko, k1 denote the values of kα relating to α = o
and = 1 respectively.
Practical Calculation of kα is thus based, apart from α,
only on the following numerical values. Ko = k(α )and
K1 = k(α ⁄ ) and
Load Distribution Example
Ө = (i/j)¼ =
√ = (i/j)0.25 Where b = half width of deck 2a = span of deck
i = 2nd Moment of area/unit width
j = 2nd Moment of area/unit length
α =
Where G = ̃ ½E = shear modulus
v = poisons ratio
E = modulus of elasticity of concrete Io = = torsional rigidity/unit width
P = spacing of longitudinal beams q = spacing of x-girders
Table 1: coefficient of torsional inertia
a/b ß
1.0 0.141
1.2 0.166
1.5 0.196
1.75 0.213
2.0 0.229
2.25 0.24
2.5 0.249
3.0 0.263
4.0 0.281
5.0 0.291
10.0 0.312
0.333
For I and T sections the torsional inertias of each individual rectangular section are added. Considering a single rectangular section the torsional inertia is given by β a(b)3
where a> b.
α = , G ̃ ½E
If the above expression for α is applied to a slab using the thin rectangular section formular, then for a thickness of t,
α = ( )
( )
But α varies from 0 to 1.
This anomaly arises from the fact that the overall continuity of the slab in the longitudinal and transverse direction is neglected. The values of io and
jo to be used for top slab of beam and slab deck should
be halved which gives io and jo equal to .
It is suggested by Massonnet that the equivalent slab approach is accurate for any grid work of the bridge type providing there are at least three main girders. For any number of intermediate cross girders the assumption of continuously distributed transverse rigidity leads to only very small errors; that only one intermediate girder is sufficient.
Maximum Deck Bending Moment
For the calculated values of Өand , tables for values of ko and k1 are prepared from tables prepared by the
Guyon – Massonnet – Bares.
Then, k = ko + √ (k1 – ko) based on new ko and k1
obtained previously.
The maximum longitudinal moment Mx (total) is
calculated based on total load on deck.
The mean longitudinal moment Mx (mean) = (total)
Maximum deck bending moment (Mx)
Mx =1.1 Mx (mean) x W1k
W = 2b = width of deck slab
w1 = width of slab for T-beam under consideration
GSJ: VOLUME 6, ISSUE 8, August 2018
359
Experimental Programme
To reduce the volume for the concrete bridgedeck analysis,the Guyon-Massonnet-Bares Methodis used.
The Guyon-Massonnet-Bares Method
The Guyon-Massonnet Method is the method employed, which uses the approach of orthographic plate analysis, for load distribution analysis of bridge decks.
The main objective of a load distribution analysis is to assess how much of the HB load is sustained by each of the longitudinal members of the bridge deck and the extent to which the transverse members assist in distributing the load to the longitudinal members.
Analysis Procedure
The procedure is very long and requires many pages, so it can only be summarized .
i) Determine the flexural and torsional parameters of the bridge deck.
For deck span, L = 2a For deck width, W = 2b
Adopting the load combination analysis of worse severe effect.
General Lane Arrangement
The number of lanes needed for the analysis of this bridge deck is determined as [3] to [9]
Adopt equal spacing of beams S = = 2.20
Use a spacing of 2.250m and end cantilevers of 1.000m
Lane width = 2.25m
General Data on Bridge Deck
Following the selection of bridge deck structure (bridge deck type), in terms of structural form, the materials, and the loading condition the underlisted data are used in the bridge deck analysis.
British Design Manual Code (BD 37/88) Vol.1. Part 14. Loads for Highway Bridges. 2) BS 5400, part 4, 1990. 3) BS 8110, part 1, 1997 [3], [9].
Bridge spans: 20.00m
Carriageway width: 11.00m
Loadings: HA + 45 units of HB
Surfacing: 0.05m
Load Cases Considered in Analysis
Case 1: Dead load
Case 2: Superimposed Dead load Case 3: HA+45 units HB loads Case 4: Local effect of wheel load Case 5: Temperature Effect Case 6: Wind load effect
Case 7: Braking/Traction load
Deck Loading (Transverse Loading) HA Loading
Carriageway width = 8.0m
Width of lane =
= 2.67m (lane width) Bridge deck length, L= 20 m
HA loading is made of:
a)vertical load:
Clause 6.2.1 (i) HA- Uniform loading = 336 (1/L)0.67
= 336 (1/20)0.67
= 45.1kN/m/notional lane HA Udl across notional lane = 45.1kN/2.67
= 16.89kN/m2
b)KEL = 120kN/m = 120kN/m/2.67 = 44.94 kN/m2
c) Clause 6.2.2 HB: 1 unit of axle load = 10kN 45 unit of axle load = 450kN 1 wheel load = 450/4 = 112.5kN
Adopt static distribution to transfer loads to the girders comprising the girder spacing and the lane width, it can be seen that a girder carries a lane load.
Table 2:Number of notional lanes BS 5400 (Part 14: British Standard Code (BD37/01), 1990 [3], [9]
Carriageway width Number of notional lanes
5,000 up to and including 7.50 2
Above 7.50 up to and including 10.95 3 Above 10.95 up to and including 14.60 4
Above 14.60 up to and including 18.25 5 Above 18.25 up to and including 21.90 6
Material Properties: Precast Concrete Beam
Cube strength at 28 days Uw = 52.5N/mm2
Cube strength at 28 days Ut = 52.5N/mm2
Maximum permissible stress[17]
comp tension
At transfer of prestress Ut /2 - 1.00 N/mm2
Under working load Uw/3 0
In-Situ Concrete Slab
Cube strength at 28 days, Uw = 30.0N/mm2
Minimum permissible stress:
comp tension
Under working load, Uw/3 no limit
Section Properties Flexural Properties Precast Beam
410
510
Depth of beam = 1475
Area of beam = 445.6x103mm2
Height of centroid above Soffit yb = 707mm
Second moment of area Ip = 106607x106mm4
Radius of gyration r = 489mm Section moduli
Top fibre, ƻt = 138.81 x 106mm3
Bot. fibre, ƻb = 150.79 x 106mm4
Composite Section
2250
Modular ratio, m = √ = 0.76 Total depth = 250 + 1475 = 1725mm
Equivalent area of slab = 0.76x250x 2250 = 427500mm2
Area of precast section = 445600mm2
Height of centroid above soffit yb =
= 1144.24mm Second moment of area
Ic = (0.76 x2250 x 2503)/12 +427500 (1600 –1144.24)2
+106607x 106 + 445600 (1144.24 -707)2
= 307.31 x 109mm4
Section moduli
Bottom of precast, ƻb=
=268.37 x 106mm3 Top of precast, ƻt=
= 929.12 x 106mm3 Top of insitu, ƻt insitu =
= 529.16 x 106mm3
Transverse In-Situ Top Slab
Second moment of area I = 1/12 x 1000 x 2503
= 1302.08 x 106mm4/mlength of slab
Torsional Properties
The torsional rigidities are found by considering the individual rectangles and adding these with the proviso that for rectangles representing 2-way continuous sections only half the torsional rigidity is used.
ɳ = kc3d where c ˂ d
Longitudinal Direction
Torsional inertia in the longitudinal direction is calculated using the idealized section below
2250k = 0.308
k= 0.179
k = 0.286
k = 0.219
GIo = 1/2G x 0.308 x 2503 x 2250 + 0.179 x 307.53 x 410G
= 0.286 x 2003 x 890G + 0.219 x 277.53 x 510G
= (5414.06 + 2133.89 + 2036.32 + 2386.33) x 106G
= 11971 x 106G mm4
:. Gio =
= 5.32 x 10⁶G mm4/m
Transverse Direction
Gio =
= 2.602 x 10⁶G mm4/m
Flexural And Torsional Parameters
Longitudinal section inertia
i = = 136.58 x 106mm4/m width
In-situ transverse slab inertia
j = 1/12 x 1000 x 2503 = 1.302 x 106mm4/m
Take effective width of bridge = actual width, b = 11.0m, Length, a = 20.00m
Hence, Ө = √ =11.0/2x20√ =0.88
and α = √ =
√ = 0.129 [G/E = 0.435]
1475
2
50
1475
200 1
55
760
106
255
2
7
7
.5
8
9
0
30
7
.5
26
GSJ: VOLUME 6, ISSUE 8, August 2018
361
Dead Load
Self weight of beams = 0.4456 x 25 = 11.14KN/m Deck slab (2), (3)&(4) = 0.25 x2.25 x 25 = 14.06KN/m (1) & (5 = (1.0 + 0.5 x2.25) x 0.25 x 25 = 13.38KN/m
Superimposed Dead Load
Surfacing (50m thick), P1 = 0.050 x 24 = 1.20KN/m
Parapet P2 = 0.25 x 0.30 x 24 = 1.80KN/m
Parapet P3 = 0.20 x 1.0 x 24 = 4.80KN/m
Railing P4 = take as = 1.00KN/m
The reactions on the beams are as follows: R(1) = 4.80 +1.00 +1.80 x
x 1.2 x 1.75 x
+ = 10.95KN/m
R(2) = 0.40 + 1.28 + 1.2 x
- - = -0.74KN/m
R(3) = 1.20 x 2.25 + 2 x
= 4.45KN/m
R(1) + R(2) + R(3) + R(4) + R(5) = 2 x10.05-2x0.74+4.45
= 24.87KN/m
Total loads = 8x1.20 + 2x1.8x2x4.8+2x1.0 = 24.80KN/m
Live Load
British Design Code (BD 37/01: Part 14: Vol. 1. Section 3, 1990) [9], [18]
KEL = 120KN/m
Clause 6.2.1 (i) HA- Uniform loading Clause 6.2.2 HB: 1 unit of axle load = 10KN
45 unit of axle load = 450KN HA udl = 30 x 3/8 = 11.25KN/m HA kel = 120 x 3/8 = 45.0KN/m
HB 45 units (each axle) = 45 x 10 = 450KN/m (1 unit of each axle load = 10KN)
Maximum Longitudinal Moment Dead load
Precast beams Mg1 =
= 557.0KN
Deck slab (2), (3) (4), Mg2= = 703.0KN/m
(1) & (5), Mg3=
= 669.0KN/m
Superimposed Dead Load
Beams (1) & 5, Mp= = 547.5KN/m
Beam (2) Mp=
= 222.5KN/m
Ha Loading
HA kel = 45KN
HA udl
2.67m 2.67m 2.67m
11.25KN/m 11.25KN/m
HA HA 1/3 HA= 3.75KN/m
Max gross moment M=202/8(11.25x5.33+3.75x2.67)+ ¼
x20 x 45
=3723.75KNm Average gross moment = 3723.75/8
= 465.47KNm/m
= 465.45 x 2.25 = 1047.26KNm/beam Full HA average moment = 202/8 x 11.25 =
562.5KNm/m
= 1265.63KNm/beam
Hb Loading
Loading Positions
CVEHICLE
1.8 1.50 1.5 3.0 1.8
4P 4P 4P 4P
X C BRIDGE
RA RB
LONGITUDINAL POSITIONS
C 3.00 1.50
1.01.0 1.0
P P P P
-b -3b/4 -b/2 -b/4 0 +b/4 +b/2 +3b/4 +b
TRANSVERSE POSITIONS
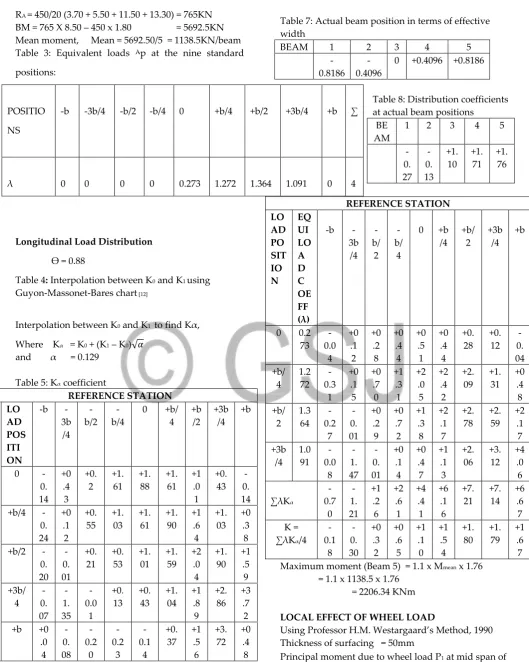
RA = 450/20 (3.70 + 5.50 + 11.50 + 13.30) = 765KN
BM = 765 X 8.50 – 450 x 1.80 = 5692.5KN Mean moment, Mean = 5692.50/5 = 1138.5KN/beam Table 3: Equivalent loads ۸p at the nine standard positions:
Longitudinal Load Distribution
Ө = 0.88
Table 4: Interpolation between K0 and K1 using
Guyon-Massonet-Bares chart [12]
Interpolation between K0 and K1 to find Kα,
Where Kα = K0 + (K1 – K0)√
and α = 0.129
Table 5: Kα coefficient
REFERENCE STATION K α LO AD POS ITI ON
-b -3b /4 -b/2 -b/4
0 +b/ 4 +b /2 +3b /4 +b
0 -0. 14 +0 .4 3 +0. 2 +1. 61 +1. 88 +1. 61 +1 .0 1 +0. 43 -0. 14 +b/4
-0. 24 +0 .1 2 +0. 55 +1. 03 +1. 61 +1. 90 +1 .6 4 +1. 03 +0 .3 8 +b/2
-0. 20 -0. 01 +0. 21 +0. 53 +1. 01 +1. 59 +2 .0 4 +1. 90 +1 .5 9 +3b/ 4 -0. 07 -1. 35 -0.0 1 +0. 13 +0. 43 +1. 04 +1 .8 9 +2. 86 +3 .7 2 +b +0
.0 4 -0. 08 -0.2 0 -0.2 3 -0.1 4 +0. 37 +1 .5 6 +3. 72 +0 .4 8
Table 6: Distribution coefficient k’ for max longitudinal moment
Table 7: Actual beam position in terms of effective width
BEAM 1 2 3 4 5
-0.8186
-0.4096
0 +0.4096 +0.8186
Table 8: Distribution coefficients at actual beam positions
BE AM
1 2 3 4 5
-0. 27 -0. 13 +1. 10 +1. 71 +1. 76
Maximum moment (Beam 5) = 1.1 x Mmean x 1.76
= 1.1 x 1138.5 x 1.76 = 2206.34 KNm
LOCAL EFFECT OF WHEEL LOAD
Using Professor H.M. Westargaard’s Method, 1990 Thickness of surfacing = 50mm
Principal moment due to wheel load P1 at mid span of
slab Mox=
POSITIO
NS
-b -3b/4 -b/2 -b/4 0 +b/4 +b/2 +3b/4 +b ∑
λ 0 0 0 0 0.273 1.272 1.364 1.091 0 4
REFERENCE STATION LO AD PO SIT IO N EQ UI LO A D C OE FF (λ)
-b -3b /4 -b/ 2 -b/ 4
0 +b /4 +b/ 2 +3b /4 +b
0 0.2 73 -0.0 4 +0 .1 2 +0 .2 8 +0 .4 4 +0 .5 1 +0 .4 4 +0. 28 +0. 12 -0. 04 +b/ 4 1.2 72 -0.3 1 +0 .1 5 +0 .7 0 +1 .3 1 +2 .0 5 +2 .4 2 +2. 09 +1. 31 +0 .4 8 +b/ 2 1.3 64 -0.2 7 -0. 01 +0 .2 9 +0 .7 2 +1 .3 8 +2 .1 7 +2. 78 +2. 59 +2 .1 7 +3b /4 1.0 91 -0.0 8 -1. 47 -0. 01 +0 .1 4 +0 .4 7 +1 .1 3 +2. 06 +3. 12 +4 .0 6 ∑λKα -0.7 0 -1. 21 +1 .2 6 +2 .6 1 +4 .4 1 +6 .1 6 +7. 21 +7. 14 +6 .6 7 K =
∑λKα/4
GSJ: VOLUME 6, ISSUE 8, August 2018
363
Where P1 = 112.5KN
c = effective diameter of loaded area x 2 thickness of surfacing = (190 +100)
S = spacing of beams =2250mm Mox =
= 0.2984 P1
= 0.2984 x 112.5 = 33.57 KNm/m
Moy = Mox - 0.0676 P1
= 33.57 – 0.0676 x 112.5 = 25.9KNm/m
Due to continuity in transverse direction of slab over beam (effects of encastring the support), the Principal moments become:
M’ox = Mox - 0.0699P1
= 33.57 - 0.0699 x 112.5 = 25.71KNm/m
M’oy = Mox - 0.1063P1
= 33.57 – 0.1063 x 112.5 = 21.61KNm/m
Moments
Support : M = 19.84 + 8.93 = 28.77KNm/m Span : M = 40.77 + 1.94 = 68.0KNm/m Dist. : M = (longitudinal design moment)
= 1.30 x 21.61 = 28.09KNm/m
Reinforcement
British Standard BS 8110 – 1997, [17], [19],[20], [21] As = M/ƻfy
Main reinft. Limit: As min. = 0.25% Asmax = 4%
fcu = 30 N/mm2 fy = 410 N/mm2
h = 250mm b = 1000mm; Ø = 16mm
Support As=
= 572mm2/m, (provide Y16-175(T))
Span As=
= 1531mm2/m, (provide Y20-175(15))
Dist. As=
= 691mm2/m, (provideY12-150(T&B)
Note
1) Bottom reinforcement to be placed on top of precast plank which acts as cover
2) Cover for top steel = 25mm
Temperature EFFECT
(BS 5400: PART 14; 1990, British Design code (BD
37/01):Vol.1 section 3), [3]
2250250
125
455.76
Neutral axis1600
1144.24
510
Sectional properties
Beam section
Depth of beam = 147mm
Area of beam = 445600mm2
Height of centroid of beam above soffit, yb = 707mm
Second of moment of area, Ip = 106607 x 106mm4
Radius of gyration, r = 489mm
= 250mm
Composite Section
Total Depth of beam + slab = 1475 + 250 = 1725mm Equivalent of area of slab = 0.76x250x2250
= 427500mm2
Area of precast section (Beam) = 445600mm2
Height of centroid above soffit, yb = (slab + beam)
= 1144.24mm
Second of moment of area, Ic = 307.31 x 104mm4
Moment due to temperature effect; M = ƐAEd
Using the relevant code for concrete slab, groups 3 & 4;
Ɛ = 100 x 10-6/oc
E = 26 x 106N/mm2
d = distance between centroid of concrete slab and neutral axis of composite section
= 455.76mm
:. M = 100 x 10-6 x .5625 x 26 x 106 x 0.45576
= 666.55KN/m
Wind Load Effect
(BS 5400: PART 14; 1990,British Design Code BD 37/01:Vol.1 section 3), [9]
Site hourly mean wind speed Vs = VbSpSdSa
Where Vb = Basic hourly mean wind speed
Sp = Probability factor
Sd = Direction/speed factor
Sd = Altitude factor
Vs = 35 x 1.00 x 1.00x 1.6 = 56.00m/s
Dynamic pressure:
q = 0.613 V2c
= 0.613 x 56
255 105
760
155
200 410
200
= 1.92 KN/m2 Transverse wind load:
Pt = qACD
A = side area of parapet beam and slab x 20m = (1.00 + 1.475 + 0.25) x 20 = 54.5m2
Ratio of deck width and depth = 11.0/2.725 = 4.04 From relevant BS Code, chart, CD = drag coeff. =1.4
:. Pt = 1.92 x 54.5 x 1.4 = 146.5KN
Design = 1.6.50 x 1.5 = 219.75KN Moment due to Pt:
M = F.d = Pt.d = 219.75 x 0.45576
= 100.15KNm
Longitudinal wind load
(i) Nominal longitudinal wind load or superstructure (Bridge deck)
PLS = 0.25 qACD
= 0.25 x 1.92 x 54.5 x 1.4 = 36.624 KN
(ii)Nominal longitudinal wind load on the live load (ie. Load on 2.5m high vehicle)
PLL = 0.5 qACD
= 0.5 x 1.92 x (2.5 x 20) x 1.45 = 69.6 KN
Total longitudinal wind load = 36.624+69.6 =106.22 KN Design = 106.22 x 1.5 = 159.33 KN
Moment due to PLL + PLS;
M = F.d = (PLL + PLS) x d
= 159.33 x 0.45576 = 72.62 KNm
Breaking/Traction Force
BS 5400 Parts 1-9, 1990, Vol.1 section 3 From relevant BS Code; [3] to [9] HA = 8.00 x15.0 + 200 = 320 KN< 700KN HB = 0.25 x 4 x 450 = 450KN < 700KN Use higher value between HA and HB Adopt 450 KN
Design = 450 x 1.5 = 675 KN
Moment due to Breaking/Traction Force: M = F.d
= 675 x 0.45576 = 307.64 KNm
Check For Deflection
Self weight of beam = 0.4456 x 25 = 11.14KN/m Self weight of slab (max.) = 0.25x2.25x25 = 14.06KN/m
= 25.20KN/m
Ip (beam) = 106607 x 106mm4
Ic (beam + slab) = 307.31 x 109mm4 Deflection due to self weight of beam
ɗ = 5/384 x wl4/EI
= 5/384 x 11.14 x 204/28 x 106 x 0.106607 = 8mm Deflection due to beam + slab
ɗ = 5/384 x 25.20 x 204/28 x 106 x 0.30731 = 6mm
Allowable deflection:
L/250 =20,000/250 = 80mm > 8mm Ok
Pre-camber not required as beam deflection is negligible
Bearing Design
Properties of Glacier Plain Elastrometric[9], [10] Pad Bearing to BS5400 Part 9, 1990
Dimension = 50 x 320 x 12 Permissible vertical load = 817.0KN
Permissible Rotation = 0.00065 rad/100KN Permissible shear deflection = 8.4mm
(a) Check for vertical load
Max. service vertical load = 765KN +(Transverse positions, RA=765KN,Pg.9)
:. Max. service vertical load = 765KN < 817.00KN Ok
(b) Check for displacement
Actual displacement:
ɯ = HT/n.A.G
where T = bearing thickness = 12mm n = No of bearing = 5
A = Area f Pad = 400 x 400 = 0.16m2
G = Shear Modulus = 0.1KN/cm2
H = Horizontal forces = 550.18KN
ɯ = 550.18 x 12/5 x 50 x 32 x 0.1 = 8.25 < 8.4mm Ok
(c) Check for Rotation(BS 5400, Part 9; 1990), [9],[10]
Rotation due to DL = 0.00025077 Rotation due to SDL = 0.00001287 Rotation due to LL = 0.0007313 Rotation = 0.00099489/765 = 0.0009949
= 0.00013005 rad/100KN < 0.00065 rad/10KN Ok
Selected bearing is adequate
4 CONCLUSION
In selecting method of analysis for simply supported concrete bridge deck, there is need to understand bridge in terms of aesthetics, planning, loadings, economy, safety, structural theory, flexibility, articulation, modeling, method of construction, restraints conditions, expansion joints, types of foundation, types of substructures, types of superstructures, length and width, environmental factors like hydraulics, soil-structure interaction, collision and seismic (earthquake) as bridge engineer is architect, analyst, designer and contractor.
GSJ: VOLUME 6, ISSUE 8, August 2018
365
or finite element for Box Girder or Beam and Slab Bridge. The best method is use of computer programme software which has passed through enormous research, fast and user friendly.
Recommendation
The use of computer programs is widely used nowadays because of it users friendly, fast and reliable results. However, much has to be done not
only on how to use computer for concrete bridge deck analysis but to really understand the theory behind it, the basic calculations for input data and interpretation of results for proper design.
FIGURE 1.2: Deck Loading Arrangement
FIGURE 1. 3: Simply Supported Beam And Slab (Conventional)
GSJ: VOLUME 6, ISSUE 8, August 2018
367
FIGURE 1.5: Simply Supported Beam With Continuous Slab On Projected Pier (Elimination Of Joints)
Figure 1.6: Beam And Slab Continuous Over Sliding Bearings
REFERENCES
*1+ Etteh Aro & Partners, 1990 “Short Course on Bridge Design” *2+ BS 5400: Part 1, 1978: General Statement “Steel, Concrete and
Composite Bridges”.
[3] BS 5400: Part 2: 1978; specification for loads “Steel, Concrete and Composite Bridges”.
[4] BS 5400: Part 1- 4: 1990: Code of Practice for design of concrete bridges “Steel, Concrete and Composite Bridges”.
[5] BS 5400: Part 5: 1979: Code of practice for design of composite bridges “Steel, Concrete and Composite Bridges”.
[6] BS 5400: Part 6: 1999; specification for material and workmanship, “Steel, Concrete and Composite Bridges”. *7+ BS 5400: Part 7: 1978,“Specification for materials and
workmanship, concrete, reinforcement and prestressing tendons”.
*8+ BS 5400: Part 8: 1990, “Recommendations for materials and workmanship, concrete, reinforcement and presetressing tendon”s.
[9] British Design Manual: BD 37/01 Volume 1, section 3, Part 14, Loads for Highway Bridges “Design Manual for Roads and Bridges”.
[10] BS 5400: Part 9: 1990, “Bridge bearings”, section 9.1: Code of Practice for design of bridge bearing, section 9.2:
specification for materials, manufacture and installation of bridge bearings.
[11] Narendra T., 1980 “Design of Modern Highway Bridges” [12] Guyon-Massonnet-Bares Method, 1961 “Analysis of Beam
grids and Orthotropic Plates”
[13+ Timosheuko S. P., and Goodier J. N, 1970 “Theory of Elasticity”. Third edition.
[14] Timoshinko, S.P and Gere, J. M, 1961. Theory of Elastic stability, 2nd edition, McGraw Hill book company, New York.
[15+ Reddy, J.N, 2007, “Theory and Analysis of elastic plate and shells”, CRC Press, Taylor and Francis.
[16] Timoshenko, S. and Woinowsky – Krieger, S, 1959. Theory of Plates and Shells, McGraw Hill New York.
[17+ Menn. C., 1986 “Prestress Concrete Bridges”
[18+Highway Agency, 1994. “Design Manual for Road Bridges”. [19] BS 8110 – 1: 1997. “Use of Concrete Structures”
[20] Charles E. R. and James C. S, 2005, Reinforced Concrete Designer’s handbook, tenth edition.
[21] Negi L.S., 1978, Structural Analysis