Big Data Research 2 (2015) 166–186
Contents lists available atScienceDirect
Big
Data
Research
www.elsevier.com/locate/bdr
Reference
Architecture
and
Classification
of
Technologies,
Products
and
Services
for
Big
Data
Systems
Pekka Pääkkönen
∗
,
1,
Daniel Pakkala
1VTT Technical Research Centre of Finland, Kaitoväylä 1, 90570, Oulu, Finland
a
r
t
i
c
l
e
i
n
f
o
a
b
s
t
r
a
c
t
Article history: Received22April2014
Receivedinrevisedform18December2014 Accepted11January2015
Availableonline2February2015 Keywords:
Bigdata
Referencearchitecture Classification Literaturesurvey
Many business cases exploiting big data have been realised in recent years; Twitter, LinkedIn, and Facebook areexamples ofcompaniesinthe socialnetworking domain.Other bigdata usecases have focused on capturing of value from streaming of movies (Netflix), monitoring of network traffic, or improvementofprocessesinthemanufacturingindustry.Also,implementationarchitecturesoftheuse cases have been published. However, conceptual work integrating the approaches into one coherent reference architecture has been limited. The contribution of this paper is technology independent reference architecturefor big data systems, whichis based onanalysis of published implementation architecturesofbigdatausecases.Anadditionalcontributionisclassificationofrelatedimplementation technologiesand products/services, whichisbasedonanalysis ofthe publishedusecases andsurvey of related work. The reference architecture and associated classification are aimed for facilitating architecturedesign and selectionoftechnologiesorcommercialsolutions,when constructingbig data systems.
©2015TheAuthors.PublishedbyElsevierInc.ThisisanopenaccessarticleundertheCCBY-NC-ND license(http://creativecommons.org/licenses/by-nc-nd/4.0/).
1. Introduction
Many big data use cases have been realised, which create addi-tional value for companies, end users and third parties. Currently, real time data is gathered from millions of end users via popular social networking services. For example, LinkedIn [1]collects data from users, and offers services such as “People you may know”, skill endorsements or news feed updates to end users based on analysis of the data. Another example is Netflix, which uses big data for providing recommendations and ranking related services to customers [2]. Twitter uses collected data for real time query suggestion and spelling corrections of their search algorithm [3]. Analysis of collected data also increases understanding of con-sumers, which is an important asset for the big data companies. Value from data can also be extracted with other applications such as monitoring of network traffic [4]or improving manufacturing process of digital displays [5].
A wide variety of technologies and heterogeneous architectures have been applied in the implementation of the big data use cases. The publications have mainly concentrated on describing architec-tures of individual contributions by large big data companies such
*
Correspondingauthor.E-mail addresses:pekka.paakkonen@vtt.fi(P. Pääkkönen),
daniel.pakkala@vtt.fi
(D. Pakkala).1 Tel.:+358207227070.
as Facebook [6] or LinkedIn [1]. On the other hand, architectural work combining the individual reports into one coherent reference architecture has been limited, although the first contributions have been made [7–10]. Technology independent reference architecture and categorization of related implementation technologies and ser-vices would be valuable for research and development of big data systems.
The contribution of this paper is reference architecture for big data systems, and classification of related technologies and prod-ucts/services. First, big data research, reference architectures, and use cases are surveyed from literature. Subsequently, the design of reference architecture for big data systems is presented, which has been constructed inductively based on analysis of the presented use cases. Finally, a classification is provided for the purpose of creating an overall picture of big data research, related technolo-gies, products, and services.
The structure of the paper is as follows: Material and methods of the study are described in Section 2. Theoretical background is provided in Section 3. Design and construction of the reference architecture is presented in Section 4. Classification of big data technologies and commercial products/services, and survey of re-lated work are provided in Section 5. The results are analysed in Section 6and discussed in Section 7. A conclusion is provided in Section 8. The appendices include: a detailed description of the reference architecture (Appendix A), a detailed description of the http://dx.doi.org/10.1016/j.bdr.2015.01.001
P. Pääkkönen, D. Pakkala / Big Data Research 2 (2015) 166–186 167
research method (Appendix B), and references to surveyed com-mercial products and services (Appendix C).
2. Materialandmethods
The overall goal of this work is to facilitate realisation of big data systems. When a big data system is realised, important con-siderations include architecture design of the system, and utiliza-tion of underlying technologies and products/services [11]. The goals of this work are: a.) design technology independent reference architecture for big data systems b.) classify related technologies and products/services with respect to the reference architecture.
Reference architecture would be useful in the following ways: It should facilitate creation of concrete architectures [12], and in-crease understanding as an overall picture by containing typical functionality and data flows in a big data system. Classification of technologies and products/services should facilitate decision mak-ing regarding realisation of system functionalities. Also, it would be important to understand architecture and performance charac-teristics of related technologies. The following research questions are posed:
The first research question: Whatelementscomprisereference
ar-chitectureforbigdatasystems?
The second research question: Howtoclassifytechnologiesand
products/servicesofbigdatasystems?
The reference architecture for big data systems was designed with inductive reasoning based on the published use cases described in Section3.3(research question 1). Particularly, functionality, data flows, and data stores of implementation architectures in seven big data use cases were analysed. Subsequently, reference architecture was constructed based on the analysis. The method for reference architecture design is described in detail in the Appendix. A lit-erature survey was used for answering to the second research question.
3. Theory
Section3.1presents earlier surveys of big data. Research on big data reference architectures is presented in Section3.2. The latest reports of big data use cases are introduced in Section3.3. Finally, a summary of related work in presented in Section3.4.
3.1.Bigdataresearch
Begoli [13] conducted a short survey of state-of-the-art in ar-chitectures and platforms for large scale data analysis. The survey covered adoption of related technologies, platforms for knowledge discovery, and architectural taxonomies. Chen et al. presented a comprehensive survey of big data [14]. The topics of the survey covers related technologies, generation and acquisition of data, storage, applications, and outlook to the future. Chen and Zhang also surveyed big data [11]. Their work focused on big data oppor-tunities and challenges, techniques and technologies, design prin-ciples, and future research. Wu et al. provided a framework for big data mining [15]. The authors proposed HACE (Heterogeneous, Autonomous sources, Complex and Evolving relationships among data) theorem for characterizing big data. The authors also pre-sented a three layer framework for big data processing, which is comprised of big data mining platform, semantics and application knowledge, and mining algorithms. Finally, Cuzzocrea et al. dis-cussed Online Analytical Processing (OLAP) over big data, big data posting and privacy as part of big data research agenda[16].
3.2. Referencearchitectureforbigdatasystems
A framework for design and analysis of software reference ar-chitectures has been presented [12]. The framework contains a multi-dimensional classification space, and five types of reference architectures. It is claimed that architecture design based on the classified reference architectures should lead to better success. Also, empirically-grounded design of software reference architec-tures has been presented [17]. The design approach is based on expected empirical material gathered with interviews, question-naires, and document analysis. The procedure is a step-wise pro-cess, which consists of deciding a type for the reference archi-tecture, selection of design strategy, empirical acquisition of data, construction of reference architecture, enabling of variability, and evaluation (see Appendix Bfor details).
Service-oriented reference architecture has been defined for en-terprise domain [18]. However, in the big data context, there exist only few architecture proposals. Schmidt and Möhring [8] pre-sented a service and deployment model for implementing big data pipeline to the cloud domain. Demchenko et al. presented a Big Data Architecture Framework, which consists of high-level descrip-tion of big data lifecycle and infrastructure [9]. Doshi et al. pre-sented reference architectures for integration of SQL and NewSQL databases in order to support different growth patterns in enter-prise data traffic [19]. Zhong et al. proposed and validated big data architecture with high-speed updates and queries [20]. The architecture consists of in-memory storage system and distributed execution of analysis tasks. Cuesta proposed tiered architecture (SOLID) for separating big data management from data generation and semantic consumption [10]. Generalized software architecture was proposed for predictive analytics of historical and real-time temporally structured data [89]. Meier conducted design of refer-ence architecture covering functionality in realised big data use cases (Master’s Thesis [7]). The author initially defined require-ments for reference architecture, conducted architecture design, and validated the presented architecture against published imple-mentation architectures of Facebook, LinkedIn, and Oracle. The de-sign was conducted in the empirically-grounded dede-sign framework for reference architectures [17,12].
3.3. Bigdatausecases
Many big data use cases have been published. Facebook, Twit-ter, and LinkedIn are examples in the social network application domain. Facebook collects structured and stream-based data from users, which is applied for batch-based data analysis [6]. Data sci-entists at Facebook can specify ad hoc analysis tasks in produc-tion or development environments for getting deep insight to the data. LinkedIn [1] also collects structured and stream-based data, which is analysed in development and production environments. Additionally, LinkedIn provides new services (e.g. “People you may know”) for end users based on data analysis [1]. Twitter [3,21,22] handles mainly tweets, which have real-time processing require-ments. Twitter also provides new services for end users e.g. “Who to follow” [23].
Netflix is a commercial video-streaming service for end users. Netflix collects user events, which are processed and analysed in online, offline, and nearline environments [2]. Video recommenda-tions are provided for end users based on real time data analysis.
Also, network traffic has been analysed for getting value from data. BlockMon [4,24] is a high performance streaming analyt-ics platform, which has been used for telemarketer call detection based on Call Data Records (CDR). Another application is monitor-ing of network traffic for execution of ad hoc Hadoop/MapReduce tasks [25,26]. The primary applications are web traffic analysis and
168 P. Pääkkönen, D. Pakkala / Big Data Research 2 (2015) 166–186
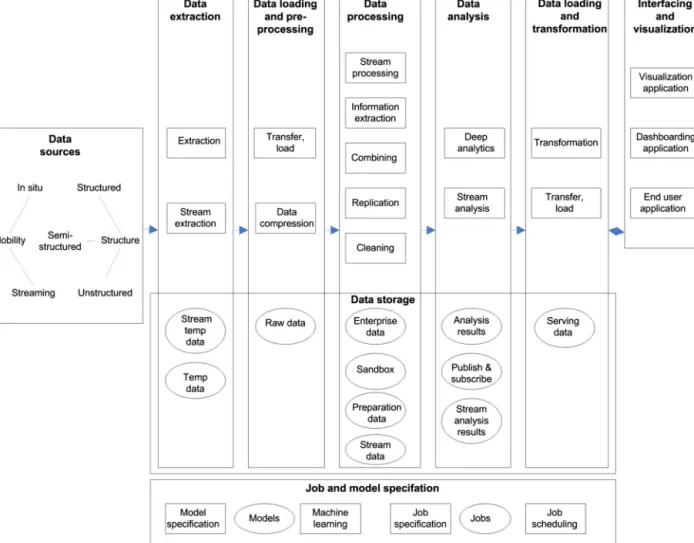
Fig. 1.High-level design of the reference architecture. Data stores are presented as an ellipsis, functionality as a rectangle, and data flows with arrows.
detection of distributed denial of service attacks. Finally, manufac-turing process of digital displays has been improved based on data analysis [5].
3.4. Summary
Related work on big data architectures includes surveys of big data technologies and services (Section3.1), initial design of refer-ence architectures (Section3.2), and reports on big data implemen-tation architectures (Section3.3). However, few reference architec-tures [7]for big data systems have been proposed (research ques-tion 1). Previous work includes either high-level models [8,9] or focus on subset of system functionality [10,19,20,89]. Also, big data surveys have been conducted, but a classification of related tech-nologies, products and services is missing (research question 2).
4. Results
Section 4.1 presents design of the reference architecture. Par-ticularly, different elements of the architecture are described. Sec-tion 4.2presents how the reference architecture was constructed based on the published big data use cases.
4.1. Designofthereferencearchitecture
Fig. 1presents design of the reference architecture. In the fig-ure functionalities (rectangle), data stores (ellipsis), and data flows (arrow) are applied for representation of the architecture. Data
processing functionality has been presented as a pipeline, where data flows mostly from left to right. Similar functionalities have been grouped into functional areas. Data stores are presented to-gether with the respective functional areas. Specification of jobs and models has been illustrated separately from the data pipeline. A detailed mapping between the reference architecture and use case has been provided in Appendix A(Fig. A.1). Concepts of the reference architecture are depicted in italics in the following de-scription:
Datasourcesare defined in two dimensions, mobilityand
struc-ture of data. First, insitu refers to data, which does not move. An example of insitu data is a Hadoop file to be processed with MapReduce. Streaming data refers to a data flow to be processed in real time, e.g. a Twitter stream. Second, structure of the data source is defined. Structureddata has a strict data model. An exam-ple is contents of a relational database, which is structured based on a database schema. Unstructureddata is raw, and is not associ-ated with a data model. Web page content [92] or images can be considered as unstructured data. Semi-structureddata is not raw data or strictly typed [91]. Other aspects of semi-structured data include irregularity, implicitness, and partiality of structure, and an evolving and flexible schema/data model [91]. Examples of semi-structured data include XML and JSON documents.
Extractionrefers to input of insitudata into the system. When
insitudata is extracted, it may be stored temporarily into a data
store (Tempdatastore) or transferred, and loaded into a Rawdata
store. Streaming data may also be extracted, and stored
P. Pääkkönen, D. Pakkala / Big Data Research 2 (2015) 166–186 169
Fig. 2.Data analytics infrastructure at Facebook (adapted from[6]).
compressingextracted data before transferand loadoperations. The
purpose of the Rawdatastore is to hold unprocessed data. Data from the Rawdatastoremay be cleanedor combined, and saved into
a new Preparationdatastore, which temporarily holds processed
data. Cleaningand combining refer to quality improvement of the raw unprocessed data. Raw and prepared data may be replicated between data stores. Also, new informationmay be extractedfrom
the Rawdatastorefor Deepanalytics. Informationextraction refers
to storing of raw data in a structured format. The Enterprisedata
storeis used for holding of cleaned and processed data. The
Sand-boxstoreis used for containing data for experimental purposes of
data analysis.
Deepanalytics refers to execution of batch-processing jobs for
insitu data. Results of the analysis may be stored back into the original data stores, into a separate Analysisresultsstoreor into a
Publish&subscribe store. Publish&subscribe store enables storage
and retrieval of analysis results indirectly between subscribers and publishers in the system. Stream processing refers to processing of extracted streaming data, which may be saved temporarily be-fore analysis. Streamanalysis refers to analysis of streaming data (to be saved into Streamanalysisresults). Results of the data anal-ysis may also be transformedinto a Servingdatastore, which serve
interfacingand visualizationapplications. A typical application for
transformationand Servingdatastoreis servicing of Online
Analyti-cal Processing (OLAP) queries.
Analysed data may be visualized in several ways.
Dashboard-ingapplicationrefers to a simple UI, where typically key
informa-tion (e.g. Key Performance Index (KPI)) is visualized without user control. Visualizationapplicationprovides detailed visualization and control functions, and is typically realised with a Business Intel-ligence tool in the enterprise domain. Enduserapplication has a limited set of control functions, and could be realised as a mobile application for end users.
Batch-processing jobsmay be specifiedin the user interface. The jobs may be saved and scheduled with jobscheduling tools. Mod-els/algorithms may also be specified in the user interface (Model
specification). Machinelearningtools may be utilized for training of
the models based on new extracted data.
4.2. Constructionofthereferencearchitecture
In the following, construction of the reference architecture will be explained in detail. First, each big data use case is presented from architecture implementation point of view. Subsequently, mapping of each use case into the reference architecture is de-scribed. For most accurate information on implementation archi-tectures, the reader is referred to the original cited work of the use cases, because the figures have been adapted for uniform pre-sentation in this document.
4.2.1. Facebook
Data analytics infrastructure at Facebook [6] has been pre-sented in Fig. 2. Facebook collects data from two sources. Fed-erated MySQL tier contains user data, and web servers generate event based log data. Data from the web servers is collected to Scribe servers, which are executed in Hadoop clusters. The Scribe servers aggregate log data, which is written to Hadoop Distributed File System (HDFS). The HDFS data is compressed periodically, and transferred to Production Hive-Hadoop clusters for further process-ing. The Data from the Federated MySQL is dumped, compressed and transferred into the Production Hive-Hadoop cluster. Facebook uses two different clusters for data analysis. Jobs with strict dead-lines are executed in the Production Hive-Hadoop cluster. Lower priority jobs and ad hoc analysis jobs are executed in Ad hoc Hive-Hadoop cluster. Data is replicated from the Production cluster to the Ad hoc cluster. The results of data analysis are saved back to Hive-Hadoop cluster or to the MySQL tier for Facebook users. Ad
170 P. Pääkkönen, D. Pakkala / Big Data Research 2 (2015) 166–186
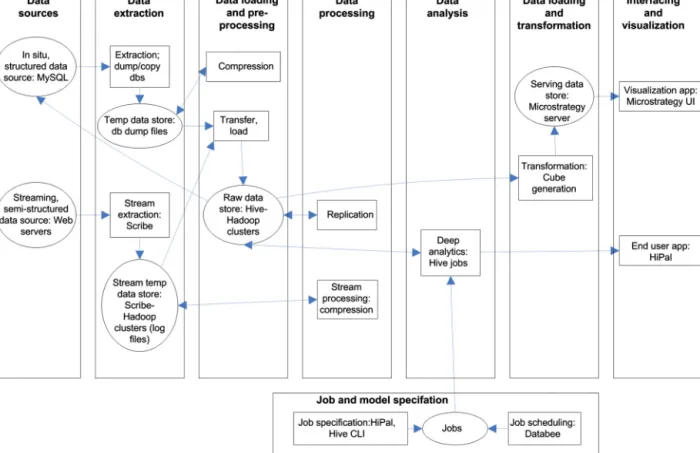
Fig. 3.Mapping between Facebook use case and the reference architecture.
hoc analysis queries are specified with a graphical user interface (HiPal) or with a Hive command-line interface (Hive CLI). Facebook uses a Python framework for execution (Databee) and scheduling of periodic batch jobs in the Production cluster. Facebook also uses Microstrategy Business Intelligence (BI) tools for dimensional anal-ysis.
Mapping of the use case to the reference architecture has been described in Fig. 3. Facebookextractssemi-structured,streaming log data with Scribe (streamextraction). Scribe-Hadoop cluster acts as
a Streamtempdatastore. Compression of stream-based data is
re-ferred to as streamprocessing. Facebook also extracts insitu,
struc-tureddata, which is saved temporarily into Federated MySQL (Temp
datastore). Production Hive-Hadoop clusters act as a Rawdatastore,
where both structured and streaming data is moved and saved
(transferandload).
Transfer and copying of data to the Ad hoc Hive-Hadoop cluster is modelled as replication of data. Execution of Hive jobs is mod-elled as Deep analytics i.e. batch-processing of data. Job specifica-tionrefers to usage of HiPal or CLI user interface. HiPal is also used for visualization of results (Enduserapp). Jobschedulingcorresponds to usage of the DataBee framework. Facebook also transforms(cube generation) data for further analysis with Microstrategy BI server
(Servingdatastore) and Visualizationapplication.
4.2.2. LinkedIn
The data analytics infrastructure at LinkedIn [1]has been pre-sented in Fig. 4. Data is collected from two sources: database snapshots and activity data from users of LinkedIn. The activ-ity data comprises streaming events, which is collected based on usage of LinkedIn’s services. Kafka [27] is a distributed messag-ing system, which is used for collection of the streaming events. Kafka producers report events to topics at a Kafka broker, and Kafka consumers read data at their own pace. Kafka’s event data is transferred to Hadoop ETL cluster for further processing
(combin-ing, de-duplication). Data from the Hadoop ETL cluster is copied into production and development clusters. Azkaban is used as a workload scheduler, which supports a diverse set of jobs. An in-stance of Azkaban is executed in each of the Hadoop environments. Scheduled Azkaban workloads are realised as MapReduce, Pig, shell script, or Hive jobs. Typically workloads are experimented in the development cluster, and are transferred to the production cluster after successful review and testing. Results of the analysis in the production environment are transferred into an offline debugging database or to an online database. Results may also be fed back to the Kafka cluster. Avatara [28]is used for preparation of OLAP data. Analysed data is read from the Voldemort database, pre-processed, and aggregated/cubificated for OLAP, and saved to another Volde-mort read-only database [28].
LinkedIn extracts semi-structured, streaming event data, and
structured,insitudatabase snapshots (Fig. 5). Kafka producer
corre-sponds to streamextractionfunctionality. Kafka broker can be con-sidered as a Streamtempdatastore. Copying of database snaphots is referred to as extraction of insitu data. Hadoop HDFS is a Raw
datastore, which holds both types of extracted data. Combiningand
de-duplication (cleaning) is performed to data, which is stored in Hadoop HDFS, before it is replicated. Copying of data to different clusters is modelled as replication. Processed data in the production environment is considered to be stored into an Enterprisedatastore. Data in the development environment is saved into a Sandboxstore. The results of batch-based analysis (Deepanalytics) in the produc-tion environment are saved either into the production Voldemort database (Analysisresultsstore) or into the debugging Voldemort data store. Some of the results in the production environment are loaded back to the primary Kafka instance (to Streamextraction). Analysis results in the production environment are transformed with the Avatara-tool and loaded into another Voldemort data store (Servingdatastore) for serving OLAP queries from Enduser
P. Pääkkönen, D. Pakkala / Big Data Research 2 (2015) 166–186 171
Fig. 4.Data analytics infrastructure at LinkedIn (adapted based on[1,28,27]).
Fig. 5.Mapping between LinkedIn and the reference architecture.
applications(LinkedIn app). LinkedIn uses Azkaban for specification
and schedulingof batch processing jobsin different domains.
4.2.3. Twitter
Twitter has published two different implementation architec-tures of their infrastructure. The first architecture was based on Hadoop batch processing, which led to performance problems in the processing of streaming data [3,21,22]. The second published
infrastructure meets real-time performance requirements by re-placing Hadoop-based processing with a custom-made solution [3], which is described in Fig. 6.
In the Twitter’s infrastructure for real-time services, a Blender brokers all requests coming to Twitter. Requests include searching for tweets or user accounts via a QueryHose service. Tweets are input via a FireHose service to an ingestion pipeline for tokeniza-tion and annotatokeniza-tion [29]. Subsequently, the processed tweets enter
172 P. Pääkkönen, D. Pakkala / Big Data Research 2 (2015) 166–186
Fig. 6.Data analytics infrastructure at Twitter (adapted based on[3,29]).
Fig. 7.Mapping between Twitter and the reference architecture.
to EarlyBird servers for filtering, personalization, and inverted in-dexing [29]. The EarlyBird servers also serve incoming requests from the QueryHose/Blender. The EarlyBird is a real-time retrieval engine, which was designed for providing low latency and high throughput for search queries.
Additionally, search assistance engines are deployed. Stats col-lector in the Search assistance engine saves statistics into three in-memory stores, when a query or tweet is served. User sessions are saved into Sessions store, statistics about individual queries are saved into Query statistics store, and statistics about pairs
of co-occurring queries are saved into Query co-occurrence store. A ranking algorithm fetches data from the in-memory stores, and analyses the data. The results of analysis are persisted into Hadoop HDFS. Finally, Front-end cache polls results of analysis from the HDFS, and serves users of Twitter.
Twitter has three streaming data sources (Tweets, Updater, queries), from which data is extracted(Fig. 7). Tweets and queries are transmitted over REST API in JSON format. Thus, they can be considered as streaming, semi-structured data. The format of data from Updater is not known (streamingdatasource).
Inges-P. Pääkkönen, D. Pakkala / Big Data Research 2 (2015) 166–186 173
Fig. 8.Data analytics infrastructure at Netflix (adapted based on[2,30]).
tion pipeline and Blender can be considered as Stream tempdata
stores. Tokenization, annotation, filtering, and personalization are
modelled as streamprocessing. EarlyBird servers contain processed stream-based data (Streamdatastore). Stats collector is modelled
as streamprocessing. The statistical stores may be considered as
Streamdatastores, which store structured information of processed
data. The ranking algorithm performs Streamanalysisfunctionality. Hadoop HDFS storing the analysis results is modelled as a Stream
analysisdatastore. Front-end cache (Servingdatastore) serves the
Enduserapplication(Twitter app).
4.2.4. Netflix
Data analytics infrastructure at Netflix [2]has been presented in Fig. 8. The infrastructure is executed entirely in Amazon’s cloud domain. Netflix has divided computation to online, nearline, and offline parts based on different real-time requirements. Services in the online computation have requirements for maximum latency, when responding to client applications. The nearline computation is similar to the online computation with the exception that com-puted results can be stored instead of immediate serving of end users. The offline computation has most relaxed requirements for timing.
End user interacts with Netflix by executing operations (e.g. Play, Rate etc.) in the user interface of the service. Recommenda-tions are provided to the user based on other users’ behaviour.
Recommendation algorithms require data, models, and signals as input. The data is previously processed information, which has been stored into a database. The signals are fresh information from online services. The models are comprised of parameters, which are usually trained initially offline, but are enhanced based on in-cremental machine learning. Events from end users are distributed via the Chukwa framework [30,31]for the offline processing, or via user event queue for the nearline processing. Chukwa consists of agents, which transmit events in HTTP POSTs to collectors, which write data to HDFS file system. Manhattan is a distributed mes-saging system developed by Netflix. Hermes is a publish/subscribe framework, which is used for delivering of data to multiple sub-scribers in near real-time.
Netflix has two streamingdatasources: online data service and Netflix user events (Fig. 9). The event-based data from Netflix users and signals from online data service are modelled as streaming data. The format of extracted streaming data is unknown. Chukwa agent can be considered as a streamextractionprocess, and Chukwa collector as a Stream tempdatastore. Hadoop HDFS can be mod-elled as a Rawdatastore. Execution of offline Pig jobs is modelled
as Deepanalytics. Hermes is a Publish&subscribestorefor storing
and retrieving of offline analysis results.
User data queue is modelled as a Stream temp data store. Data transformation by Manhattan is modelled as Stream process-ing for near-line computation. Intermediate analysis results are
174 P. Pääkkönen, D. Pakkala / Big Data Research 2 (2015) 166–186
Fig. 9.Mapping between Netflix and the reference architecture.
Fig. 10.BlockMon streaming analytics platform with VoIPStream (adapted based on[4,24]).
stored (processed streaming data) into Streamdatastores (Cassan-dra, MySQL, EVCache). Online and nearline computation is mod-elled as a Streamanalysis process. Algorithm service acts as a
Servingdatastore for Netflix UI clients (Enduserapplication).
Ad-ditionally, Modelsare trained with machinelearningalgorithms.
4.2.5. BlockMon
BlockMon [4,24]is a high performance streaming analytics plat-form (Fig. 10). BlockMon consists of small interconnected blocks, each of which performs certain type of processing. The intercon-nected whole can be programmed to perform a larger job. In this
paper, VoIPStream as an application of BlockMon is presented for detection of telemarketer calls in real-time.
VoIPStream has been divided into feature-extraction, process-ing, and reasoning parts. First, VoIPStream takes a stream of Call Data Records (CDR). The CDRs are parsed and features are gath-ered for basis of the analysis. A processing part keeps track of the overall behaviour of each user by computing different metrics with bloom filters. Finally, the reasoning part combines calculated met-rics. A threshold-based decision algorithm determines, if the user is acting like a telemarketer.
BlockMon has one streaming, structured data source (CDRs) (Fig. 11). Parsing of CDRs, checking of memberships, and Boolean
P. Pääkkönen, D. Pakkala / Big Data Research 2 (2015) 166–186 175
Fig. 11.Mapping between BlockMon and the reference architecture.
Fig. 12.Network traffic measurement with Hadoop (adapted based on[25,26]).
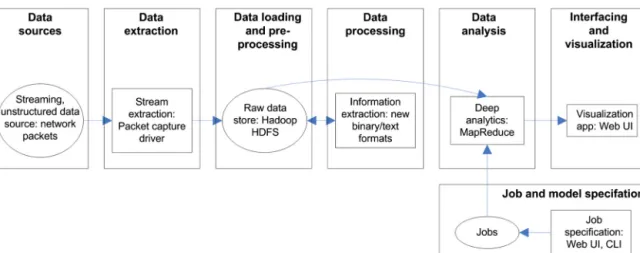
Fig. 13.Mapping between Network measurement use case and the reference architecture.
combining can be considered as streamextraction functionalities. Bloom filtering, and computation of metrics are considered stream
processing. Combining of metrics and decision making are
mod-elled as streamanalysis. The result of analysis is displayed in a simple Dashboarding application (visualization with traffic lights in[24]).
4.2.6. Networkmeasurement
Network traffic measurement and analysis solution [25] has been presented in Fig. 12. The solution consists of a traffic col-lector and Hadoop based traffic analysis tools. The traffic colcol-lector consists of a load balancer and HDFS Datanodes. The load balancer has a packet capturer for monitoring of traffic from a router or an-other network device. It forwards the captured packets to HDFS Datanodes based on a flow level hashing function. The received packets are saved into HDFS with a new Hadoop API to support
libpcap format. Also, new formats have been implemented on top of HDFS to support processing of HDFS data in the native libpcap format [26].
End user can specify jobs/queries interactively in the user inter-face. The specified jobs are mapped either into Hive or MapReduce jobs on a lower level. MapReduce/Hive based tools have been de-veloped for execution of different type of network analysis.
Packet capture driver is considered as an extractor of
stream-ing,unstructureddata (Fig. 13). Hadoop HDFS is modelled as a Raw
datastore. New binary/text formats are considered as extraction
of information from the raw data i.e. structure is created around
unstructured raw data. MapReduce tasks are modelled as Deep
an-alyticsfunctionality. The web interface is applied for specification
of the batch processing jobs (Jobspecification) and visualization of analysis results (Visualizationapp).
176 P. Pääkkönen, D. Pakkala / Big Data Research 2 (2015) 166–186
Fig. 14.FIU-Miner data mining platform in a distributed environment (adapter based on[5]).
Fig. 15.Mapping between FIU-Miner and the reference architecture.
4.2.7. FIU-Miner
FIU-Miner [5]is a system for facilitating complex data analysis processes. Adapted architectural view of FIU-Miner has been pre-sented in Fig. 14. The system consists of four architectural layers. User interface is used for task configuration and execution, import-ing of data mining programs to the algorithm library, and moni-toring of resource utilization. Task and system management layer consists of algorithms, integration of workflows, and scheduling of jobs. It also includes tracking of job execution, and monitoring and management of workers.
The execution of jobs is performed in the abstracted resources layer, which has been demonstrated with a case study for
optimiz-ing manufacturoptimiz-ing process of digital displays [5]. In the demonstra-tion a dataset of displays is loaded from HDFS, and is dispatched into three feature selection algorithms [32]. The selected features are transformed, combined, ranked and stored into a database. The extracted feature combinations are highly related to yield ratio of the manufacturing process, which depends on parameter setting of production equipment.
HDFS file can be considered as an in situ, structureddatasource (Fig. 15). HDFS dataloader extracts information from HDFS file, which is stored into a Rawdatastore(Data publisher). Feature se-lection functionalities can be considered as machinelearning, as the models are mined with different feature selection algorithms.
P. Pääkkönen, D. Pakkala / Big Data Research 2 (2015) 166–186 177
Fig. 16.Classificationofbigdatatechnologies,products,andservices.Technologies/products/servicesofthereportedbigdatausecases(black)aredepictedseparatelyfrom therelatedwork(red).(Forinterpretationofthereferencestocolourinthisfigure,thereaderisreferredtothewebversionofthisarticle.)
The mined stable features (Models) are saved. Finding of frequency combinations, and ranking of features can be modelled as Deep
an-alyticsfunctionality. Analysis results are stored into the database
(Analysisresultsstore). Task configuration and execution interface
can be considered as Jobspecification. Program registration inter-face can be used for modelspecification. System monitoring inter-face is used for visualization (visualizationapp).
5. Reviewofbigdatatechnologies
5.1.Classificationoftechnologies,productsandservices
An initial classification of technologies, products and services was created based on the reviewed big data use cases (Fig. 16), which are described in the following: Data in the use cases was typically collected into databases or log files. Relational databases were applied for storage of important user related data (Face-book’s MySQL, LinkedIn’s Oracle). NoSQL databases or in-memory
stores were used for intermediate or final storage of data analysis results (LinkedIn’s Voldemort, Netflix’s Cassandra and EV-cache). Special log facilities were used for storage of stream-based data (Facebook’s Scribe, LinkedIn’s Kafka, Netflix’s Chukwa, Packet cap-ture driver in the Network measurement case). Structured data was typically saved into a distributed file system (e.g. Hadoop HDFS).
Data processing technologies of the use cases can be classified into batch and stream processing. Jobs with real-time constraints require special technologies and algorithms (Twitter’s ranking algo-rithm and the EarlyBird architecture). Batch processing was used for jobs with less strict timing requirements (Facebook’s, Linked-In’s, and Netflix’s MapReduce, Hive and Pig scripts). Jobs for batch processing were scheduled with special tools (LinkedIn’s Azkaban, Facebook’s Databee). OLAP processing (LinkedIn’s Avatara) trans-formed data for serving of OLAP queries. Processed data was also visualized with commercial Business Intelligence (BI) tools (Face-book uses MicroStrategy).
178 P. Pääkkönen, D. Pakkala / Big Data Research 2 (2015) 166–186
Table 1
Categorizationofstream-processingtechniques.
Publication Technique Programmer’sview Reportedprocessingperformance
MapReduce Online[34] Pipeliningbetweenjobs:maptask
pushesdatatoreducers;Online aggregationofjobs.
MapReduce+optional“flush”API –
Faster data analytics[33] Distributedsharedmemoryfor storingofintermediateMRresults; RDMAforreductionofnetwork latency.
MapReduce Initialsimulationresults
MapUpdate: Muppet[35] mapandupdatefunctionsas
streams;distributedslatesforstorage ofintermediateresults.
MapUpdate Muppet@TwitterandFourSquare:
100 Mtweets/day,1.5 M check-ins/day;Latency
<
∼2 s.S4[36] DistributedclusterofProcessing
Elements
ProcessingElementsAPI ∼1600 clicks/s
SQLStream[38] In-memorystorage;streamingSQL SQLAPI 15 000CDRs/s
TimeStream[39] StreamingDAG StreamInsightAPI Sentimentanalysisof9600 tweets/s;
latency∼2 s. D-Streams/Spark[40] Streamdividedintoshort,stateless,
deterministicstasksinSpark streamingengine.
D-StreamAPIinSparkStreaming withScala/Javaprogramming language
640 000Greprecords/s,250 000 TopKCountoperations/s;latency 1–2 s
Naiad[41] TimelyDataflow:statefulvertices
send/receivedmessagesalong directededges.
TimelyDataflowAPI;SQL, MapReduce,LINQ
32 000 Tweets/s;latency
<
1 sIntegrated Execution Platform[42] IntegrationbetweenSystem-S(IBM) andHadoop.
SPADE(IBM) Streamandbatchprocessingof
Tweets:latency,CPUusagereported.
5.2. Relatedwork
The analysed use cases cover only partly research and commer-cial services in the big data area (Fig. 16). The survey of related work focuses on stream processing, graph stores, benchmarking, virtualization and cloud solutions, business intelligence and vi-sualization tools, novel technology frameworks, and commercial services. These particular categories were focused on, because the cited big data use cases did not cover them, but they were impor-tant for answering to the second research question.
5.2.1. Streamprocessing
Stream processing solutions have been analysed in terms of processing technique, programmer’s view, and performance char-acteristics (Table 1). First, many extensions to the MapReduce framework have been developed for supporting streaming appli-cations (Table 1), due to its limitations [33]. MapReduce Online [34] supports online aggregation of single or multiple jobs in or-der to get intermediate results of jobs. Also, pipelining enables pushing of data from map task to reducer task for enabling stream-ing capability. Mavani and Ragha proposed usage of distributed shared memory for storing of intermediate MapReduce results, and Remote Direct Memory Access (RDMA) for reduction of net-work latency [33]. Example RDMA networks include InfiniBand or Quadrics [33]. MapUpdate is another model for processing of fast data [35]. Similar to MapReduce, the developer writes map and update functions, but processing is performed on streams, which may never end. MapUpdate uses distributed in-memory slates for storing intermediate results of update functions. Muppet, an im-plementation of the MapUpdate model, has been used for process-ing of Twitter and FourSquare streams [35]. Muppet has enabled quick development of stream processing applications, and achieved low latency and high scalability. Also, many other MapReduce-based alternatives exist, which have been reviewed by Mavani and Ragha[33].
S4 is a distributed platform for stream processing [36]. Compu-tation in S4 is performed by Processing Elements (PE), each associ-ated with a keyed attribute, and a value. PEs may be independent or may be connected by consuming results produced by other PEs.
Processing Nodes (PN) host PEs, and are responsible for listening to events, and invoking of computation in PEs based on the events. A separate communication layer abstraction manages clusters of PNs, and maps logical elements to physical nodes. S4 provides an API for programming stream processing as an abstraction of PEs. On-line computation of click-through-rates was performed with a peak performance of 1600 events/s[36]. Offline computation in 8-node cluster handled
∼
12 000 events/s with less than 1% relative error [36]. Also, scalability, resource usage, and fault tolerance of S4 has been analysed [37].SQLStream is a product, which is based on parallel in-memory storage of log data. It offers SQL standard-based API to the pro-grammer. Processing is based on a pipeline of streaming SQL op-erations. 15 000 CDRs per second was processed for a SIP trunking provider [38]. Streaming data can also be saved into Hadoop Hive for deeper analysis.
Qian et al. proposed TimeStream, which is a distributed sys-tem for processing of low latency streaming data on commodity machines [39]. It uses streaming directed acyclic graph (DAG) com-putation at a lower level. The programming model of the system is based on Microsoft’s StreamInsight technology for complex event processing applications. It has been extended for distributed exe-cution supporting parallel execution, fault tolerance, and dynamic reconfiguration. The system is able to perform sentiment analysis of 10 000 Twitter tweets/s with a 2 s delay in a computer cluster.
Zaharia et al. have developed discretized streams (D-Streams) for enabling fault-tolerant streaming computation [40]. D-Streams structures stream computations as a set of short, stateless, and de-terministic tasks, which allows powerful recovery techniques. Tasks are stored in-memory as resilient distributed datasets. D-Streams has been implemented based on Spark processing engine. It has high per-node throughput, scales up to 100 nodes, and achieves sub-second fault recovery and latency. D-Streams is developed fur-ther as part of the Apache Spark project.
Naiad is a new distributed system for executing parallel cyclic dataflow programs [41]. It is based on a low level computational model (timely dataflow), and modelling with directed graphs. In the solution stateful vertices transfer messages along directed edges [41]. Naiad is a distributed implementation of the timely
P. Pääkkönen, D. Pakkala / Big Data Research 2 (2015) 166–186 179
dataflow, and enables programming with several higher level ab-stractions (e.g. MapReduce, LINQ). The tests indicate that it can achieve equivalent performance with other similar stream process-ing systems.
Matsuura [42] proposed an integrated execution platform, which is able to handle both stream and batch processing jobs while satisfying Service Level Agreement (SLA) for stream pro-cessing applications. The system is based on distributed data stream processing middleware (System S by IBM research) and Apache Hadoop technologies. In the proposal a dynamic load balancing component allocates computing nodes for stream or batch processing based on a scheduling strategy. Other important stream processing technologies include Apache Storm and Apache Flume.
The review indicates that existing stream processing techniques are based on MapReduce extensions or modifications [34,33,35], streaming SQL operations [38], dividing of streams into small de-terministic tasks [40], modelling based on acyclic graphs [39,41], distributed system of processing elements [36], and simultaneous batch and stream processing solutions [42]. From the program-mer’s viewpoint MapReduce [34,33] and its extensions [35], SQL API [38], or completely new APIs [40–42,36]can be utilized. Per-formance measures of the solutions mainly included latency and throughput, and Twitter was used as the main streaming reference use case.
5.2.2. Graphmodels
Graph models are based on the semantics of graph theory [43]. A graph data model can be characterized by graph representa-tion, data manipulation expressed by graph transformation, and integrity constraints enforcing data consistency [43]. Graph mod-elling is applied in big data area, when information about data interconnectivity is more important than data itself [43]. This en-ables more natural modelling of data, and direct referral to the graph structure by complex queries [44]. These are important properties for applications using graph models such as social or biological networks [43].
Implementations of graph database models have been analysed and categorized by Angles [45]. Graph databases contain major components of a database system such as database language, query optimizer, and database engine. Graph stores provide only basic facilities for storing and querying of graphs. Related graph tech-nologies do not store graphs, but use graph notion in the imple-mentation. Related graph technologies include triple stores of the Resource Description Framework (RDF). Also, web and document oriented databases, which use graph algorithms or structures in implementation, may be considered as related graph technologies [45]. Furthermore, Angles compared graph databases and stores in terms of data structures, query languages, integrity constraints, and support for querying [45].
Typical application needs in graph processing include online query processing with low latency requirements, and offline graph analytics with high throughput requirements [46]. XGDBench was used for benchmarking online graph databases with synthetic graph models, which indicated that OrientDB had best perfor-mance, when compared to the alternatives (AllegroGraph, Fuseki, Neo4j, Titan) [47]. Angles proposed a micro-benchmark for test-ing social networktest-ing related databases [48]. Graph databases (DEX and Neo4j) achieved best performance, when compared to RDF stores or relational database (RDF-3x, Virtuoso and PostgreSQL). Abreu et al. [49] analysed graph databases (DEX, Neo4j, Hyper-graphDB) and RDF engine (RDF-3x) with Berlin SPARQL benchmark for consuming and mining of linked data. None of the tested tech-nologies outperformed others, but RDF-3x exhibited best perfor-mance in most tasks.
RDF stores can be considered as a sub group of graph stores. Huang et al. [50] presented a scalable distributed RDF data man-agement system, which is based on partitioning of graphs. It en-ables triples close to each other in the graph to be stored in the same RDF store. The approach significantly increases perfor-mance of serving slow SPARQL queries, when compared to alter-natives (single node RDF-3x, SHARD). A recently developed graph engine manages RDF data in native graph form in a distributed in-memory store [51,52]. It achieves much higher performance for online SPARQL queries or offline computation than alterna-tives, which manage data in triple stores or as bitmap matrices [51,52].
Specific graph processing systems have also been developed. Google published Pregel, a distributed system for large-scale graph processing [53]. Pregel exposes a Vertex API for programming of graph processing jobs. Apache Giraph is an open source graph pro-cessing engine inspired by Pregel. Distributed GraphLab [54]is an alternative approach, which enables distributed, asynchronous, and dynamic processing of graphs. GraphChi [55] is a disk-based sys-tem for computing graphs with millions of edges. It divides big graphs into smaller parts by utilizing a parallel sliding windows method, which enables simultaneous execution of data/graph min-ing and machine learnmin-ing tasks on a smin-ingle computer.
Twitter’s “Who to Follow”-service [23] is a real world example involving graph processing. Customers are served by storing user graph on a single in-memory database (Cassovary) [23]. The server handles OLAP queries such as user recommendations, whereas On-line Transaction Processing (OLTP) based graph manipulations are handled by another graph database (FlockDB). Persistent data from FlockDB is loaded daily into Cassovary server due to the size of the graph.
5.2.3. Businessintelligenceandvisualization
Traditional Business Intelligence relies on Extract-Transform-Load (ETL) tools for input of data into warehouse servers [56]. Typically data is processed and stored to mid-tier servers for pro-viding a multi-dimensional view on OLAP-server, enterprise search engines, or data mining engines for enabling in-depth analysis of data. Finally, front-end applications provide user interface and functions such as searching, performance management, or tracking of key performance indicators.
However, requirement for faster decision making has created a need for further development of BI tools and technologies. Choo and Park have proposed computational methods for improving per-formance of visual analytics [57]. The solution is to exploit dis-crepancies in human perception and screen space by utilizing low-precision computation, iteration-level interactive visualization, and iterative refinement of computational results [57]. Another big data visualization challenge has been encountered with electronic mi-croscope, which may involve long delays in the data pipeline [58]. As a solution Beyer et al. have presented a system for exploration of peta-scale data volumes in 3D. The system is based on visual-ization-driven volume data construction and on a multi-resolution virtual memory scheme.
In addition to academic work on visualization, several commer-cial tools are available. Vendors have been categorized to Table 2 in terms of UI capabilities, supported execution environments and data sources, capabilities for data analysis, and support for external statistical tools.
Most of the reviewed solutions offer visualization with a web browser. Also, mobile applications may be provided for extend-ing the customer experience (Tableau, QlikView, SAS). Most of the products can be executed in enterprise or cloud domain. Some product offerings have been associated with the execution en-vironment. For example DataMeer and Tableau provide separate products for desktop, server, and cloud environments. Supported
180 P. Pääkkönen, D. Pakkala / Big Data Research 2 (2015) 166–186
Table 2
Analysisofcommercialvisualizationtools.See
Appendix C
forreferences.Vendor UIcapabilities Executionenvironment Datasources Dataanalysiscapability Externalstatistical
interfaces
Karmasphere Webbrowser PhysicalHW,cloud Delimited(CSV,TSV,XML
etc.),text,extendedtext, sequence,binary.
Analyticalfunctions,batch analysis(Hadoop)
–
Datameer Webbrowser(HTML5) Desktop,server,Hadoop
cluster
Socialmedia,RSS,RDBMS, NoSQL,web/applogs,Java
Batchanalysis(Hadoop) R,SPSS,PMML
Platfora Webbrowser(HTML5) Physicalorcloud.Requires
accesstoHDFSorAmazon S3.
Delimitedtext,Hivetables See“Analyticsengine”, batchanalysis(Hadoop)
–
Tableau Webbrowser.Mobile
applicationsforAndroid, iPad,iPhone.
Desktop,server,cloud (online).RunsonWindows. Virtualenv.
Databases,cubes,data warehouses,filesand spreadsheets.
See“TableauDesktop” R
QlikView Webbrowser,QlikView
MobileforiOS.“Business discovery”fororganizations.
Physical.RunsonWindows. Datawarehouses,Excel files,SAP,Salesforce.com
See“QlikviewDeveloper” –
SASVisual Analytics
MobileappsforiPadand Android
Physical,cloud,SaaS Excel,delimitedtext,SAS data,Twitterstream,Oracle tables
SeeSASVisualAnalytics Designer
–
Streambase Webbrowser,mobileclient accessviaRestfulAPI
Windows,Linux Variousstreamingdata
sources(news,socialmedia etc.)
See“LiveViewDesktop” Matlab,NVidia,R, kdb+QDBC
data sources are heterogeneous, although StreamBase differenti-ates by providing support for analysis of streaming data with low latency requirements. A few vendors enable integration by visual-izing results of Hadoop-based analysis. Some vendors also provide adapters for integration with external statistical tools.
5.2.4. Bigdatabenchmarking
Chen et al. analysed MapReduce traces of business critical de-ployments at Facebook and Cloudera [59]. They found out that most workloads are diverse, typically driven by interactive anal-ysis, and apply query-type of programming frameworks on top of MapReduce. Thus, big data benchmarks should characterize diverse patterns of workloads.
Currently new benchmarking technologies for big data systems are being developed, which have been surveyed by Qin and Zhou [60]. The review indicated that many benchmarks exist for big data related technologies such as MapReduce, NoSQL databases, graph databases [47], Hadoop, and relational databases [60]. However, a common benchmark covering complex big data systems and work-loads [59]is needed, which was also concluded by Wang et al. in a review of big data benchmarks [61].
Ghazal et al. have developed BigBench, an end-to-end bench-mark for simulation of comprehensive workloads [62]. Data model of the benchmark adopts a structured part from an existing TPC-DS benchmark. Semi-structured and unstructured data components have been implemented with Parallel Data Generation Framework [63]. The proposal covers specification of velocity, variety, and vol-ume, which are important characteristics of big data. Performance of the benchmark was tested against Teradata Aster DBMS in a clustered environment. An alternative approach is driven by Big Data Benchmarking Community [64]. It aims at defining an end-to-end application layer benchmark, which would be evolved with a concurrent benchmarking model. Armstrong et al. have developed LinkBench, which is a benchmark based on Facebook social graph [65]. It reflects real-world database workloads for social applica-tions. The benchmark consists of a loading phase for populating a graph store with synthetic data, and execution phase for run-ning the specified queries and collection of statistics. Wang et al. presented BigDataBench [61]for characterizing big data workloads. First, real-world data sets were gathered from social networking, e-commerce, and search engine use cases. Then, 19 workloads were chosen covering offline and real-time analytics, and online services.
BigDataBench has been used for benchmarking of big data systems with different hardware platforms [66].
The review indicated that various benchmarks have been de-veloped for testing of big data technologies [60]. Also, the first end-to-end benchmarks are being developed for characterizing big data workloads [62,65,64,61].
5.2.5. Virtualizationandcloud-basedsolutions
Virtualization has been developed for abstracting HW and sys-tem resources to enable execution of multiple operating systems (OS) (Fig. 16). Full virtualization [67]aims at hardware emulation. An unmodified OS is used, in which a hypervisor controls execu-tion of privileged operations. Paravirtualization requires modifica-tions to the virtualized OS and coordination between the virtual OS and hypervisor regarding operations [67]. The benefit is increased performance over full virtualization, which is enabled by execution of demanding tasks in the host OS. OS-level virtualization approach does not require a hypervisor. Instead, the underlying OS is modi-fied to enable execution of multiple instances of the OS on a single machine [67]. Linux versions of OS-based virtualization have been referred to as container-based virtualization solutions [68]. The main advantage is performance, which is close to execution of a native OS [67]. The disadvantage is reliance of multiple VMs on a single OS kernel, which may create problems in case of crashes. An interesting technology is Docker, which automates deployment of applications in standardized execution environments, by utilizing container-based virtualization. Native virtualization uses hardware support in a processor to enable execution of multiple unmodified OSs on the host processor.
Performance of different virtualization models has been com-pared. Walters et al. examined WMware, Xen, OpenVZ in terms of different workloads [67]. OpenVZ as an OS-level virtualiza-tion solution demonstrated lowest overhead and highest perfor-mance. Che et al. [69]also evaluated performance of OpenVZ, Xen, and KVM as implementations of different virtualization models. OpenVZ (OS-based virtualization) had best performance, and KVM (full virtualization) had lower performance than Xen (paravirtual-ization).
Also, full- and paravirtualization models have been compared. Younge et al. compared Xen, KVM, VirtualBox, and WMware [70]. KVM had best overall performance followed by VirtualBox (full virtualization). Full- and paravirtualization models with Xen has
P. Pääkkönen, D. Pakkala / Big Data Research 2 (2015) 166–186 181
been studied [71], which indicated that overhead of full virtual-ization is at least 35% larger, when compared to paravirtualiza-tion. Li [72] compared a commercial hypervisor, Xen, and KVM with different Hadoop-based benchmarks. Biggest performance dif-ferences were observed with I/O bound benchmarks, while CPU-bound benchmarks revealed smaller differences between hypervi-sors. HW-assisted virtualization was tested with Xen and KVM by Palit et al. [73]. Particularly, PCI passthrough was used to enable di-rect access to hardware devices by the VMs. The results indicated near-native performance, and Xen achieved better overall results, when compared to KVM.
Finally, paravirtualization and OS-based virtualization have been compared. Padala et al. compared Xen and OpenVZ in differ-ent configurations [74]. The results indicated that Xen had larger overhead, which resulted in higher performance for OpenVZ. Dif-ferent OS-level/container-based virtualization solutions have been compared to Xen by Xavier et al. [68]. In overall, Xen achieved lower performance than the container-based virtualization solu-tions. LXC achieved best performance among the container-based solutions. However, isolation of performance between VMs was best with Xen, which may be a disadvantage of OS-based virtual-ization solutions.
Cloud computing has been characterized by dynamic provision-ing of computprovision-ing resources based on service-level agreements be-tween service provider and consumer [75]. Cloud computing is an umbrella concept, which covers also virtualization solutions. Many open source implementations have been developed for cloud computing [76]. Dukaric and Juric [77] presented a taxonomy and architecture for cloud solutions, and provided a mapping be-tween the framework and different open source cloud implemen-tations.
Architectural and philosophical differences and similarities be-tween Eucalyptus, OpenNebula, and Nimbus cloud solutions were compared by Sempolinski [78]. Wen et al. [79] compared Open-Nebula and OpenStack in terms of architecture, support for virtu-alization hypervisors, cloud APIs, and security aspects. OpenStack, OpenNebula, Nimbus and Eucalyptus were compared in terms of interfaces, hypervisors, networking, deployment, and storage in or-der to evaluate suitability for FutureGrid testing environment [80]. Also, scalability of provisioning physical and virtual machines was tested, and OpenStack was observed to achieve the best perfor-mance. Huang et al. [81] compared CloudStack, Eucalyptus, and OpenNebula for geoscience applications. Especially, the implemen-tations were compared in terms of features and performance (CPU, I/O, memory hierarchy, network transfer, and geoscience appli-cations). A difference was observed in support for web applica-tions, where OpenNebula had slightly better performance, because traffic is not routed via a cloud controller in the architecture. OpenNebula also achieved best performance in geoscience appli-cations, although with a small margin, when compared to the alternatives. Huang et al. also compared afore-mentioned solu-tions against the performance of a bare-metal cluster [82]. The results indicate that cloud solutions have
∼
10% overhead from virtualization and management, which increases when more vir-tual machines are used. OpenNebula achieved best performance, when compared to the other cloud solutions (CloudStack, Eucalyp-tus).5.2.6. Newtechnologyframeworks
In addition, completely new analytics frameworks have been developed. Borkar et al. present ASTERIX as a new approach, which provides an alternative to the Hadoop-based data processing paradigm and architecture [83,90]. A new parallel, semi-structured information management system has been created, which consists of three architectural layers. The bottom layer is called Hyracks, which is a data-intensive runtime. The top layer is a full
paral-lel DBMS with a flexible data model and a query language. The middle layer is Algebricks, which is a virtual machine for parallel query processing and optimization. Performance of the approach has been extensively studied, which indicated better results in comparison to Hadoop-based systems.
Flink/Stratosphere follows a similar approach as ASTERIX, and is currently being developed in Europe [84]. It has two layers. PACT is a new programming model, and Nephele is a parallel execu-tion engine. Nephele is the lower layer, and executes data flow graphs. PACT is a generalization of the MapReduce programming model, but also includes a richer set of operators. It offers Java and Scala APIs for developers. Flink applies in-memory data transfers and data pipelining for increasing of performance.
Flink use cases have been published for illustrating the ben-efits of the framework. Nephele has been extended for detecting violations in user-defined QoS constraints, and optimization of job execution without user intervention [85]. The approach improved processing latency in a video stream augmentation task signifi-cantly, when compared to alternatives (no optimization, Hadoop Online [34]). Flink has also been utilized for data mining of users in a social media service [86]. Specifically, PACT programming, ex-ecution of data flows, and visualization of analysis results has been demonstrated [86].
5.2.7. Commercialservices
Also, many commercial infrastructure services are available for realisation of big data systems (see Appendix C(Table C.1) for ref-erences). The classification of commercial services in Fig. 16was inspired by Feinleib [87]. Software-as-a-Service (SaaS) companies have specialized in the collection and analytics of big data. Ex-amples include Flurry or Medio, which have specialized in data collection and analytics for mobile applications and devices. End users apply a Software Development Kit (SDK), which is obtained from the SaaS-provider for data collection from mobile devices. A user interface is provided for end users for getting access to data metrics. Jaspersoft BI for AWS is another SaaS-based solution for execution of BI based on Amazon’s infrastructure and services.
Infochimps provides Infrastructure-as-a-Service (IaaS) for data collection and analysis in cloud-based deployments. Especially, public interfaces are provided for controlling data collection and analysis processes. Also, different virtual cloud networking solu-tions are available for execution of the service. Amazon EC2 and Windows Azure are other main IaaS solutions.
Data-as-a-Service (DaaS) providers offer a public API for get-ting access to data, which has been collected from various sources. The extracted data is typically context related. Factual provides an API for getting access to location and context-based data, which has been collected from Factual’s partners. Factual’s clients can use data and other provided tools for building of context-based mobile applications. Another example is Gnip, which collects data from various social media sources (e.g. Twitter), and provides different services for getting access to it.
A Big data system may also be built on company’s enterprise infrastructure. Cloudera is an example of an “Analytics infrastruc-ture”, which provides a Hadoop-based platform for execution of data analytics jobs in enterprise environment. Jaspersoft BI Enter-prise is an analytics platform for enterprise domain, and consists of several functionalities (ETL, OLAP, in-memory server, visualiza-tion). 10Gen provides “Operational infrastructure” for enterprise grade databases and management based on MongoDB technology. BigMemory from Terracotta enables a distributed in-memory data management solution.
Log services enable collection, management, and analysis of log-ging data collected from various sources. Splunk enables organiza-tions to collect and analyse machine generated log data. Splunk engine can be deployed in enterprise or virtual environments.
![Fig. 2. Data analytics infrastructure at Facebook (adapted from [6]).](https://thumb-us.123doks.com/thumbv2/123dok_us/10131218.2914013/4.918.231.700.93.545/fig-data-analytics-infrastructure-facebook-adapted.webp)
![Fig. 4. Data analytics infrastructure at LinkedIn (adapted based on [1,28,27]).](https://thumb-us.123doks.com/thumbv2/123dok_us/10131218.2914013/6.918.155.778.97.550/fig-data-analytics-infrastructure-linkedin-adapted-based.webp)
![Fig. 6. Data analytics infrastructure at Twitter (adapted based on [3,29]).](https://thumb-us.123doks.com/thumbv2/123dok_us/10131218.2914013/7.918.169.739.100.498/fig-data-analytics-infrastructure-twitter-adapted-based.webp)
![Fig. 8. Data analytics infrastructure at Netflix (adapted based on [2,30]).](https://thumb-us.123doks.com/thumbv2/123dok_us/10131218.2914013/8.918.158.776.93.688/fig-data-analytics-infrastructure-netflix-adapted-based.webp)

![Fig. 14. FIU-Miner data mining platform in a distributed environment (adapter based on [5]).](https://thumb-us.123doks.com/thumbv2/123dok_us/10131218.2914013/11.918.110.797.92.882/fig-miner-mining-platform-distributed-environment-adapter-based.webp)

