Value-oriented supply chain risk management
27
0
0
Full text
(2) Keywords: supply chain risk management, expectation confirmation theory, attitude, value, survey, cluster analysis. 1 Introduction Supply chain risk management (‘SCRM’) has emerged as an issue of critical importance for today’s globalised supply chains, and various supply chain disruptions have been in the headlines for most of the decade. Further, a number of major trends such as globalisation, outsourcing, transitioning to lean and agile operations, and increased terrorist threats have contributed to the importance of SCRM (Chung et al., 2015; Colicchia and Strozzi, 2012; Lavastre et al., 2014; Lockamy, 2014). Companies often face the chance that their supplier will be unable to deliver as promised (Guertler and Spinler, 2015). The stopping of production of several automotive companies is a well-known example. Hendricks and Singhal (2003) studied over 800 instances of supply chain disruptions and found they had significant negative impacts on revenue, operating income and stock price. All this seems to have amplified the perception of the frequency and impact of supply chain disruptions. Despite all these issues and a decade of intensive research on the topic, we are still faced with some surprising facts. In most surveys, a majority of supply chain leaders believe SCRM is very important and most of them had experienced a significant disruption during the last year. However, only a minority is investing significant time and money in SCRM practices and a considerable number of executives acknowledge that their company does not spend enough time or resources on mitigating risk (see e.g. (Aberdeen Group, 2008; The McKinsey Quarterly, 2006)). Most of the previous research still chiefly aims to improve various methods for risk identification, as well as the assessment, decision, implementation and monitoring of SCRM actions (Hallikas et al., 2004). While this research is important, it rarely investigates the underlying organisational attitudes that influence the amount of resources invested in and the value generated from SCRM. Thus, SCRM approaches currently mostly seek to measure supplier attributes, trends or the supply chain structure and then use the findings to compare suppliers and predict disruption. The results are then used to prepare proper mitigation and response strategies and measure the performance. For example, supply chain resilience is an area of recent research that measures the responsiveness (or ability to recover) of the supply chain as a result of an SCRM program (Hohenstein et al., 2015; Mattsson and Jenelius, 2015). However, attention has recently switched to not just the prevention/recovery/ minimisation of the consequences of disruption events but also to the value and, consequently, the competitive advantage that can be generated from such efforts (Oehmen et al., 2009).. 2.
(3) Earlier research generally examined how to do SCRM in a more efficient way and not what motivates companies to increase their attention to and funds for SCRM. The question remains why, despite the well-known risks, often little is done to establish various SCRM practices. We thus argue that this is caused a lot by the attitude to and expectations from SCRM. SCRM should not be seen solely as the mitigation of events but also as an approach for increasing the value for the company, its customers and shareholders. Namely, in line with expectation confirmation theory, the confirmed expectation (e.g. no risk materialised or a limited impact) will cause the company to continue avoiding risk while limiting the resources for SCRM. It is only when the initial expected benefit of SCRM is not simply risk avoidance but mainly value generation that increased attention to it can be expected. In the paper we use expectation confirmation theory as our basis to better understand how expectations of SCRM affect the way companies recognise SCRM as holding the potential to generate value and not just avoid costs. We use a combination of a quantitative (a survey of 89 organisations) and qualitative (6 mini case studies) methodological approach aiming to shed more light on attitudes towards and results from SCRM. The structure of this paper is as follows. First, the importance of SCRM is outlined. The need to focus on the value and not just the costs of SCRM is explained and then examined within expectation confirmation theory. The methodology for our mixed methods research is outlined. The main results of the statistical analysis and mini case studies are presented. Finally, their implications are discussed while several important limitations of our research are acknowledged. 2. The importance of SCRM. Risk management is the identification, assessment and prioritisation of risks (defined in ISO 31000 as the effect of uncertainty on objectives, whether positive or negative (ISO 31000:2009)) followed by the coordinated and economical application of resources to minimise, monitor and control the probability and/or impact of the events (Hubbard, 2009). One of its types is the management of risks connected to supply chains, which is a field of growing importance. This is illustrated by the number of research papers on the topic: between 2009–2014 over 100 papers were published each year in the Web of Science core collection list of journals (search term topic=”supply chain risk management”). In comparison, only 5–15 papers appeared annually at the beginning of the century (Web of Science, 2015). Various trends enhance exposure to risks, such as the increased use of outsourcing, globalisation, reduction of the supplier base, reduced buffers, stronger demand for on-time deliveries and shorter product life cycles (Christopher and Lee, 2004; Colicchia and Strozzi, 2012; Lockamy and McCormack, 2012; Norrman and Jansson, 2004; Trkman and McCormack, 2009). This is highlighted by several practical examples of the high cost of improperly preparing for and 3.
(4) responding to various events (Chopra and Sodhi, 2004; Tang, 2006). These losses can be huge. For example, when China Mengniu Dairy announced recalls of its tainted product in 2008 its stock price dropped by almost 60% (Tse and Tan, 2012). The growing importance of SCRM is not only caused by increased exposure to catastrophes, but is also the result of investments made in recent years to operate supply chains with fewer human and capital resources, especially inventory. Consequently, less slack is available in supply chains to deal with various disturbances (Knemeyer et al., 2009). The risks are thus not limited to a few well-known cases. According to Aberdeen Group research, each year 58% of companies suffer financial losses due to supply chain disruptions (Aberdeen Group, 2008). A similar study by AMR Research showed that, already in 2007, 46% of companies had planned to evaluate and/or implement SCRM technology in the next 12 to 24 months (Schneider, 2008). In response to these issues, the SCRM field has evolved from passively reacting to vague general issues of disruptions towards more proactively managing supply chain risks from a system perspective (Tang and Nurmaya Musa, 2011). SCRM is most often a formal process that involves identifying potential losses, understanding their likelihood and assigning significance to those losses (Giunipero and Eltantawy, 2004). The ability to implement such methodologies is a critical capability for competing in the current business environment since disruptive events can significantly impact the performance of the affected companies in the supply chain (Colicchia et al., 2011). Despite calls to raise awareness of the importance of anticipating, preparing for and managing risks (Tse and Tan, 2012) this is still problematic in practice (Colicchia et al., 2011). Many new methods have been developed but they appear not to be applied in reality (Hubbard, 2009). Firms still vary widely in their approaches to preparing for and adapting to unexpected events (Butler and Gray, 2006). Although effectively managing supply chain risks directly affects financial performance, a majority of corporate board members are under-informed about those risks (Pettit et al., 2010). A study by Chainlink Research (McBeath, 2011) also found that the investment into SCRM is small. This shows a big discrepancy between the importance and development of various methods on one hand and the situation in practice on the other. If SCRM is such an important subject, why are organisations not investing more? In the continuation, we argue that this can be explained by the expectations of SCRM. Such expectations are based on the attitudes of managers, namely whether SCRM is solely understood as risk prevention or whether it is also perceived as a possible way of generating value.. 4.
(5) 3 SCRM as value generation The majority of the risk optimisation models proposed in the literature attempts to minimise the probabilities of events and the costs associated with those events. This is insufficient since it is also necessary to consider the capability to help an organisation create and sustain business value from SCRM. SCRM should not only allow preparing for unexpected events, responding to disruptions and recovering from them but mostly enable the continuity of operations to be maintained at the desired level of connectedness and control (Ponomarov and Holcomb, 2009). This means that SCRM can bring more than risk avoidance and impact minimisation – namely, it can also create new value for the organisation. The goal of a firm’s management efforts should not chiefly be to eliminate risks but also to become more risk-informed (Schmitt and Singh, 2012) and use SCRM as a tool for greater rewards, not just control against loss (Wu and Olson, 2009). SCRM can thus also be seen as an approach to creating shareholder value (Hahn and Kuhn, 2012) thus Cantor et al. (2014) used the stakeholder theory to examine what brings risks to supply chains. In achieving this, of course the methodologies for SCRM are a necessary tool, but by themselves they are insufficient. In addition to such assessments SCRM must be a management function that is interorganisational in nature and closely related to strategic and operational realities (Lavastre et al., 2012). Effective SCRM is based on collaboration (collaborative meetings, timely and relevant information exchanges) and the establishment of joint and common processes with industrial partners (Lavastre et al., 2012) allowing management to develop a portfolio of capabilities (Pettit et al., 2010). This shows that generating value from SCRM not only requires novel methodologies but mainly a change in focus and attitudes in the organisation. All this considered, it is not surprising that “evaluating the value of an increased supply chain resilience and robustness” was listed as one of the most important future research directions (Brandon-Jones et al., 2014; Colicchia and Strozzi, 2012). SCRM should be viewed as a strategic management activity in companies given that it can affect their operational, market and financial performance (Narasimhan and Talluri, 2009). To this end, the objective should be sustainable value creation (Klibi et al., 2010). A typical illustration of the fact that SCRM can bring this value in various aspects is research in the German automotive industry which shows that companies which have implemented SCRM only to a small extent have lower average values in all of the investigated performance criteria such as resilience to external disruptions, reactivity improvement, and flexibility (Thun and Hoenig, 2011). SCRM is not only compulsory in order to survive in the short term, but also provides the ability to adapt to change and thrive in the long term (Pettit et al., 2010). Interestingly, despite the relevance of risk management, we know surprisingly little about the causal effect of risk management on value (Perez-Gonzalez and Yun, 2013). 5.
(6) It is likely that these findings in research papers will also slowly penetrate into practice. Melnyk et al. (2009) argue that, while the current supply chain view is relatively limited to issues of delivery, risk and leadership, it will become more complex and demanding in the future. Companies are looking beyond their organisational boundaries to develop and leverage the resources and capabilities of their supply chain partners to create superior value and competitive advantages (Ganesan et al., 2009). It has become more difficult to identify risks as supply chain operations have fallen into the hands of outside service providers, and are therefore less visible (Vilko and Hallikas, 2012). Basically companies should not just effectively manage the existing risks. SCRM professionals should go beyond risk minimisation and be active in justifying costly risk mitigation strategies, determining the effectiveness of SCRM measures, and substantiating their contribution to the company as a whole (Wagner and Neshat, 2012). Low-frequency incidents are hard to predict and manage. It can therefore be difficult to justify why resources should be devoted to proactively manage such risks. If a risk never materialises, the expenses incurred by risk assessment and management activities are hard to justify (Altay and Ramirez, 2010). Thus, proactively planning for these types of events (Knemeyer et al., 2009) and clearly presenting the value these activities bring to the organisation should be a priority of supply chain managers. Interestingly, the vast majority of papers summarised in this section have been published in the last few years. This indicates that SCRM is seen ever more in academic literature as also being an opportunity to generate value; still this usually does not happen in practice. We argue that both the approach and the outcome of SCRM depend heavily on the expectations of the organisation – whether it expects that value can be brought by SCRM and whether their efforts are able to meet those expectations. Therefore, the next section explores approaches to SCRM within the framework of expectation confirmation theory.. 4 Expectation confirmation theory and its role in SCRM Despite the increased importance of SCRM in theory, it is surprising to find that even the recent turbulent times have mostly not changed many companies’ attitude to the perception of SCRM more as a value generator. Normally, one may expect that companies observing events in their environment may be inclined to invest more in order to boost their resilience and build on that as one of their important competitive advantages. This surprising lack of evolution of attitudes to SCRM can be explained within expectation confirmation theory (Bhattacherjee, 2001) which is generally used in the analysis of consumer behaviour. First, consumers form an initial expectation about a specific product or service prior to purchase. Second, they accept and use that product or service. Following a period of initial use, they form perceptions about its performance. Then they assess its perceived performance vis-à-vis their original expectation and determine the extent to which their expectation is confirmed and form their satisfaction based on 6.
(7) that. Finally, satisfied consumers form a repurchase intention, while dissatisfied users discontinue its subsequent use. Expectation confirmation theory has been widely used in the consumer behaviour literature to study customer satisfaction, post-purchase behaviour and service marketing (Poon and Yu, 2012). While the theory was developed for consumers’ expectations regarding end-user products, it can be applied in corporate settings in general and in supply chain analysis in particular. Some similar examples of applying expectation confirmation theory to a company setting include Landeta et al. (2009) who analysed the expectations and their role for support being given to continuous management training in the organisation. Another example is the study of a new information system’s adoption in an organisation (Brown et al., 2008). Petter (2008) emphasised the importance of managing user expectations and studied how project managers should manage user expectations in a software project. Use of the theory has recently been extended to particular examples in the supply chain context as well, such as the analysis of the adoption, satisfaction, impact and continuance of use of RFID technology (Hossain, 2014) or a study of the expected vs. realised benefits and satisfaction level with implemented supply chain management systems (Wang and Sedera, 2011). Accordingly, expectation confirmation theory can also serve well to explain the changing attitudes to SCRM. We argue that it is crucial for SCRM success that the targeted users of SCRM hold a certain set of beliefs (adapted from (Szajna and Scamell, 1993). The expectations of SCRM determine the level of involvement in various planning activities. When the expectations are high and realistic, the involvement would be high and users with greater expectations perform better (adapted from (Palanisamy, 2005) who studied involvement in information technology projects). People with unrealistically low expectations will have lower user satisfaction scores than those with moderate (realistic) expectations (Szajna and Scamell, 1993). In any case, expectation serves as the comparison standard: users will compare their expectation and perceived performance of SCRM to form their satisfaction. When the perceived performance is higher than the expectation, this leads to positive confirmation and satisfaction. In contrast, when the perceived performance is lower than the expectation, this leads to negative confirmation and dissatisfaction (Zhou, 2011). Yet the level of users’ expectation is only part of the answer. We argue that in the SCRM context it is even more important to understand the nature of expectations. The expectations and preconceptions and the (dis-)confirmation of those involved need to be examined (see Indulska et al. (2009) for a similar example of business process modelling). The perceptions of supply chain management professionals are an important source to consider when seeking to understand the risks (Zsidisin and Wagner, 2010). Adequate preparation and response depend on the attitudes to SCRM (Lavastre et al., 2012). It is thus important to study the way in which the. 7.
(8) expectations arising from SCRM are formed. Understanding how these supply chain decisions are made holds significant theoretical and practical importance (Hult et al., 2010). When SCRM projects are perceived to have a low net present value, this value can be increased by clearly identifying the embedded unlocking option (Hult et al., 2010). For example, in the case of SCRM it should be emphasised that it is not only risk avoidance but the option to bring competitive advantage to the organisation since its customers may perceive supply chain safety as important. Perceptions of the magnitude of disruption, probability of disruption, and overall supply chain risk facilitate the translation of a situation into a decision (Ellis et al., 2010). A lack of preparedness in terms of either not detecting a risk or not having thought about solutions to potential problems can have grave consequences (Lavastre et al., 2012). SCRM is thus not solely based on a statistical evaluation of probabilities and impacts of events but should be focused on the psychological and emotional aspects of risks, which have been shown to exert an enormous influence on behaviour (Knemeyer et al., 2009). Some companies may express concerns regarding the costs associated with SCRM while others may recognise the additional benefits. At a conceptual level, SCRM would enhance the competitive position of a firm, especially when other firms’ supply chains are more vulnerable to disruptions (Sodhi and Tang, 2012). Theoretically speaking, the costs entailed in implementing these proactive strategies can be viewed as ‘insurance premiums’ that will safeguard supply chains from major disruptions. Yet it is difficult to evaluate the return on these insurance premiums, especially in the absence of reliable data (the probability a disruption would occur, potential loss due to a disruption etc.) (Tang, 2006). Successful companies will frame these risks so as to shape their decision-making process regarding how best to plan for the risks (Knemeyer et al., 2009). This shows that simply investing more funds in SCRM per se will not lead to better results. If a company views SCRM as a cost, it will expect that SCRM will take a certain effort to prevent the worst. If nothing happens, the company would be satisfied (having spent little money without any damage) and will continue with the same minimising approach. If something does happen, the company will be dissatisfied. Since SCRM cannot be abandoned completely, the company will try to either improve efficiency or to increase effort which usually brings more formality into the process. Even management's increased support for such expectations will only lead to some increase in funds, more formal procedures etc. without any real impact on the performance and the value generated by those activities. On the other hand, if a company perceives SCRM as an investment then the company would not only be satisfied when nothing happens but even when something happens since the company 8.
(9) would be able to respond better than its competitors. Both are then taken as proof of the value of the SCRM programme; the first by way of prevention, and the second by way of an efficient response to an event. Those successes enable the creation of resources for further improvement. In such a way, the thrust of the famous quote: “Nobody ever gets credit for fixing problems that never happened” (Repenning and Sterman, 2001) can be overcome. Such an attitude namely reinforces the need to enhance the same behaviour – to focus on how SCRM can deliver value to the company.. 5 Methodology and results 5.1 Methodology In this exploratory-descriptive study, we use mixed methods research (a combination of a survey and six mini case studies). Using this approach, our research avoided any over-reliance on statistical methods while still assuring the greater validity of the findings. Mixed methods research enables a wider range of coverage, improves trustworthiness and widens the scope of the study (Remus and Wiener, 2010). A combination of research methods, particularly triangulation of qualitative and quantitative data, is needed to develop a deeper understanding and provide a holistic understanding of a phenomenon for which current research is fragmented, inconclusive and equivocal (Venkatesh et al., 2013) as is the case of SCRM. Mixed supply chain research is needed to keep up with the dynamic business environment and to fully explain supply chain phenomena (Golicic and Davis, 2012). A similar combination of data collection methods has often been successfully used in SCRM research (Craighead et al., 2007). The survey instrument was investigative and involved several questions designed to get answers on the state of SCRM. It was developed through interviews and a theoretical review to develop a basic set of concepts and measures. This basic set of questions and measures was then reviewed with SCRM practitioners in several industries and a set of survey items was selected. The aim was to identify key SCRM practices and identify what is the Importance given, Actions taken and Attitudes of companies toward SCRM. In addition, questions about SCRM performance were also used. Questionnaire scales were based on a 5-point Likert scale ranging from 1Strongly Disagree to 5-Strongly Agree. This test set was then distributed to a test group of 15 practitioners for validation and feedback. Adjustments were made and a final survey developed. The data collection was conducted in two parts: Part 1: Six mini case studies were carried out with supply chain managers who are experts in the area and had been identified based on their expertise, willingness to cooperate and by having close contact with one of the authors. These interviewees were from a deliberately wide set of industries, different positions in a supply chain and from different countries. They represented 9.
(10) telecom, a defence supplier of electronics, an insurance company, a healthcare organization, a manufacturer and a financial services firm. They were from Brazil, Canada and the US. The companies were also selected based upon the level of risk management maturity and turbulence in their markets. For example, Healthcare Shared Services BC had several different segments of healthcare suppliers (surgical supplies, food service, instruments, computer systems) that had different levels of risk and turbulence. We examined how they managed these different segments. Another example is Rockwell Collins. They had a high level of risk management maturity and we examined the practices they used, their effectiveness and their attitude toward risk management. During the interviews, further information (e.g. an internal documentation or reports from the company) was gathered and combined with publicly available materials. The questions put forward a statement about the perceived importance of SCRM and actions taken, attitudes towards and expectations of SCRM and, finally, performance. The interviewees were also asked to expand on and explain their answers. This was done in parallel to the survey research and was used to more fully understand the survey answers. Part 2: The survey was sent to the sample population of key informants who were involved in SCRM. It can be assumed that personnel at the manager level or above are capable of answering the study's questions (Carter and Jennings, 2002). In line with Kiessling et al. (2012), we argue that key informant bias is not a major consideration since our sample used key informants occupying positions that make them knowledgeable and objective about the issues being researched. Participants of the survey were selected from the Supply Chain Council, the Institute for Supply Management and the Skema Business School alumni list of those holding a Master’s degree in supply chain management. Survey data were collected using the Zoomerang survey site. Patterns, trends, descriptive statistics, cluster analysis and results were developed and reviewed. Ninety-one participants completed the online questionnaire and, after missing value analysis and outlier detection, two answers were deleted resulting in a reasonably representative sample of 89 participants. Using the data collected, variance was calculated for all variables and the one with largest variance amongst those collected was taken as reference to estimate the error based on the sample size of 89 respondents. The variable chosen was “Our supplier risk management function is very well established (i.e. has a formal budget, staffing, risk software)”. This variable presented a variance score of 1.5 and standard deviation of 1.22. The calculation of the error was based on a confidence interval of 95 percent. The error of 0.253 was then estimated by using the formula suggested by Anderson et al. (2007) and the statistical power of 0.986 was calculated 10.
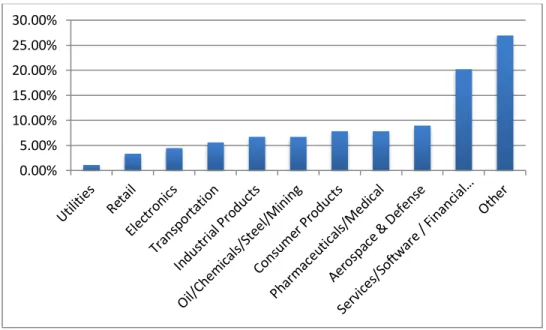
(11) considering Mayr et al. (2007). All this considered, the sample size of 89 was considered enough to conduct the study.. 5.2 Data analysis The data analysis used eight statistical procedures as follows: 1) descriptive statistics characterised the sample; 2) a one-sample t-test identified differences between scores on Importance and Action variables; 3) cluster analysis divided the sample into groups of Wishers and Doers considering the difference between variables of Importance and Action for each respondent; 4) a one-way ANOVA tested the first group of hypotheses evaluating the score differences in a group of variables comparing Wishers and Doers; 5) cluster analysis was used to divide the sample into two groups by considering the SCRM attitude identifying companies as either Leaders or Followers; 6) a one-way ANOVA tested the second group of hypotheses evaluating the differences of attitude comparing Leaders and Followers; 7) a scatterplot identified relations amongst Wishers vs. Followers and Doers vs. Leaders; and 8) crosstabs with directional measures connected the Wishers with Followers and the Doers with Leaders. Respondents were located in Asia/Pacific, Central, Eastern and Western Europe, South and North America. The participants represented different levels within the organisation: 36% were senior leadership/executives, 46% were managers and 18% were experts. 52% came from large (over 10,000 employees), 29% from medium (1,000-10,000 employees) and 19% from small companies (below 1,000 employees). The industries of these companies are shown in Figure 1. 30.00% 25.00% 20.00% 15.00% 10.00% 5.00% 0.00%. Figure 1. Industries in the sample. 11.
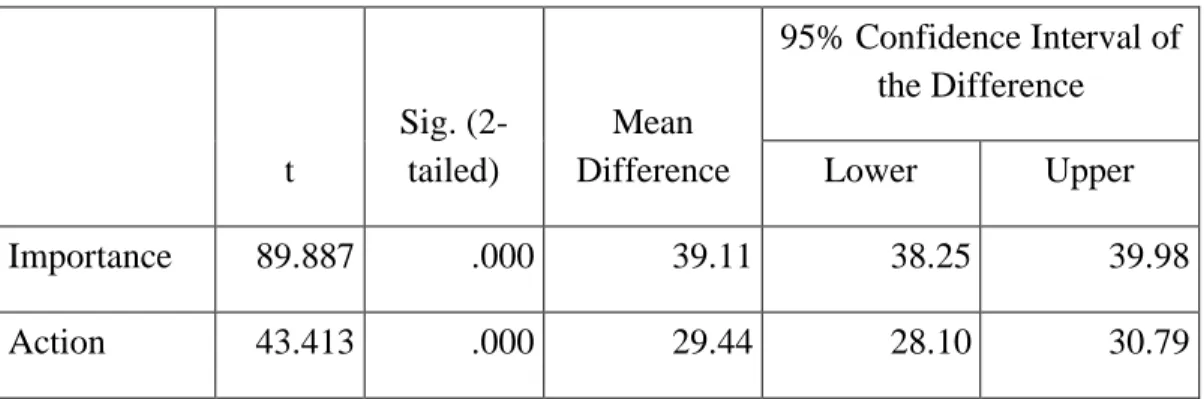
(12) In order to identify differences between the importance attributed to SCRM and the actions taken, the latent variables for Importance and Actions were computed by unit-weighted procedure, each one by summing the scores of the respective selected manifest variables from the questionnaire generating the variates for importance and actions (9 variables each were identified; see the appendix for the list of questions included). Unit-weighted is namely a method of practical utility, considered as simple and robust to create composite scores, especially when there are no measurable criterion variables available to properly estimate weights (Bobko et al., 2007; Bollen, 2002; Chin et al., 2003; Cohen, 1990; Dawes, 1979). As shown in Table 1, the difference between the score groups of importance and the score groups of action was considered significant. This can be considered as an indication that companies are not succeeding to convert the importance they attribute to SCRM into actions. 95% Confidence Interval of the Difference t. Sig. (2tailed). Mean Difference. Lower. Upper. Importance. 89.887. .000. 39.11. 38.25. 39.98. Action. 43.413. .000. 29.44. 28.10. 30.79. Table 1: Difference between means of Importance and Action Moreover, aiming to better understand such differences, an auxiliary latent variable was then computed by taking the percentage of Importance over Action scores (Importance/Action). This procedure sought to create a variable representing the relative difference between Importance and Action; the variable shows how much bigger in percentage terms Importance is than Action. Based on this auxiliary latent variable, a two-step cluster analysis was conducted using loglikelihood distance measure to verify the existence of possible groups of companies with distinct behaviours in terms of the Importance attributed and the Actions taken on SCRM. As a result, the two-step cluster analysis assessed the two clusters with a very good average silhouette measure of cohesion and separation of 0.7. Looking at the sample distribution in each cluster, cluster 1 accounted for 59 cases (66.3%) with an 18% average difference between Importance and Action while cluster 2 accounted for the remaining 30 cases (33.7%) with an 81% average difference between Importance and Action. By considering those differences, we named the respondents from cluster 1 “Doers”, with a small difference between Importance and Action, and those from cluster 2 “Wishers”, with bigger differences between Importance and Action. A set of hypotheses was then formulated in order to identify possible differences between those two groups as follows: 12.
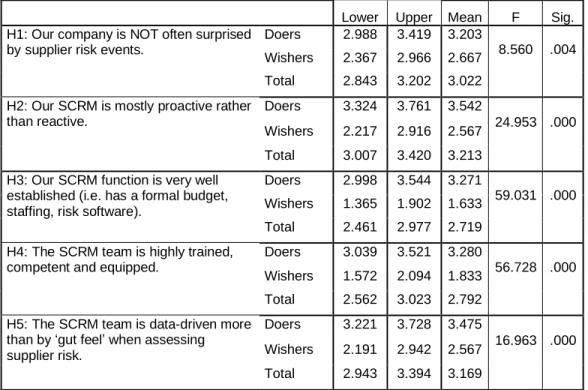
(13) H1 – Doers are surprised by SC risk events less often than Wishers. H2 – Doers are more proactive on SCRM than Wishers. H3 – Doers have a better established SCRM function than Wishers. H4 – Doers have a more trained, competent and equipped SCRM team than Wishers. H5 – Doers are more data-driven than Wishers. A one-way ANOVA test was then conducted to test each hypothesis by checking if companies in the Doers group statistically differ from those companies in the Wishers group. As shown in Table 2, all differences between Doers and Wishers proved to be highly significant, confirming all five hypotheses. However, it is very important and surprising that no statistical significant difference between Doers and Wishers was found in performance. In this sense, even though the Doers have a more established SCRM function, a more highly trained SCRM team etc., it is not possible to conclude that Doers and Wishers have different results in terms of performance.. Lower 2.988. Upper 3.419. Mean 3.203. 2.367. 2.966. 2.667. 2.843. 3.202. 3.022. 3.324. 3.761. 3.542. 2.217. 2.916. 2.567. Total. 3.007. 3.420. 3.213. Doers. 2.998. 3.544. 3.271. Wishers. 1.365. 1.902. 1.633. Total. 2.461. 2.977. 2.719. Doers. 3.039. 3.521. 3.280. Wishers. 1.572. 2.094. 1.833. Total. 2.562. 3.023. 2.792. 3.221. 3.728. 3.475. 2.191. 2.942. 2.567. 2.943. 3.394. 3.169. H1: Our company is NOT often surprised Doers by supplier risk events. Wishers Total H2: Our SCRM is mostly proactive rather Doers than reactive. Wishers. H3: Our SCRM function is very well established (i.e. has a formal budget, staffing, risk software). H4: The SCRM team is highly trained, competent and equipped.. H5: The SCRM team is data-driven more Doers than by ‘gut feel’ when assessing Wishers supplier risk. Total. F. Sig.. 8.560. .004. 24.953 .000. 59.031 .000. 56.728 .000. 16.963 .000. Table 2: One-way ANOVA tests between Doers and Wishers and 95% confidence interval for means In addition, in order to check expectation confirmation theory in the SCRM context, another latent variable was computed to represent the attitude towards SCRM by using unit-weighted procedure, summing the scores of the questions that related to SCRM attitudes; the whole list of 13.
(14) questions is in the appendix. By using the Attitude variable, another two-step cluster analysis was conducted by considering also log-likelihood distance measure. This two-step cluster analysis assessed the two clusters with a very good average silhouette measure of cohesion and separation of 0.7. Cluster 1 accounted for 45 cases (50.6%) with an average score of 23.25, while cluster 2 accounted for 44 cases (49.4%) with an average score of 15.82. Based on the average scores for each group, it was assumed that cluster 1 refers to those respondents identified as “Leaders” as they have very value-oriented attitudes to SCRM while cluster 2 refers to “Followers”. Having selected the groups of Leaders and Followers, another set of hypotheses was then formulated to identify possible differences between those two groups: H6 – SCRM practices are effective in reducing the costs involved in delivering products/services more often in Leaders than in Followers. H7 – SCRM helps increase the value of products/services for customers more often in Leaders than in Followers. H8 – SCRM can raise the firm’s stock prices more often in Leaders than in Followers. H9 – ROI on SCRM is considered as more than risk avoidance more often in Leaders than in Followers. H10 – SCRM is considered important for the future of the company more often in Leaders than in Followers. H11 – Customer satisfaction levels are higher in Leaders than in Followers. H12 – The delivery performance of products/services is higher in Leaders than in Followers. By considering those hypotheses, one-way ANOVA tests were then conducted to compare the differences between those two groups.. H6: Supplier risk management practices reduce the costs involved in delivering products/services.. Leaders Followers Total. H7: Supplier risk management is helping increase the value of our products/services for our customers.. Leaders Followers Total. H8: Effective supplier risk management can raise the firm’s stock prices.. Leaders Followers Total. H9: The ROI on supplier risk management is more than just risk avoidance.. Leaders Followers. Lower. Upper. Mean. 3.427. 3.995. 3.711. 3.265. 3.69. 3.477. 3.419. 3.772. 3.596. 3.744. 4.168. 3.956. 3.223. 3.754. 3.489. 3.551. 3.898. 3.725. 3.326. 3.83. 3.578. 3.241. 3.805. 3.523. 3.365. 3.736. 3.551. 3.797. 4.292. 4.044. 3.624. 4.058. 3.841. 14. F. Sig.. 1.757. .188. 7.72. .007. 0.086. .77. 1.548. .217.
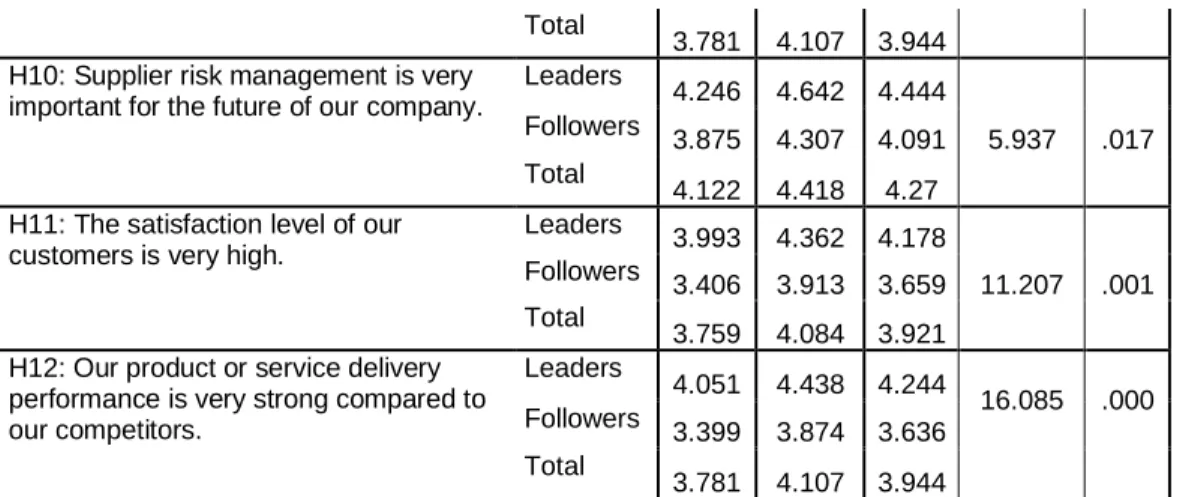
(15) Total H10: Supplier risk management is very important for the future of our company.. Leaders Followers Total. H11: The satisfaction level of our customers is very high.. Leaders Followers Total. H12: Our product or service delivery performance is very strong compared to our competitors.. Leaders Followers Total. 3.781. 4.107. 3.944. 4.246. 4.642. 4.444. 3.875. 4.307. 4.091. 4.122. 4.418. 4.27. 3.993. 4.362. 4.178. 3.406. 3.913. 3.659. 3.759. 4.084. 3.921. 4.051. 4.438. 4.244. 3.399. 3.874. 3.636. 3.781. 4.107. 3.944. 5.937. .017. 11.207. .001. 16.085. .000. TABLE 3: One-way ANOVA tests between Leaders and Followers (95% confidence interval) As shown in Table 3, performance differences proved to be highly significant between Leaders and Followers in four out of the seven hypotheses. This shows that the Leaders (who have more value-oriented attitudes towards SCRM) can achieve several tangible and intangible benefits such as a higher satisfaction level of their customers and the value delivered to them, improve delivery performance and improve the future prospects of the company. As the last step in the data analysis, a cross tabulation was conducted to compare the Leaders/Followers classification with the Doers/Wishers classification, as can be observed in Figure 2 and Table 4.. 15.
(16) Figure 2: Scatterplot relating Doers/Wishers with Leaders/Followers. WishersDoers. Doers Wishers. Total. Count Expected Count Count Expected Count Count Expected Count. LeadersFollowers Leaders Followers 43 16 29.8 29.2 2 28 15.2 14.8 45 44 45 44. Total 59 59 30 30 89 89. Table 4: Wishers/Doers vs. Followers/Leaders cross tabulation Considering the Lambda test for crosstabs, it is possible to assume that directional measures indicate that Leaders/Followers (Lambda .591, significance .000) are more likely to be considered to be predicted by Doers/Wishers than the opposite (Lambda .400, significance .065). In this sense, the fact a company behaves as a Wisher or Doer can determine if it is a Leader or a Follower in SCRM terms. In the same way, the uncertainty coefficient shows that previous information about Wishers/Doers reduces the error-predicting Leaders/Followers by 34.9% when the opposite accounts for 32.2%. Such tests support the idea of causality between both variables 16.
(17) Leaders/Followers (dependent) and Wishers/Doers (independent), meaning that companies which behave like Wishers tend to become Followers because they keep planning to do something but effectively nothing is done. On the other side, companies that behave like Doers not only plan improvements in SCRM initiatives but over time and with proper expectations of SCRM also translate such plans into actions that will make them Leaders. The results clearly show that being a Doer is only a necessary but not a sufficient condition for a better SCRM performance. Companies must change their SCRM attitudes in order to escape the trap of expecting just risk avoidance and intentionally look for value generation from SCRM.. 5.3 Insights from the qualitative part We supplemented the statistical analysis with insights from the mini case studies. The importance of the expectation of value as an outcome of SCRM is nicely explained by one Leader: “SCRM gives us better control and avoids shutting our customers down whose cost of line downtime can be USD 26,000 per minute”. Another Leader stated: “With our SCRM programme, we have earned our customers’ trust and that is getting us market share”. One of the interviewed Leaders explained the importance of value expectation well: “Our board talks about SCRM every time they meet. It is clearly a competitive opportunity in their minds”. On the other hand, a Follower stated the ‘cost’ view very well when he said “Our leaders do not want to hear about it. Our job is to make it go away. Spend the minimum and make sure nothing happens”. In a typical example illustrating the importance of expectations, a defence contractor that was classified as a Leader had anticipated the possibility of an earthquake in the area of Japan that was actually hit by the earthquake and resulting tsunami. They had “performed a very detailed, complete assessment when assessing external supplier risk”; one of the best practices we investigated in this study. They had invested in inventory and back-up supply sources as a mitigation strategy. They were not as impacted by the disaster as their competitors and saved millions in potential losses. But, most importantly, they communicated their successful SCRM to the investment market and were rewarded with an increase in the share price. They felt that their SCRM programme has given them an advantage in contracts and they have gained new customers as a result. The difference between the Wishers and Doers also came through in the mini case studies. Although most feel that SCRM actions are important, the Wishers are not implementing them to the extent they feel is necessary for successful SCRM. The lack of actions suggests a reluctance to fully implement SCRM. “There is no risk management culture” said an interviewee from a. 17.
(18) telecom company which is a Wisher. “We have risk events happening every day. The fact that there are no measures helps hide the impact on the business”. Wishers are often surprised by risk events. This makes their actions reactive rather than proactive. “My company prefers not to be proactive and would rather face the losses. There is no strategy to drive risk management efforts” said one interviewee. “If there is a strategy, it is always dynamic and short term”. In addition, risk management information about events or actions is not disseminated. Another Wisher said, “Nobody knows about what actions are taken in risk management”. The Leaders’ attitudes of SCRM’s importance are aligned with actions and commitment. One interviewed Leader described the establishment of a central risk management group and the incorporation of SCRM objectives in all procurement managers’ evaluations: “we established an SCRM culture, invested in tools and asked for commitments from procurement managers. During the Japanese tsunami crisis this more than paid for itself”. In one case, a manager from a Doer which was also a Follower clearly described the desired path to becoming a Leader. Previously, their management had viewed SCRM as a cost and, through education and actual performance, she was hoping to change this expectation from cost avoidance to value generation: “in the past, 70% of the time we were surprised by a risk event, our goal is to only be surprised close to 20% of the time. With a broader, supply chain focus we could really drive revenue increases”.. 6 Discussion and conclusion The paper is exploratory in nature and sought to open a completely new ‘line of thought’ in SCRM research by focusing on the role of expectations in how the attitudes towards, the attention given to and finally the performance of SCRM programmes develop over time. We showed that expectation confirmation theory can also be used to explain the changing attitudes to SCRM. If a company views SCRM as a cost it will take certain efforts to prevent the worst. The company will build the budget, take some actions and, if nothing happens, it will be satisfied and continue with the same approach. However, just building awareness of the importance of SCRM is insufficient. A company needs to build both a sense of the need to do something about this and, perhaps even more importantly, a proper attitude to and expectations of SCRM. Without proper expectations and the related actions (such as providing budget resources for SCRM and cross-functional collaboration), companies receive very limited value from simply believing that SCRM is important followed by the activities in the organisation such as training or establishing the SCRM function.. 18.
(19) A novel classification of companies based on their actions, importance and attitudes was also proposed. It showed that Doers are already taking appropriate actions based on the importance of SCRM for the company: they are not surprised by risk events, are more proactive, have a highly trained SCRM team and are more data-driven than Wishers. However, interestingly, there is no statistical significant difference in performance between Doers and Wishers although, obviously, many Doers are also in the Leader category which is statistically significantly more successful in SCRM. This clearly shows that, while action is important, by itself it is not enough – a proper SCRM attitude is vital. The mini case studies provided further insights and added significant context to the data. It is clear that the alignment between importance and action is critical but not sufficient. Leaders’ attitude towards SCRM is to view it as an investment and not a cost. They are aware of SCRM’s importance across the organisation, have employees from different departments actively collaborating in the SCRM process and take a proactive approach. Most importantly, they feel they gain more from SCRM than just cost avoidance. They view SCRM as an activity that is helping to increase the value of their products and services, as an advantage in delivery performance versus their competitors and as something that is very important for their company’s future. This expectation is communicated clearly within and outside the company. On the other hand, Followers are very often surprised by risk events and are reactive in their SCRM approaches. Some further insights can be derived from the correlations between various questions. In general, the ‘importance questions’ are not correlated to most other questions, except to each other. This confirms that the perception of SCRM as important is by itself insufficient; what is important is the kind of attitudes companies form. The turbulence of a company’s environment is not correlated to any other questions, which shows that SCRM can be equally beneficial in all environments (as also previously claimed by (Trkman and McCormack, 2009)). As stipulated by expectation confirmation theory, statements like “SCRM is considered an investment not a cost” and “Budget dollars are allocated specifically to SCRM” are correlated with most of the others. A company thus needs to regard SCRM as an investment and allocate funds to it. Proactivity, culture and training are also highly correlated with the other statements. The use of formal proceedings, detailed evaluation etc. do not correlate with many statements, again showing that detailed methodologies on how to carry out SCRM with their many detailed steps, formal procedures and reports are insufficient without a proper SCRM-oriented culture. Implementing formal procedures could mean that people will view them with the »more reports to be done, so then we can forget about it« attitude. Interestingly, top management support does not correlate directly with SCRM results, but it does with all kinds of SCRM practices such as formal procedures, budget allocation and training. 19.
(20) All this has important practical implications. Top management support is the mantra for any kind of organisational improvement (see e.g. (Aloini et al., 2007; Elbanna, 2013; Young and Jordan, 2008) and many others) in a way of “I do not know what the question is but I know that top management support and organizational culture is the answer”. We open this black box to actually show what kind of top management is needed. It is not enough to obtain top management support but to obtain this support for the right activities and with the right expectations from management. Basically, this means that SCRM professionals need to change their language: from emphasising the importance of implementing SCRM, proper methodologies and cost avoidance to the possibility of SCRM bringing value for the organisation. Thus, attitudes to SCRM matter more than formally implemented methodologies and expectations matter more than importance The papers suffer from many limitations that are also opportunities for further research. Some of the stipulations in the theoretical part and discussion were not investigated in the quantitative part so some conclusions are not fully supported by the statistical analysis. Some questions used in the survey were not previously validated. The statistical analysis combined various methods. The qualitative part of the research (mini case studies) should be extended to rigorous case studies in the future. An interesting question is whether it is possible to develop a set of criteria, similar to process maturity models (Van Looy et al., 2011), to measure the current state of SCRM in a company. There are, admittedly, insufficiencies related to the sample size. The relatively small dataset is compensated by the richness of the collected data. The sample was gathered by carefully selecting respondents from those considered best in class companies like Rockwell Collins, Mercedes Benz, VIVO (Brazilian Telecom), Health Shared Services BC, and AXA Insurance that brought the richness and depth of data. Further, using the key informant approach with a single respondent per organisation is potentially problematic. Although our informants occupy key positions in their firms, enhancing the credibility of their responses, survey research always generates concerns about its potential presence by using multiple respondents per company (Dekker et al., 2013) and then use multilevel analysis (Hox, 2010) to investigate how the general and personal attitudes towards SCRM are interrelated. Further, limitations due to the perceptual nature of the data used to assess the various constructs, reliance on key informants, and the possibility of mono-respondent bias and common methods variance that are common to many empirical research studies on SCRM apply to our research as well (see (Braunscheidel and Suresh, 2009)). Despite these limitations we can summarize our findings as follows: if a company sees SCRM as an investment then the whole attitude changes. This reinforces the need to optimise the investment and invest even more. It encourages the company to look for ways to focus on how 20.
(21) SCRM can deliver more value to the company. If a company views SCRM as an investment, traditional management theory says it should maintain or increase the investment until the return decreases. This should lead to the transformation of SCRM from a cost centre and/or an activity delegated to a few individuals to a value-generating effort on the organisational level.. 7 Acknowledgements The authors gratefully acknowledge the financial support of Hiperos and DRK Research Institute. Peter Trkman acknowledges the financial support from the Slovenian Research Agency (Project No. J5-6816). Marcos Paulo Valaderes de Oliveira acknowledges the financial support from the FAPES – Fundação de Amparo à Pesquisa e Inovação do Espírito Santo.. 8 References Aberdeen Group. (2008). Supply Chain Risk Management: Building a Resilient Global Supply Chain. Aloini, D., Dulmin, R., and Mininno, V. (2007). Risk management in ERP project introduction: Review of the literature. Information & Management, Vol. 44 No. 6, pp. 547-567. Altay, N., and Ramirez, A. (2010). Impact of disasters on firms in different sectors: implications for supply chains. The Journal of Supply Chain Management, Vol. 46 No. 4, pp. 59-80. Anderson, D. R., Sweeney, D. J., and Williams, T. A. (2007). Statistics for Business and Economics. London: Thomson Learning. Bhattacherjee, A. (2001). Understanding Information Systems Continuance: An ExpectationConfirmation Model. MIS Quarterly, Vol. 25 No. 3, pp. 351-370. Bobko, P., Roth, P. L., and Buster, M. A. (2007). The Usefulness of Unit Weights in Creating Composite Scores: A Literature Review, Application to Content Validity, and Meta-Analysis. Organizational Research Methods, Vol. 10 No. 4, pp. 689-709. Bollen, K. A. (2002). Latent variables in psychology and the social sciences. Annual Review of Psychology, Vol. 53 No., pp. 605-634. Brandon-Jones, E., Squire, B., Autry, C. W., and Petersen, K. J. (2014). A Contingent ResourceBased Perspective of Supply Chain Resilience and Robustness. Journal of Supply Chain Management, Vol. 50 No. 3, pp. 55-73. Braunscheidel, M. J., and Suresh, N. C. (2009). The organizational antecedents of a firm's supply chain agility for risk mitigation and response. Journal of Operations Management, Vol. 27 No. 2, pp. 119-140. Brown, S. A., Venkatesh, V., Kuruzovich, J., and Massey, A. P. (2008). Expectation confirmation: An examination of three competing models. Organizational Behavior and Human Decision Processes, Vol. 105 No. 1, pp. 52-66. Butler, B. S., and Gray, P. H. (2006). Reliability, Mindfulness, and Information Systems. MIS Quarterly, Vol. 30 No. 2, pp. 211-224. Cantor, D. E., Blackhurst, J., Pan, M., and Crum, M. (2014). Examining the role of stakeholder pressure and knowledge management on supply chain risk and demand responsiveness. The International Journal of Logistics Management, Vol. 25 No. 1, pp. 202-223. Carter, C. R., and Jennings, M. M. (2002). Social responsibility and supply chain relationships. Transportation Research Part E: Logistics and Transportation Review, Vol. 38 No. 1, pp. 37-52. 21.
(22) Chin, W. W., Marcolin, B. L., and Newsted, P. R. (2003). A Partial Least Squares Latent Variable Modeling Approach for Measuring Interaction Effects: Results from a Monte Carlo Simulation Study and an Electronic-Mail Emotion/Adoption Study. Information Systems Research, Vol. 14 No. 2, pp. 189-217. Chopra, S., and Sodhi, M. S. (2004). Managing Risk to Avoid Supply-Chain Breakdown. Sloan Management Review, Vol. 46 No. 1, pp. 53-61. Christopher, M., and Lee, H. (2004). Mitigating supply chain risk through improved confidence. International Journal of Physical Distribution & Logistics Management, Vol. 34 No. 5, pp. 388396. Chung, S. H., Tse, Y. K., and Choi, T. M. (2015). Managing Disruption Risk in Express Logistics via Proactive Planning. Industrial Management & Data Systems, Vol. 115 No. 8, pp. in press. Cohen, J. (1990). Things I have learned (so far). American Psychologist, Vol. 45 No. 12, pp. 1304-1312. Colicchia, C., Dallari, F., and Melacini, M. (2011). A simulation-based framework to evaluate strategies for managing global inbound supply risk. International Journal of Logistics Research and Applications, Vol. 14 No. 6, pp. 371-384. Colicchia, C., and Strozzi, F. (2012). Supply chain risk management: a new methodology for systematic literature review. Supply Chain Management: An International Journal, Vol. 17 No. 4, pp. 403 - 418. Craighead, C. W., Blackhurst, J., Rungtusanatham, M. J., and Handfield, R. B. (2007). The Severity of Supply Chain Disruptions: Design Characteristics and Mitigation Capabilities. Decision Sciences, Vol. 38 No. 1, pp. 131-156. Dawes, R. M. (1979). The robust beauty of improper linear models in decision making. American Psychologist, Vol. 34 No. 7, pp. 571-582. Dekker, H. C., Sakaguchi, J., and Kawai, T. (2013). Beyond the contract: Managing risk in supply chain relations. Management Accounting Research, Vol. 24 No. 2, pp. 122-139. Elbanna, A. (2013). Top management support in multiple-project environments: an in-practice view. European Journal of Information Systems, Vol. 22 No. 3, pp. 278-294. Ellis, S. C., Henry, R. M., and Shockley, J. (2010). Buyer perceptions of supply disruption risk: A behavioral view and empirical assessment. Journal of Operations Management, Vol. 28 No. 1, pp. 34-46. Ganesan, S., George, M., Jap, S., Palmatier, R. W., and Weitz, B. (2009). Supply Chain Management and Retailer Performance: Emerging Trends, Issues, and Implications for Research and Practice. Journal of Retailing, Vol. 85 No. 1, pp. 84-94. Giunipero, L., and Eltantawy, R. (2004). Securing the upstream supply chain: a risk management approach. International Journal of Physical Distribution & Logistics Management, Vol. 34 No. 9, pp. 698-713. Golicic, S. L., and Davis, D. F. (2012). Implementing mixed methods research in supply chain management. International Journal of Physical Distribution & Logistics Management, Vol. 42 No. 8/9, pp. 726-741. Guertler, B., and Spinler, S. (2015). When does Operational Risk cause Supply Chain Enterprises to Tip? A Simulation of Intra-Organizational Dynamics. Omega, Vol. 57 No. Part A, pp. 54-69.. 22.
(23) Hahn, G. J., and Kuhn, H. (2012). Value-based performance and risk management in supply chains: A robust optimization approach. International Journal of Production Economics, Vol. 139 No. 1, pp. 135-144. Hallikas, J., Karvonen, I., Pulkkinen, U., Virolainen, V.-M., and Tuominen, M. (2004). Risk management processes in supplier networks. International Journal of Production Economics, Vol. 90 No. 1, pp. 47-58. Hendricks, K. B., and Singhal, V. R. (2003). The effect of supply chain glitches on shareholder wealth. Journal of Operations Management, Vol. 21 No. 5, pp. 501-522. Hohenstein, N.-O., Feisel, E., Hartmann, E., and Giunipero, L. (2015). Research on the phenomenon of supply chain resilience: A systematic review and paths for further investigation. International Journal of Physical Distribution & Logistics Management, Vol. 45 No. 1/2, pp. 90117. Hossain, M. (2014). Development of an integrated model for RFID extension. Business Process Management Journal, Vol. 20 No. 5, pp. 752-772. Hox, J. (2010). Multilevel Analysis: Techniques and Applications: Routledge. Hubbard, D. (2009). The Failure of Risk Management: Why It's Broken and How to Fix It. Hoboken, New Jersey: John Wiley & Sons. Hult, G. T. M., Craighead, C. W., and Ketchen, J. D. J. (2010). Risk Uncertainty and Supply Chain Decisions: A Real Options Perspective. Decision Sciences, Vol. 41 No. 3, pp. 435-458. Indulska, M., Recker, J., Rosemann, M., and Green, P. (2009). Business Process Modeling: Current Issues and Future Challenges. In P. van Eck, J. Gordijn & R. Wieringa (Eds.), Advanced Information Systems Engineering (Vol. 5565, pp. 501-514): Springer Berlin / Heidelberg. ISO 31000:2009. Risk Management-Principles and Guidelines. Geneva: International Standards Organisation. Kiessling, T., Harvey, M., and Moeller, M. (2012). Supply-chain corporate venturing through acquisition: Key management team retention. Journal of World Business, Vol. 47 No. 1, pp. 8192. Klibi, W., Martel, A., and Guitouni, A. (2010). The design of robust value-creating supply chain networks: A critical review. European Journal of Operational Research, Vol. 203 No. 2, pp. 283-293. Knemeyer, A. M., Zinn, W., and Eroglu, C. (2009). Proactive planning for catastrophic events in supply chains. Journal of Operations Management, Vol. 27 No. 2, pp. 141-153. Landeta, J., Barrutia, J., and Hoyos, J. (2009). Management turnover expectations: a variable to explain company readiness to engage in continuous management training. The International Journal of Human Resource Management, Vol. 20 No. 1, pp. 164-185. Lavastre, O., Gunasekaran, A., and Spalanzani, A. (2012). Supply chain risk management in French companies. Decision Support Systems, Vol. 52 No. 4, pp. 828-838. Lavastre, O., Gunasekaran, A., and Spalanzani, A. (2014). Effect of firm characteristics, supplier relationships and techniques used on Supply Chain Risk Management (SCRM): an empirical investigation on French industrial firms. International Journal of Production Research, Vol. 52 No. 11, pp. 3381-3403. Lockamy, A. (2014). Assessing disaster risks in supply chains. Industrial Management & Data Systems, Vol. 114 No. 5, pp. 755-777. Lockamy, A., and McCormack, K. (2012). Modeling supplier risks using Bayesian networks. Industrial Management & Data Systems, Vol. 112 No. 2, pp. 313-333.. 23.
(24) Mattsson, L.-G., and Jenelius, E. (2015). Vulnerability and resilience of transport systems – A discussion of recent research. Transportation Research Part A: Policy and Practice, Vol. 81 No., pp. 16-34. Mayr, S., Buchner, A., Erdfelder, E., and Faul, F. (2007). A short tutorial of G Power. Tutorials in Quantitative Methods for Psychology, Vol. 3 No. 2, pp. 51-59. McBeath, B. (2011). 2011 Supply Chain Risk Survey Results: Part One. Newton, MA: ChainLink Research. Melnyk, S. A., Lummus, R. R., Vokurka, R. J., Burns, L. J., and Sandor, J. (2009). Mapping the future of supply chain management: a Delphi study. International Journal of Production Research, Vol. 47 No. 16, pp. 4629-4653. Narasimhan, R., and Talluri, S. (2009). Perspectives on risk management in supply chains. Journal of Operations Management, Vol. 27 No. 2, pp. 114-118. Norrman, A., and Jansson, U. (2004). Ericsson's proactive supply chain risk management approach after a serious sub-supplier accident. International Journal of Physical Distribution & Logistics Management, Vol. 34 No. 5, pp. 434-456. Oehmen, J., Ziegenbein, A., Alard, R., and Schönsleben, P. (2009). System-oriented supply chain risk management. Production Planning & Control: The Management of Operations, Vol. 20 No. 4, pp. 343 - 361. Palanisamy, R. (2005). Strategic information systems planning model for building flexibility and success. Industrial Management & Data Systems, Vol. 105 No. 1, pp. 63-81. Perez-Gonzalez, F., and Yun, H. (2013). Risk Management and Firm Value: Evidence from Weather Derivatives. The Journal of Finance, Vol. 68 No. 5, pp. 2143-2176. Petter, S. (2008). Managing user expectations on software projects: Lessons from the trenches. International Journal of Project Management, Vol. 26 No. 7, pp. 700-712. Pettit, T. J., Fiksel, J., and Croxton, K. L. (2010). Ensuring supply chain resilience: development of a conceptual framework. Journal of Business Logistics, Vol. 31 No. 1, pp. 1-21. Ponomarov, S. Y., and Holcomb, M. C. (2009). Understanding the concept of supply chain resilience. The International Journal of Logistics Management, Vol. 20 No. 1, pp. 124-143. Poon, P.-L., and Yu, Y. T. (2012). Degree of Internet corporate reporting: a research framework. Information Research, Vol. 17 No. 1, pp. Paper 509. Remus, U., and Wiener, M. (2010). A multi-method, holistic strategy for researching critical success factors in IT projects. Information Systems, Vol. 20 No. 1, pp. 25–52. Repenning, N. P., and Sterman, J. D. (2001). Nobody Ever Gets Credit for Fixing Problems that Never Happened: - Creating and Sustaining Process Improvement. California Management Review, Vol. 43 No. 4, pp. 64-88. Schmitt, A. J., and Singh, M. (2012). A quantitative analysis of disruption risk in a multi-echelon supply chain. International Journal of Production Economics, Vol. 139 No. 1, pp. 22-32. Schneider, R. J. (2008, Oct. 27, 2008). Supply Chain Risk Management: Risk in the evolving supply chain process, Industry Week. Sodhi, M. S., and Tang, C. S. (2012). Managing supply chain risk (Vol. 172). New York, Dordrecht, Heidelberg, London: Springer. Szajna, B., and Scamell, R. W. (1993). The Effects of Information System User Expectations on Their Performance and Perceptions. MIS Quarterly, Vol. 17 No. 4, pp. 493-516. Tang, C. (2006). Robust strategies for mitigating supply chain disruptions. International Journal of Logistics Research and Applications, Vol. 9 No. 1, pp. 33-45.. 24.
(25) Tang, O., and Nurmaya Musa, S. (2011). Identifying risk issues and research advancements in supply chain risk management. International Journal of Production Economics, Vol. 133 No. 1, pp. 25-34. The McKinsey Quarterly. (2006). Understanding supply chain risk: A McKinsey Global Survey. Thun, J.-H., and Hoenig, D. (2011). An empirical analysis of supply chain risk management in the German automotive industry. International Journal of Production Economics, Vol. 131 No. 1, pp. 242-249. Trkman, P., and McCormack, K. (2009). Supply chain risk in turbulent environments—A conceptual model for managing supply chain network risk. International Journal of Production Economics, Vol. 119 No. 2, pp. 247-258. Tse, Y. K., and Tan, K. H. (2012). Managing product quality risk and visibility in multi-layer supply chain. International Journal of Production Economics, Vol. 139 No. 1, pp. 49-57. Van Looy, A., De Backer, M., and Poels, G. (2011). Defining business process maturity. A journey towards excellence. Total Quality Management & Business Excellence, Vol. 22 No. 11, pp. 1119-1137. Venkatesh, V., Brown, S., and Bala, H. (2013). Bridging the Qualitative–Quantitative Divide: Guidelines for Conducting Mixed Methods Research in Information Systems. MIS Quarterly, Vol. 37 No. 1, pp. 21-54. Vilko, J. P. P., and Hallikas, J. M. (2012). Risk assessment in multimodal supply chains. International Journal of Production Economics, Vol. 140 No. 2, pp. 586-595. Wagner, S., and Neshat, N. (2012). A comparison of supply chain vulnerability indices for different categories of firms. International Journal of Production Research, Vol. 50 No. 11, pp. 2877-2891. Wang, W., and Sedera, D. (2011). A Benefits Expectation Management Framework for Supply Chain Management Systems. Paper presented at the ICIS 2011 Proceedings. Web of Science. (2015). Search term: Topic=«supply chain management« Retrieved September, 6 2015, from http://webofscience.com Wu, D. D., and Olson, D. L. (2009). Introduction to the Special Section on “Optimizing Risk Management: Methods and Tools”. Human and Ecological Risk Assessment: An International Journal, Vol. 15 No. 2, pp. 220-226. Young, R., and Jordan, E. (2008). Top management support: Mantra or necessity? International Journal of Project Management, Vol. 26 No. 7, pp. 713-725. Zhou, T. (2011). An empirical examination of users' post-adoption behaviour of mobile services. Behaviour & Information Technology, Vol. 30 No. 2, pp. 241-250. Zsidisin, G. A., and Wagner, S. M. (2010). Do perceptions become reality? The moderating role of supply chain resiliency on disruption occurrence. Journal of Business Logistics, Vol. 31 No. 2, pp. 1-20.. 25.
(26) Appendix: Questionnaire used in the survey. 1. 2. 3. 4. 5. 6.. Top management’s involvement with supplier risk management is strong. Top management’s involvement with supplier risk management is very important. Our company is never surprised by supplier risk events. Our supplier risk management is mostly proactive rather than reactive. Supplier risk management is part of the culture of our organisation. It is very important that supplier risk management is part of the culture of our organisation. 7. Supplier risk management is considered as an investment and not as a cost. 8. It is very important that supplier risk management be considered as an investment and not as a cost. 9. Budget funds are specifically allocated to supplier risk management. 10. It is very important that supplier risk management has budget funds specifically allocated to it. 11. Our supplier risk management function is very well established (i.e. has a formal budget, staffing, risk software). 12. Many functions, outside of supplier risk management, are actively involved in the process. 13. It is very important to have other functions, outside of supplier risk management, actively involved in the process. 14. We perform a very detailed, complete assessment when assessing external supplier risk. 15. It is very important to perform a very detailed, complete assessment when assessing external supplier risk. 16. We effectively measure and monitor supplier risk indicators to predict events. 17. It is very important to measure and monitor supplier risk indicators to predict events. 18. The supplier risk management team is highly trained, competent and equipped. 19. The supplier risk management team is data-driven more than by ‘gut feel’ when assessing supplier risk. 20. We have formal mechanisms to prevent knowledge spill-over by our partners (suppliers) (e.g. using the received knowledge in another situation). 21. We monitor/estimate the costs of knowledge sharing with suppliers. 22. We often deem the risks too high and decide not to share knowledge with a supplier. 23. We have different mechanisms for managing/mitigating different kinds of knowledge risks (e.g. with different partners, different kinds of knowledge). 24. We respond strongly after a ‘knowledge leak’ has occurred. 25. It is very important to manage knowledge risk. 26. Over time, we cater to many of the same customers. 27. Demand and customer tastes are fairly easy to forecast. 28. Regulation strongly affects our market. 29. New customers tend to have product-related needs that are different from our existing customers. 30. The technology in our industry is changing rapidly. 31. It is very difficult to forecast where the technology in our industry will be in the next 2–3 26.
(27) years. 32. The rate of product/service obsolescence in our industry is very high. 33. Supplier risk management practices reduce the costs involved in delivering products/services. 34. Supplier risk management is helping to increase the value of our products/services to our customers. 35. Effective supplier risk management can raise the firm’s stock prices. 36. The ROI on supplier risk management is more than just risk avoidance. 37. Supplier risk management is very important for the future of our company. 38. The satisfaction level of our customers is very high. 39. Our product or service delivery performance is very strong compared to our competitors. All questions were measured using a 5-point Likert scale (1 – Strongly disagree; 5 – Strongly agree). The variables computed for Importance were: 2, 6, 8, 10, 13, 15, 17, 25, and 37 (Cronbach’s Alpha 0.822) The variables computed for Action were: 1, 5, 7, 9, 12, 14, 16, 23, and 34 (Cronbach’s Alpha 0.850) The variables computed for Attitude were: 1, 3, 4, 5, 7, and 9 (Cronbach’s Alpha 0.811) The variables computed for Performance were: 33, 34, 35, and 36 (Cronbach’s Alpha 0.736). 27.
(28)
Figure
+2

Related documents
4 Estimating Risk and Abnormal Return: General case In this section, we formally derive our GMM-style methodology to estimate risk and return of a non-traded asset for which we
Although the present needs of the Turkish labour market may justify these activities, and such employment services are legally performed by the employment agencies in other
This study carried out a literature review of gender issues in education in the UAE and highlighted the need to study parents‟ knowledge, awareness and attitude towards female
Identification of camel milk and shubat microflora provides a theoretical foundation for developing starter cultures by using local LAB strains for industrial production of
Blended learning, when it is the “ thoughtful integration of classroom face-to-face learning experiences with online learning experiences” (Garrison & Kanuka, 204, 96),
Besides formulating and driving the strategic business direction, he is also hands on in the business operation including but not limited to new business development,
14 Nighthawks are the third seed and will play the opening game of the 2015 NCAA Division II Southeast Regional on Thursday, which features a rematch of the Peach Belt
The vehicles concerned are not subject to minimum load conditions and may travel empty if their movements consist of loading operations restricted to a zone consisting of the
