Quantum percolation phase transition and magneto-electric dipole
glass in hexagonal ferrites
S. E. Rowley1,2,3, T. Vojta4, A. T Jones1,5, W. Guo1, J. Oliveira2, F. D. Morrison6, N. Lindfield6, E. Baggio-Saitovitch2, B. E. Watts7 and J. F. Scott8
1Cavendish Laboratory, Cambridge University, J. J. Thomson Avenue, Cambridge, CB3 0HE, United Kingdom 2Centro Brasileiro de Pesquisas Físicas, Rua Dr Xavier Sigaud 150, Rio de Janeiro, 22290-180, Brazil
3Quantum Materials Laboratory, Cambridge, United Kingdom 4
Physics Department, Missouri University of Science and Technology, Missouri, 65409, United States of America 5Physics Department, Lancaster University, Lancaster, LA1 4YB , United Kingdom
6
School of Chemistry, St. Andrews University, St. Andrews, Fife, KY16 9ST, United Kingdom 7IMEM-CNR, Parco Area delle Scienze 37/A, 43124 Parma, Italy
8Schools of Chemistry and of Physics and Astronomy, St. Andrews University, St. Andrews, Fife, KY16 9ST, United Kingdom
Hexagonal ferrites do not only have enormous commercial impact (£2 billion/year in sales)
due to applications that include ultra-high density memories, credit card stripes, magnetic
bar codes, small motors and low-loss microwave devices, they also have fascinating magnetic
and ferroelectric quantum properties at low temperatures. Here we report the results of
tuning the magnetic ordering temperature in PbFe12-xGaxO19 to zero by chemical
substitution x. The phase transition boundary is found to vary as 𝑻𝑵~(𝟏 − 𝒙 𝒙⁄ )𝒄 𝟐/𝟑 with xc
very close to the calculated spin percolation threshold which we determine by Monte Carlo
simulations, indicating that the zero-temperature phase transition is geometrically driven.
We find that this produces a unique form of compositionally-tuned, insulating, ferrimagnetic
quantum criticality. Close to the zero temperature phase transition we observe the
emergence of an electric-dipole glass induced by magneto-electric coupling. The strong
frequency behaviour of the glass freezing temperature Tm has a Vogel-Fulcher dependence
composition x. These quantum-mechanical properties, along with the multiplicity of
low-lying modes near to the zero-temperature phase transition, are likely to greatly extend
applications of hexaferrites into the realm of quantum and cryogenic technologies.
M-type hexagonal ferrites (hexaferrites) including BaFe12O19, SrFe12O19 and PbFe12O19 are
popular magnetic materials for their use in a wide range of applications1,2. Moreover, they also
have interesting magnetic and ferroelectric properties at low temperatures3,4. Here we study the
effects of tuning the magnetic ordering (Néel) temperature all the way to zero resulting in a
geometrically driven zero-temperature phase transition of the underlying spin system and the
emergence of an electric-dipole glass. These novel properties are expected to be important for a
wide range of advanced quantum and cryogenic applications including, for example,
electro-caloric and magneto-caloric refrigeration,and quantum memory devices, as the materials
can be readily controlled by magnetic fields and voltage gates.
BaFe12O19, SrFe12O19 and PbFe12O19 crystalise in the magnetoplumbite structure and are
Lieb-Mattis5 ferrimagnets with Néel temperatures of approximately TN ≈ 720K and saturated
magnetisations in the low temperature limit of 20B per double formula unit6. The crystal
structure can be seen in the right inset to Fig. 1a which shows a double unit-cell. The
underlying spin structure comprises collinear anti-ferromagnetic order below TN with a total of 16
spins pointing up and 8 spins pointing down located on Fe3+ sites per double unit-cell resulting in
ferrimagnetism. The Fe3+ ions, each in the high S = 5/2 spin state, are located on five
sub-lattices as follows: six spin-up on octahedral sub-lattice (k), one spin-up on octahedral
sub-lattice (2a), one spin-up on pseudo-hexahedral sub-lattice (2b), two spin-down on tetrahedral
sub-lattice (4fIV) and two spin-down on octahedral sub-lattice (4fVI)6. The M-type hexaferrites
are n-type semiconductors7 with bandgaps of Eg ≈ 0.63 eV and rather heavy electrons and holes:
m(light e) = 5.4 me; m(heavy e) = 15.9 me; m(light h) = 10.2 me; m(heavy h) = 36.2 me and highly
anisotropic conductivity. For electric fields applied normal to the c-axis, the electrical
conductivity is circa fifty times greater than along c. An example of the hexahedral (bi-pyramid)
bi-pyramids comprise a single Fe3+ ion at the centre surrounded by five O2- ions at the corners.
The vibration of these positive ions within their negatively charged oxygen enclosures is along
the c direction and generates polar transverse-optic A2u-symmetry phonon modes. The lowest of
these is observed to drop in frequency at long wavelengths (q = 0) to 42 cm-1 (5.2meV) as T
approaches zero resulting in an incipient ferroelectric state8,9. This state has been investigated in
recent work with evidence of uniaxial ferroelectric quantum critical behaviour along the c
direction3 and anti-ferroelectric frustration on the triangular lattice of dipoles in the a-b plane4.
In this paper we study a different part of the phase diagram close to the insulating magnetic zero
temperature critical point, achieved by suppressing TN to zero by randomly substituting Ga ions
for the Fe ions in PbFe12-xGaxO19. As x increases, the lattice of spins is diluted as the
non-magnetic gallium ions act as quenched spinless impurities. This results in a drop in TN as
determined by Mössbauer and magnetic measurements6. The Mössbauer data also indicate that
the Ga ionsdistribute themselves with nearly equal probability in all the available sublattices, at
least for not too large x. As shown in Fig. 1, by extrapolating the trend to T = 0K we find that the
critical value of x for which TN goes to zero is x = xc ≈ 8.6.
The zero temperature transition between the ferrimagnetic and nonmagnetic ground states as a
function of iron concentration can either be geometrically driven or driven by quantum
fluctuations. In the first scenario, the transition is a percolation transition. It occurs when the
iron concentration falls below the percolation threshold pc of the lattice of iron sites where p is
the probability of a site containing an iron atom [related to x by x = 12(1-p) ]. Long-range
magnetic order is then impossible because the iron atoms form disconnected finite-size clusters.
In the second scenario, the zero-temperature phase transition occurs before the iron concentration
falls below pc because the magnetic order is destroyed by quantum fluctuations of the iron spins.
To help distinguishing the two scenarios, we have determined the percolation threshold of the
requires knowledge about the connectivity of the iron atoms, i.e., about the exchange interactions
between the iron atoms on the five different sub-lattices. The exchange interactions in BaFe12O19
were determined from phenomenological fits of experimental sub-lattice magnetization data in
Refs. 10 and 11. More recently, these interactions were also calculated from first principles12.
Even though the exact values of the interactions differ between these papers, they agree on the
basic structure: The four dominating interactions are between the following sub-lattices: 2a-4fIV,
2b-4fVI, 12k-4fIV, and 12k-4fVI (see Fig 1a). These interactions are antiferromagnetic, and they
are not frustrated because each couples a spin-up and a spin-down sub-lattice. All other
interactions are significantly weaker, and they are frustrated because they couple spins in the
same sub-lattice or in different sub-lattices with the same spin direction. The exchange
interactions in all the M-type hexagonal ferrites, Pb, Sr and Ba are expected to be very similar.
In our percolation simulations we have therefore only included the bonds corresponding to the
four dominating (unfrustrated) interactions. The weaker frustrated interactions may become
important at dilutions close to the percolation threshold and at low temperatures. Because they
are frustrated, they are expected to suppress the ferrimagnetic order compared to a scenario that
includes only the leading unfrustrated ones. We have further assumed that all iron sites have the
same occupation probability (i.e., the gallium doping is completely random).
To find the percolation threshold for the thus defined lattice of iron atoms, we have implemented
a version of the fast Monte Carlo algorithm due to Newman and Ziff 13. We have studied
systems with sizes of up to 200x200x200 double unit cells (192 million Fe sites), averaging over
several thousand disorder realizations for each size. The percolation threshold is determined
from the onset of a spanning cluster. Extrapolating the results to infinite system size, yields pc =
0.2628(5) where the number in brackets is the error of the last digit (estimated from the very
small statistical error of the data and the robustness of the extrapolation). In the material
PbFe12-xGaxO19, this corresponds to a gallium concentration x = 8.846(6). We note that the
percolation threshold for our realistic model of the magnetic interactions in the hexaferrites is
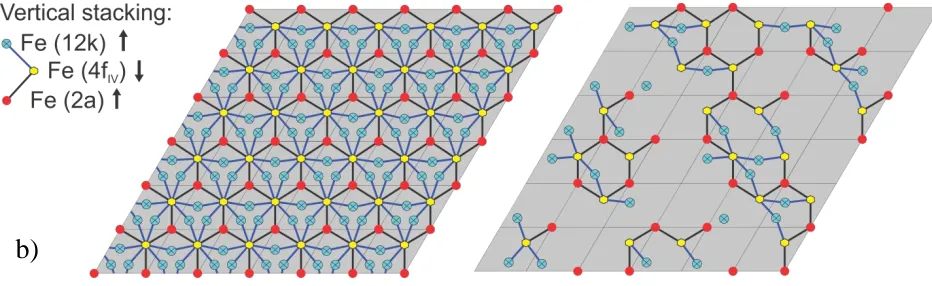
Fig. 1b shows a projection of the relevant Fe ions into the a-b plane for the parent compound (left)
and a percolating magnetic cluster (right) for x close to xc.
The experimentally observed value of xc = 8.6 is very close to that determined above from our
model calculations suggesting that the zero temperature phase transition is predominantly
geometrically driven by the percolation of magnetic ions through the crystal. The closeness of
the measured and calculated values of xc is further evidence, along with the results of Mössbauer
experiments6 mentioned above, that Ga ions are substituted randomly onto the Fe sites of the
parent compound. For x > xc, magnetic long-range order is impossible. This is confirmed by the
measured heat capacity of a sample with x = 9, shown in Fig. 2a, which does not feature a phase
transition down to the lowest measured temperatures. However, due to statistical fluctuations in
the distribution of the Ga ions, we expect disconnected Fe-rich clusters of magnetic order to exist
within a background rich in the non-magnetic Ga ions, resulting in a paramagnetic Griffiths
phase16,17. The weak hysteresis observed in the magnetisation-field curve of the x=9 sample,
shown in Fig. 2b, supports this picture as it can be attributed to the contribution to the uniform
magnetisation from the ferrimagnetic clusters. The experimental confirmation of the
paramagnetic Griffiths phase will require further study. At the percolation threshold, and for x
< xc, there is an “infinite percolation cluster” that spans the entire crystal, resulting in a finite
value of the global TN and long-range magnetic order. The point T = 0K and x = xc can be
understood as a multi-critical point (MCP) because it combines the geometrical criticality of the
zero-temperature percolation transition (characterised by the percolation critical exponents14) and
the thermal criticality of the finite-temperature phase boundary (characterised by the usual
thermodynamic critical exponents). Despite extensive theoretical work on classical and
quantum magnetic percolation phase transitions, there are relatively few experimental examples.
Notable examples include work on the square lattice two-dimensional La2Cu12-z(Zn,Mg)zO4
system18 and on transition metal halides19. PbFe12-xGaxO19 is unique in that it is a
three-dimensional hexagonal magneto-electric system that can be successfully tuned up to and
below. The fact that the measured value of xc is a little less than that determined from calculations
could be due to a small degree of Ga clustering or alternatively due to effects of quantum
fluctuations arising from the sub-dominant frustrated magnetic interactions referred to above.
As shown in Fig. 1 we find that the shape of the phase transition boundary follows a striking 𝑇𝑁~(1 − 𝑥/𝑥𝑐)2/3 dependence over the entire concentration range from x = 0 to x = xc. Where
does this power law come from? As the phase boundary starts at high temperatures (𝑇𝑁(0) = 720𝐾), one might expect 𝑇𝑁(𝑥) to follow the form predicted by classical percolation theory,
𝜇(𝑇𝑁)~ (𝑥𝑐 − 𝑥)𝜙 where 𝜇(𝑇) is the appropriate spin Hamiltonian temperature scaling
function. 𝜇(𝑇)~𝑒−2𝐽 𝑘⁄ 𝐵𝑇 for a system with Ising symmetry and 𝜇(𝑇)~𝑇 for a system with
continuous (e.g. Heisenberg) symmetry and 𝜙 is a crossover exponent usually defined as the
ratio of percolation and thermal correlation length critical exponents 𝜙 = 𝜈𝑝/𝜈𝑇 14,19-21. Over
the range of temperatures and chemical compositions tested so far, our measured 𝑇𝑁(𝑥) curve is
quite different from the predictions of these classical models in which usually 𝜙 ≥ 1.
Alternatively, the shape of the phase boundary may be governed the zero-temperature quantum
phase transition occurring as the composition x is tuned through xc. Quantum phase transitions
are subtly different from the more familiar classical phase transitions occurring as a function of
temperature at high temperatures. In the present case, the zero entropy state at T = 0 K (or at
sufficiently low temperatures for the third law of thermodynamics to apply) of long-range
ferrimagnetic order for x < xc, is transformed into a paramagnetic state with no conventional
magnetic ordering for x > xc. This zero temperature state still has zero entropy (assuming a
non-degenerate ground state). Magnetic quantum phase transitions are a highly active area of
research. Depending on specific material details (precise lattice geometry) and dimensionality,
they can lead to a rich tapestry of exotic phases such as dimer states, valence bond solids, spin
glasses, quantum spin liquids and topological entities, such as spin spiral states and others22-26. In
the presence of quenched disorder, quantum phase transitions can give rise to smeared phase
low-temperature thermodynamic functions with gapless excitations over a range of tuning
parameter variables 17,25,27,28 .
In ‘clean’ quantum critical systems, where the interactions are tuned, for example, by lattice
density or magnetic field, the effects of quantum criticality can often be felt over a wide range of
temperatures and tuning parameters below a temperature scale T* set for example by the
spectrum of magnetic excitations (𝑇∗ = ℏ𝜔∗/𝑘𝐵). In contrast to classical critical points,
thermodynamic properties near quantum critical points are affected by fluctuations of the
order-parameter field in space and time. This implies that thermodynamic quantities are functions
of the dynamical exponent z characterizing the spectrum Ω(𝑞)~𝑞𝑧 of modes close to the critical
point where q is the wavevector. For insulators where the modes are typically propagating
(heavily under-damped) Ω(𝑞) is a frequency-wavevector dispersion of the normal modes,
whereas for metals where the modes are typically dissipative (heavily over-damped) Ω(𝑞) is a
relaxation rate spectrum. If 𝑑 + 𝑧 ≥ 4 (where d is the dimension of space, thermodynamic
quantities in the quantum critical regime may be calculated by the one-loop (Hartree)
approximation used in renormalization group models and self-consistent-field models of quantum
criticality23,29-41. Close to the quantum critical point, this yields the magnetic susceptibility 𝜒~1/𝑇𝛾𝑇 where the (thermal) critical exponent 𝛾𝑇 = (𝑑 + 𝑧 − 2) 𝑧⁄ . The critical temperature
is found to vary as 𝑇𝑐~(1 − 𝑔 𝑔⁄ )𝑐 1/𝛾𝑇 where g is the (non-disorder inducing) quantum tuning
parameter. We note that the value 2/3 of the phase transition boundary exponent found in Fig. 1
would be consistent with a dynamical exponent z = 2 and d = 3. Such an exponent z in a
magnetic insulator may arise for example from the dynamics of spin precession23,25,42.
However, the situation is different in the presence of strong disorder as introduced, for example
by the dilution of the magnetic lattice. According to the Harris criterion43, disorder is typically a
relevant perturbation at a quantum phase transition and therefore destabilizes the clean critical
behavior. For the specific case of magnetic percolation quantum phase transitions, theories
terms of the fractal dimension Df of the percolation transition14 and the dynamical exponent z of
the clean quantum phase transition27,28 or they show even more unconventional activated scaling
behavior20. However, in both cases, the phase boundary is predicted to follow the classical
behavior discussed above, in disagreement with our observation.
The origin of the unusual phase transition boundary with a 2/3 power law may be due to the
interaction of magnetic and ferroelectric degrees of freedom, or the combined effects of quantum
fluctuations (arising from the frustrated magnetic interactions referred to above) and those of the
geometrically-driven percolation transition. In a future study the relative importance of these
effects may be separated by employing further tuning parameter such as pressure or field in
addition to chemical composition.
We now turn to the results of measurements of the dielectric susceptibility for samples with x
close to xc. The dielectric susceptibility probes the electrical dipole response of the system
and typical results are shown in Fig. 3. We find that for samples measured close to TN the
dielectric function exhibits a frequency dependent peak at a temperature Tm(f) in the real part
’(T), which arises from magneto-electric coupling, presumably via striction, plus a peak in the
imaginary part ”(T) at slightly lower temperatures. Spin-phonon coupling in BaFe12O19 has
been reported previously from Raman spectroscopy44-46, and detailed dynamics given by
Fontcuberta’s group47-49
. A model for dielectric loss at Néel temperatures has been given by
Pirč et al50, and their graph of ’(T) and ”(T) for low-frequency probes is given in Fig. 6 of ref. 50
for realistic parameters, assuming a magneto-electric interaction through striction. The data
indicate that polarized clusters form around TN with glassy dynamics which freeze at Tm(f).
Such a state is known as a ferroelectric relaxor or electric dipole glass51,52. Relaxor dynamics
are characterized by a broad distribution of relaxation times, and the freezing process at Tm(f) is
associated with the divergence of the longest relaxation time. The present data satisfy a
Vogel-Fulcher relationship as in Fig. 3b with frequencies f from 100 Hz to 1 MHz. The glass
below zero for samples with paramagnetic ground states x > xc. The electrically polarized
clusters which form the glass state are likely supported within the magnetic Fe rich clusters.
These magnetic clusters are of diminishing size as the Ga concentration is increased suppressing
Tm(f). Since the glass freezing temperature can be tuned through zero with frequency and
composition, future studies may involve models of a quantum dipole glass (quantum relaxor)
analogous to those studied in spin systems. Both the ferroelectric-glass and the magnetic
clusters will contribute to the heat capacity which is likely to be the origin of the non-cubic
temperature dependence as observed over any abscissa range in Fig. 2a.
In summary, randomly substituting nonmagnetic Ga ions for magnetic Fe ions in the
ferrimagnetic hexagonal ferrite PbFe12-xGaxO19 suppresses the Néel temperature to zero at a
critical composition xc close to the magnetic ion percolation threshold as calculated for the
hexaferrite structure. The phase transition boundary features a unique 𝑇𝑁~(1 − 𝑥/𝑥𝑐)2/3
dependence over a wide range of T and x. The origin of this behaviour is unexplained by theory.
Close to xc the system develops magnetic clusters and an electric-dipole glass with Vogel-Fulcher
behaviour. The magneto-electric effect raises the exciting possibility of manipulating the low
temperature magnetic phases by electric fields (voltage gates) and the electric-dipole glass by
magnetic fields. Future experimental and theoretical studies are likely to be key in elucidating
the exotic spin and electric-dipole states and their applications expected to arise close to zero
temperature phase transitions in hexaferrites.
METHODS
M-type hexaferrite crystals were prepared by the flux method. The raw powders of PbCO3, Fe2O3,
and fluxing agent Na2CO3 were weighed in the correct molar ratio and mixed well. The mixed
raw powder was put in a platinum crucible and heated to 1250°C for 24 hours in air, then cooled
down to 1100°C at a rate of 3°C/min and finally quenched to room temperature. The samples (ca.
Rigaku X-ray diffractometer. Heat capacity was measured as a function of temperature using
the relaxation technique on a 5mg sample. The low temperature DC magnetisation was
measured using a SQUID magnetometer up to fields as high as 5 T. The dielectric
measurements were carried out in a liquid-cryogen free cryostat at temperatures as low as 6 K.
Silver paste was painted on the surfaces of a thin plate of each crystal and an Andeen-Hagerling,
Agilent 4980A and QuadTech LCR instruments were used to measure the dielectric susceptibility
at frequencies in the range 100 Hz to 1 MHz.
ACKNOWLEDGEMENTS
We would like to thank M. Continentino and G. G. Lonzarich for useful help and discussions.
CONTRIBUTIONS
SER and JFS designed the project. SER, ATJ, WG, JO, FDM, NL, EBS, BEW, TV and JFS
collected the data and interpreted the results. BEW prepared the samples. TV performed the
numerical calculations. SER, TV and JFS analysed the data and wrote the paper.
FUNDING
SER and EBS acknowledge support from a CONFAP Newton grant. T.V. acknowledges support
FIGURES
Figure 1 –Magnetic phase diagram and crystal structure of PbFe12-xGaxO19. The Néel
temperature, TN ≈ 718K, in PbFe12O19 separating paramagnetic and ferrimagnetic phases is
suppressed via non-magnetic Ga substitution and tuned through a geometrically driven
percolation phase transition located at T = 0K and x = xc ≈ 8.6 as shown in (a). x = 8.6 is close
to the calculated percolation threshold x= 8.85 referred to in the main text for the hexaferrite
[image:11.612.71.537.431.574.2]structure. The right inset shows a double unit-cell of PbFe12O19 as explained more fully in the
main text with the crystallographic c direction indicated by the arrow. Values of TN were
determined by Mössbauer and magnetisation measurements6. The value of TN as a function of
Ga x in the related materials BaFe12-xGaxO19 and SrFe12-xGaxO19 differ from those shown above
for PbFe12-xGaxO19 by only a few per cent. The main figure shows 𝑇𝑁 3/2
(blue dots) plotted
against x and the straight line is a best fit to the data with an equation of the form 𝑇𝑁⁄(718 K)= (1 − 𝑥/𝑥𝑐)𝜙 with critical Ga concentration xc = 8.56, and the power-law exponent determined as
= 0.67 ± 0.02, i.e. 2/3. The region labelled (A) is where uniaxial quantum critical ferroelectric
fluctuations have recently been reported in BaFe12O19 and SrFe12O193,9. The regions labelled (B)
and (C) are where an electric-dipole glass state (ferroelectric relaxor) is observed, induced by
magneto-electric coupling as explained in the main text and later figures. The dashed line
separates the classical paramagnetic phase and the paramagnetic phase composed of disconnected
clusters of ferrimagnetic order. The region labelled (C) is where one might expect to search for
exotic spin and thermodynamic states 27,28. In (b) the left image shows a projection into the a-b
plane of the relevant magnetic ions (one spinel block shown) used in the percolation calculation
explained in the main text for the un-doped parent compound PbFe12O19. The right image
shows a percolating magnetic cluster under the conditions of magnetic dilution in PbFe12-xGaxO19
Figure 2 – Thermal and magnetization measurements in PbFe3Ga9O19 (x = 9). The heat
capacity as a function of temperature in (a) demonstrates along with Mössbauer experiments6 the
absence of a bulk phase transition and thus no long-range order in a sample with x > xc. The
[image:13.612.156.433.131.620.2]from ‘rare regions’ - small disconnected ferrimagnetic clusters - in the paramagnetic phase at low
temperatures. Close to the zero temperature percolation phase transition the magnetic clusters
are randomly distributed in space but perfectly correlated in time leading to the possibility of
singular thermodynamic functions over a range of tuning parameter variables20,28.
Figure 3 - Real and imaginary parts of the dielectric constant (a) and Vogel-Fulcher plots
(b), for PbFe12-xGaxO19 showing dipole glass behaviour. Figure (a) shows the real ’ and
[image:14.612.155.459.171.622.2]samples of PbFe12-xGaxO19, S1 and S2 with x =9.6 and x = 8.4 respecitvely. A Vogel-Fulcher fit
to the data of the peak temperature Tm versus measurement frequency f is shown for the same two
samples in (b). The Vogel-Fulcher equation is of the form 𝑓 = 𝑓0𝑒𝑥𝑝 (−𝑇𝑎/(𝑇𝑚− 𝑇𝑓)) where
the constant Ta is the activation temperature scale and f0 is a characteristic frequency. The
frequency dependent variable Tm(f) is defined as the temperature at which ’ has a peak in T as in
the example shown in (a). The constant Tf is the freezing temperature in the zero frequency
limit. For S1 the fitting parameters were Ta = 730 K, Tf = -11.7 K and f0 =3.02 x10¹¹ Hz and for
S2 they were Ta = 611 K, Tf = 18.1 K and f0 =3.00 x10¹¹ Hz.
REFERENCES
1 Pullar, R. C. Hexagonal ferrites: A review of the synthesis, properties and applications of hexaferrite ceramics. Prog. Mater. Sci.57, 1191-1334, doi:10.1016/j.pmatsci.2012.04.001 (2012).
2 Pullar, R. C. in Mesoscopic Phenomena in Multifunctional Materials: Synthesis, Characterization, Modeling
and Applications Vol. 198 Springer Series in Materials Science (eds A. Saxena & A. Planes) 159-200 (Springer-Verlag Berlin, 2014).
3 Rowley, S. E. et al. Uniaxial ferroelectric quantum criticality in multiferroic hexaferrites BaFe12O19 and SrFe12O19. Scientific Reports6, doi:25724
10.1038/srep25724 (2016).
4 Shen, S. P. et al. Quantum electric-dipole liquid on a triangular lattice. Nat. Commun.7, doi:10569 10.1038/ncomms10569 (2016).
5 Lieb, E. & Mattis, D. ORDERING ENERGY LEVELS OF INTERACTING SPIN SYSTEMS. Journal of Mathematical
Physics3, 749-+, doi:10.1063/1.1724276 (1962).
6 Albanese, G., Leccabue, F., Watts, B. E. & Diaz-Castanon, S. Magnetic and Mossbauer investigation of
PbFe12-xGaxO19 hexagonal ferrites. J. Mater. Sci.37, 3759-3763, doi:10.1023/a:1016529812985 (2002).
7 Fang, C. M., Kools, F., Metselaar, R., de With, G. & de Groot, R. A. Magnetic and electronic properties of
strontium hexaferrite SrFe12O19 from first-principles calculations. Journal of Physics-Condensed Matter15, 6229-6237, doi:Pii s0953-8984(03)63135-8
10.1088/0953-8984/15/36/311 (2003).
8 Mikheykin, A. S. et al. Lattice anharmonicity and polar soft mode in ferrimagnetic M-type hexaferrite BaFe12O19 single crystal. European Physical Journal B87, doi:232
10.1140/epjb/e2014-50329-4 (2014).
9 Shen, S. P. et al. Magnetic-ion-induced displacive electric polarization in FeO5 bipyramidal units of (Ba,Sr)Fe12O19 hexaferrites. Phys. Rev. B90, doi:180404
10 Grill, A. & Haberey, F. Effect of Diamagnetic Substitutions in Bafe12o19 on Magnetic-Properties. Appl Phys
3, 131-134, doi:Doi 10.1007/Bf00884410 (1974).
11 Isalgue, A., Labarta, A., Tejada, J. & Obradors, X. Exchange Interactions in Bafe12o19. Appl Phys a-Mater39, 221-225, doi:Doi 10.1007/Bf00620738 (1986).
12 Wu, C. J. et al. Calculation of exchange integrals and Curie temperature for La-substituted barium hexaferrites. Scientific Reports6, doi:Artn 36200
10.1038/Srep36200 (2016).
13 Newman, M. E. J. & Ziff, R. M. Fast Monte Carlo algorithm for site or bond percolation. Physical Review E
64, doi:Artn 016706
Doi 10.1103/Physreve.64.016706 (2001).
14 Stauffer, D. & Aharony, A. Introduction to percolation theory. Rev. 2nd ed. edn, (Taylor & Francis, 1994). 15 Schrenk, K. J., Araujo, N. A. M. & Herrmann, H. J. Stacked triangular lattice: Percolation properties. Physical
Review E87, doi:032123 10.1103/PhysRevE.87.032123 (2013).
16 Griffiths, R. B. NONANALYTIC BEHAVIOR ABOVE CRITICAL POINT IN A RANDOM ISING FERROMAGNET. Phys.
Rev. Lett.23, 17-+, doi:10.1103/PhysRevLett.23.17 (1969).
17 Vojta, T. Rare region effects at classical, quantum and nonequilibrium phase transitions. J Phys a-Math Gen
39, R143-R205, doi:10.1088/0305-4470/39/22/R01 (2006).
18 Vajk, O. P., Mang, P. K., Greven, M., Gehring, P. M. & Lynn, J. W. Quantum impurities in the
two-dimensional spin one-half Heisenberg antiferromagnet. Science 295, 1691-1695,
doi:10.1126/science.1067110 (2002).
19 Birgeneau, R. J., Cowley, R. A., Shirane, G. & Yoshizawa, H. PHASE-TRANSITIONS IN DILUTED MAGNETS -
CRITICAL-BEHAVIOR, PERCOLATION, AND RANDOM-FIELDS. Journal of Statistical Physics 34, 817-848,
doi:10.1007/bf01009443 (1984).
20 Senthil, T. & Sachdev, S. Higher dimensional realizations of activated dynamic scaling at random quantum
transitions. Phys. Rev. Lett.77, 5292-5295, doi:10.1103/PhysRevLett.77.5292 (1996).
21 Coniglio, A. THERMAL PHASE-TRANSITION OF THE DILUTE S-STATE POTTS AND N-VECTOR MODELS AT THE
PERCOLATION-THRESHOLD. Phys. Rev. Lett.46, 250-253, doi:10.1103/PhysRevLett.46.250 (1981).
22 Sachdev, S. Quantum magnetism and criticality. Nat. Phys.4, 173-185, doi:10.1038/nphys894 (2008).
23 Sachdev, S. Quantum phase transitions. Second edition. edn, (Cambridge University Press, 2011).
24 Wen, X.-G. Quantum field theory of many-body systems : from the origin of sound to an origin of light and
electrons. (Oxford University Press, 2004).
25 Sachdev, S. & Senthil, T. Zero temperature phase transitions in quantum Heisenberg ferromagnets. Ann.
Phys.251, 76-122, doi:10.1006/aphy.1996.0108 (1996).
26 Balz, C. et al. Physical realization of a quantum spin liquid based on a complex frustration mechanism. Nat
Physadvance online publication, doi:10.1038/nphys3826
http://www.nature.com/nphys/journal/vaop/ncurrent/abs/nphys3826.html#supplementary-information (2016). 27 Vojta, T. in Lectures on the Physics of Strongly Correlated Systems Xvii Vol. 1550 AIP Conference
Proceedings (eds A. Avella & F. Mancini) 188-247 (2013).
28 Vojta, T. & Schmalian, J. Percolation quantum phase transitions in diluted magnets. Phys. Rev. Lett. 95, doi:237206
10.1103/PhysRevLett.95.237206 (2005).
Phys. JETP33, 423 (1971).
30 Khmelnitskii, D. E. & Shneerson, V. L. Low-temperature displacement-type phase transition in crystals. Sov. Phys. - Solid State13, 687 (1971).
31 Khmelnitskii, D. E. & Shneerson, V. L. Phase transition of the displacement type in crystals at very low temperature. Sov. Phys. JETP37, 164 (1973).
32 Murata, K. K. & Doniach, S. THEORY OF MAGNETIC FLUCTUATIONS IN ITINERANT FERROMAGNETS. Phys.
Rev. Lett.29, 285-&, doi:10.1103/PhysRevLett.29.285 (1972).
33 Moriya, T. & Kawabata, A. EFFECT OF SPIN FLUCTUATIONS ON ITINERANT ELECTRON FERROMAGNETISM. J.
Phys. Soc. Jpn.34, 639-651 (1973).
34 Moriya, T. & Kawabata, A. EFFECT OF SPIN FLUCTUATIONS ON ITINERANT ELECTRON
FERROMAGNETISM .2. J. Phys. Soc. Jpn.35, 669-676, doi:10.1143/jpsj.35.669 (1973).
35 Ramakris.Tv. MICROSCOPIC THEORY OF SPIN FLUCTUATIONS IN ITINERANT-ELECTRON FERROMAGNETS .1.
PARAMAGNETIC PHASE. Phys. Rev. B10, 4014-4024, doi:10.1103/PhysRevB.10.4014 (1974).
36 Dzyaloshinskii, I. E. & Kondratenko, P. S. THEORY OF WEAK FERROMAGNETISM IN A FERMI FLUID. Zhurnal
Eksperimentalnoi Teor. Fiz.70, 1987-2005 (1976).
37 Hertz, J. A. QUANTUM CRITICAL PHENOMENA. Phys. Rev. B14, 1165-1184, doi:10.1103/PhysRevB.14.1165
(1976).
38 Lonzarich, G. G. & Taillefer, L. Effect of Spin Fluctuations on the Magnetic Equation of State of Ferromagnetic or Nearly Ferromagnetic Metals. J Phys C Solid State18, 4339-4371 (1985).
39 Millis, A. J. Effect of a Nonzero Temperature on Quantum Critical-Points in Itinerant Fermion Systems. Physical Review B48, 7183-7196 (1993).
40 Rowley, S. E. et al. Ferroelectric quantum criticality. Nature Physics 10, 367-372, doi:Doi
10.1038/Nphys2924 (2014).
41 Continentino, M. A. Quantam scaling in many-body systems. (World Scientific, 2001).
42 Lonzarich (Ch. 6), G. G. & Springford (Editor), M. Electron : a centenary volume. (Cambridge University Press, 1997).
43 Harris, A. B. Effect of Random Defects on Critical Behavior of Ising Models. Journal of Physics C-Solid State
Physics7, 1671-1692, doi:Doi 10.1088/0022-3719/7/9/009 (1974).
44 Chen, X. B., Hien, N. T. M., Yang, I. S., Lee, D. & Noh, T. W. A Raman Study of the Origin of Oxygen Defects in Hexagonal Manganite Thin Films. Chin. Phys. Lett.29, doi:126103
10.1088/0256-307x/29/12/126103 (2012).
45 Nguyen, T. M. H., Han, K., Chen, X. B., Sur, J. C. & Yang, I. S. Raman scattering studies of spin-waves in
hexagonal BaFe12O19. Journal of Raman Spectroscopy43, 2020-2024, doi:10.1002/jrs.4100 (2012).
46 Chen, X. B. et al. Raman studies of spin-phonon coupling in hexagonal BaFe12O19. J. Appl. Phys. 114, doi:013912
10.1063/1.4812575 (2013).
47 Muller, J. & Collomb, A. A NEW REPRESENTATION OF THE BIPYRAMIDAL SITE IN THE SRFE12O19 M-TYPE
HEXAGONAL FERRITE BETWEEN 4.6-K AND 295-K. J. Magn. Magn. Mater. 103, 194-203,
doi:10.1016/0304-8853(92)90253-k (1992).
48 Fontcuberta, J. & Obradors, X. DYNAMICS OF THE BIPYRAMIDAL IONS IN SRFE12O19 STUDIED BY
MOSSBAUER-SPECTROSCOPY. Journal of Physics C-Solid State Physics 21, 2335-2345,
doi:10.1088/0022-3719/21/12/016 (1988).
AND DYNAMIC PROPERTIES OF BAFE12O19 HEXAGONAL FERRITE AT ROOM-TEMPERATURE. J. Solid State Chem.56, 171-181, doi:10.1016/0022-4596(85)90054-4 (1985).
50 Pirc, R., Blinc, R. & Scott, J. F. Mesoscopic model of a system possessing both relaxor ferroelectric and relaxor ferromagnetic properties. Phys. Rev. B79, doi:214114
10.1103/PhysRevB.79.214114 (2009).
51 Samara, G. A. in Solid State Physics, Vol 56 Vol. 56 Solid State Physics (eds H. Ehrenreich & F. Spaepen) 239-458 (Elsevier Academic Press Inc, 2001).