Beyond Internet Scanning: Banner Processing
for Passive Software Vulnerability Assessment
B ´ela Genge, Piroska Haller, and C ˘alin En ˘achescu Petru Maior University of Tg. Mures¸, Department of Informatics.
N. Iorga street, No. 1, Tg. Mures¸, Mures¸, Romania e-mail: [email protected], [email protected], [email protected]
Abstract—Nowadays, the increasing number of devices and services that require a direct Internet access, creates new security challenges. These challenges need to meet user feature-based requirements with the companies’ restrictive security policies. Therefore, security administrators need to adopt novel tools in order to quickly and non-intrusively verify the degree of exposure of facing services. In this respect, we find tools such as Shodan and ZMap, which enable scanning of services at an Internet-scale. Scan results can deliver significant details on service version, patches, and configuration. Subsequently, these can expose valuable information about known software vulnerabilities, which may be exploited by malicious actors. Therefore, this work studies the degree of service exposure by means of banner analysis. Experiments conducted on five university-type institutions revealed that banner analysis is not “old fashioned” and that immediate measures need to be taken in order to secure sensitive services. Keywords—Vulnerability assessment; Internet scanning; Common Platform Enumeration (CPE); Common Vulnerability and Exposure (CVE); National Vulnerability Database (NVD).
1.
Introduction
Recent surveys report an increasing trend on the number of devices directly accessible from Internet. In fact, predictions indicate that more than 25 billion devices are going to be accessible from the Internet by 2015 and approximately 50 billion devices by year 2020 [1]. Among these we find a wide palette of devices ranging from sensors and actuators, Ra-dio Frequency Identification-based devices (RFID), industrial equipment, video surveillance cameras, to generic PCs and networking devices.
The intrinsic mechanisms behind the automated discovery of Internet-facing services have been re-cently reshaped by the advancements in the field of
Internet scanning. Novel tools such as ZMap [2] are nowadays capable of delivering accurate results in less than 45 minutes. This effectively means that a single user machine may scan today the entire IPv4 address space in a time frame of tens of minutes. On one hand, the increase of scan speeds may give Internet topology analysts the necessary data to improve the current architecture. On the other hand, however, these powerful tools may also be used to discover vulnerable services and more generally, critical network access points [3], [4]. As shown by a study performed by Durumeric,et al.[4] modern Internet scanning tools such as ZMap may be applied to identify vulnerable services. Taking for instance theHeartbleed vulnerability, a publicly
ac-knowledged (April 2014) implementation bug in the popular OpenSSL library, an attacker may remotely read the memory of Web servers, including private data, e.g., private cryptographic keys. Consequently, attackers “equipped” with powerful Internet-scale mapping tools such as ZMap may rapidly identify vulnerable services, possibly in less time than it takes security administrators to deploy software patches/configurations.
On top of the above-mentioned advancements and possible threats, the Internet scanning community is developing novel search engines aimed at iden-tifying devices and services directly connected to Internet. One of the most popular search engines within this class is Shodan [5], designed to crawl the Internet and to index all common services. Shodan is able to index a wide variety of services and devices ranging from traditional Internet services such as Web servers, FTP servers, and SSH servers, to non-traditional devices such as Web cameras, network switching equipment, and industrial hard-ware [6], [7]. Despite the implemented limitations on the number of returned scan results, tools such as Shodan and ZMap are freely available to the general public. Moreover, taking into account the massive “publicity” and debates that followed the release of these tools [8], security designers are faced with new challenges, which require urgent measures to secure services exposed to Internet.
In this work we argue that despite important ad-vancements in the field of vulnerability assessment and most importantly in the traditional field of penetration testing, i.e., “pen-testing”, the majority of services directly accessible from Internet are still exposing sensitive information. Subsequently, we demonstrate that results returned by search en-gines such as Shodan, but also by network asset discovery tools such as PRADS and p0f may be used to infer intrinsic service details and most
importantly to identify known service vulnerabili-ties. Subsequently, our study confirms well-known recommendations [9] on reducing the degree of ser-vice exposure through the implementation of well-established security measures, e.g., closing unused ports, deploying firewalls, and sanitizing banners. The adopted methodology brings together several tools and methods from the field of vulnerability assessment. More specifically, it builds on results returned by network asset discovery tools, e.g., Shodan and PRADS, in order to extract sensitive banner information, and uses the National Vul-nerability Database to automatically identify vul-nerabilities associated to each discovered service. We show that “unsanitized” service banners, i.e., banners with vendor and version numbers, may in-clude significant information on services which may then be used to identify vulnerable software. These results may be maliciously used by an attacker to identify in a stealthy scan the most vulnerable service and ultimately the most feasible access point to critical assets. Experimental results conducted on the services of five different university-like institu-tions demonstrate the effectiveness of the proposed approach and its applicability to non-intrusive vul-nerability assessment.
The remainder of this paper is organized as fol-lows. A brief overview of related work is given in Section 2. A discussion on vulnerability reports as well as the presentation of the proposed methodol-ogy are detailed in Section 3. Then, experimental results conducted on five different university-like institutions are presented in Section 4. The paper concludes in Section 5.
2.
Related Work
In the field of network asset discovery we can find several tools such as p0f [10] and PRADS
TABLE 1
Comparison of related techniques. Passive Active Vulnerability Method asset disco. asset disco. reports
p0f X PRADS X ZMap X NetGlean X Nessus X X PVAT X X
distinguish between specific products and version numbers. These tools generate a list of discovered assets from network traffic capture files. Compared with such approaches, the methodology proposed in this work goes further and identifies specific vulnerabilities, which are extracted from the well-known National Vulnerability Database (NVD).
Nessusis an “all-in-one” vulnerability assessment
tool [12]. It actively probes services in order to test for known vulnerabilities and possible service configuration weaknesses. WhileNessusis anactive
vulnerability scanner, the method proposed in this paper is a passive scanner, which does not require to directly interact with the analyzed services.
Finally, we mention NetGlean [13], which pro-vides a real-time view on the analyzed system. It continuously monitors the underlying network infrastructure and constructs machine fingerprints based on a variety of system features such as installed services, OS name and version, and so on. Compared toNetGlean, the method proposed in this paper goes further and is capable to automatically identify (known) vulnerabilities, and to produce meaningful service reports to security experts. A comparison of the features exposed by various tools and approaches is given in Table 1.
3.
Methodology
This section presents the methodology used in the process of revealing known service vulnerabilities. We start with an overview of network asset dis-covery tools and of vulnerability reports, and we continue with the presentation of the undertaken methodology.
3.1. Network Asset Discovery
Over the years various network asset discovery tools have been proposed. As stated above, state of the art instruments include p0f [10], PRADS [11], ZMap [2], and the popular service search engine Shodan [5].
Within the above-mentioned list, p0f andPRADS
fall into the category of passive network asset discovery tools. They are well-suited to analyze network traffic and to identify well-known service patterns. This entails, however, that such patterns are accurately defined before the analysis in order to ensure precise results.
ZMap [2], on the other hand, is an active scanning tool. Once it is launched, it applies different OS and protocol signatures in order to discover services and to identify version numbers.
Lastly, we mention Shodan, launched in 2009 by programmer John Matterly. It is a computer search engine equipped with a graphical user in-terface that can identify Internet-facing devices and services. Shodan crawls the Internet for available devices and services and stores the collected data, namely IP address, port and service banner in a database accessible via http://www.shodanhq.com or via Shodan API. At the beginning, Shodan in-dexed basic services such as Telnet, FTP, SSH, and HTTP. However, the complete list of services in-dexed by Shodan has been continuously expanding to cover more than 80 services.
Shodan provides APIs for Python, Ruby, and
NodeJS languages. Given the popularity and wide-spread use of the Python language, in the following we provide a brief example on the steps required to query Shodan’s database via itsPython
API. Let us consider the following few lines of code: 1.from shodan import Shodan
2.api = Shodan(settings.Shodan.API_KEY)
3.result = api.host(host)
The previous lines provide a simple example on the use of Shodan’s API to return information on one specific host, i.e., IP. Line 1 is used to import Shodan’s main module, while line 2 instantiates the
Shodan class. In this second line the API_KEY
is the user key that is automatically generated by Shodan’s Web portal for each newly registered user. Finally, line 3 callshost()function which returns the information stored in Shodan database on the requested host’s IP address. Results are returned in JSON format. A selection of fields extracted from a result returned by Shodan is given below. The complete JSON result can be found at [14].
"region_code": null, "ip": "41.21.249.170", "area_code": null,
"country_name": "South Africa", "country_code": "ZA",
"data": [ {
"product": "Siemens HiPath 3000 telnetd", "os": null,
"timestamp": "2014-01-12T18:25:41", "isp": "Vodacom",
"asn": "AS36994",
"banner": "*********************** HiPath 3000
Telnet **** ** Adjust the Telnet ** window to the ** visible frame * *************************" }
]
3.2. National Vulnerability Database
Essentially, vulnerabilities are software flaws, which may allow malicious actors to perform illicit operations such as altering data, take control of underlying Operating System, or to expose and even destroy valuable/sensitive information. In the early years of vulnerability reports (during the ’90s) companies used to write custom vulnerability de-scriptions which included – more or less – the same information needed to identify the vulnerable soft-ware, possible exploits and the impact of executing exploits. However, the wide variety of vulnerability reports have lead to incompatibilities, to multiple reports on the same software bugs and to an untrace-able state of vulnerabilities. As a solution to these problems the Common Vulnerability and Exposure (CVE) was released in 1999. Its aim was to provide a uniform vulnerability naming convention in order to facilitate dissemination of vulnerability-related information.
One of the most well-established vulnerabil-ity databases, the National Vulnerabilvulnerabil-ity Database (NVD), builds on the information provided by CVE. NVD is meant to “enable(s) automation of vul-nerability management, security measurement, and compliance” and it is often viewed as the “ground truth” for software vulnerability assessment [15]. The CVE entries available in NVD include a variety of fields such as a brief overview of the vulnerabil-ity, external references to advisories, impact rating, and a list of vulnerable software.
At the heart of every CVE entry lies the Com-mon Platform Enumeration (CPE), “a standardized method of describing and identifying classes of ap-plications, operating systems, and hardware devices present among an enterprise’s computing assets” [16]. CPE names provide information on software vendor, name, version, language, edition, etc.
3.3. Problem Statement
As mentioned before, today we are witnessing a new stage of development in the field of Internet scanning. As a result, we find powerful new publicly available tools, which have the ability to scan the full IPv4 address space in under 45 minutes [2]. Furthermore, with the development of device and service-oriented search engines such as Shodan [5], we unveil the complex shape of the Internet and its services. As a result, new tools and methodologies are available, which can seamlessly return results on previously identified Internet-facing services.
Despite the variety of the available tools we are missing an automated identification of service vulnerabilities discovered by non-intrusive tools such as Shodan. Besides the traditional information pertaining to service description, banner, location, the identification of vulnerabilities would provide further insight into the degree of service exposure in terms of the number and severity of discovered (known) vulnerabilities. In essence, such a method-ology needs to encapsulate the ability to commu-nicate with service discovery tools, automated CPE name reconstruction from the available information, as well as the ability to automatically extract CVE entries from NVD. These elements provide the necessary capabilities to assist security experts in the analysis of Internet-facing services.
It is noteworthy that by leveraging the non-intrusive and slow-rate scanning algorithms imple-mented within search engines such as Shodan, the
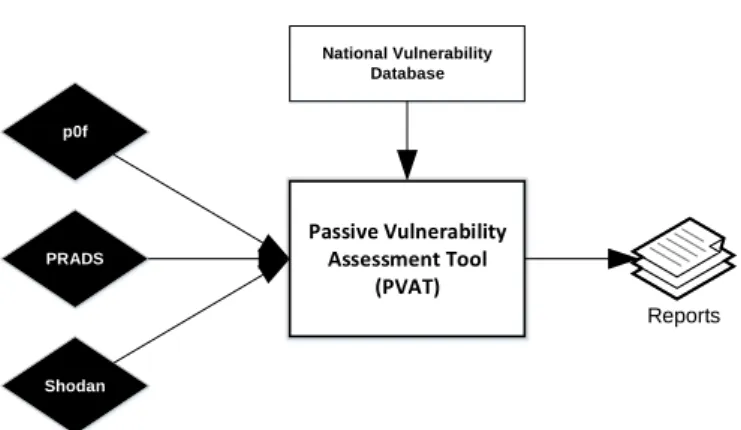
Passive Vulnerability Assessment Tool (PVAT) Reports p0f National Vulnerability Database PRADS Shodan
Fig. 1. Architecture of the undertaken vulnera-bility assessment methodology.
vulnerability assessment can also be seen as non-intrusive and applicable off-line, therefore, falling into the category of passive vulnerability assessment instruments. This provides an important asset in the tool-chain of security experts, which may be applied at early service analysis phases.
3.4. Methodology for Vulnerability Assessment
The undertaken methodology for the identification of (known) vulnerabilities encapsulates the results returned by network asset discovery tools such as
p0f, PRADS, and Shodan, and the data available
in National Vulnerability Database. Subsequently, key heuristic algorithms are implemented in order to reconstruct CPE names from service banners and to automatically extract CVE entries from NVD.
The architecture of the proposed methodology is given in Fig. 1. Here, the passive vulnerability assessment tool (PVAT) leverages the output of network asset discovery tools in order to identify the list of hosts, services, and ultimately service banners. At the same time, from NVD it downloads the set of all available (known) vulnerabilities and it stores them locally for further processing.
In the reconstruction of CPE names PVAT uses the list of known CPEs downloaded from NVD and it
processes service banners in the attempt to identify keywords that are also found in known CPEs. Since NVD is updated on a daily basis, the list of CPEs used by PVAT in the assessment process needs to be recompiled when new NVD data files are made available. For this purpose PVAT includes a module that automatically verifies the availability of updates in NVD, and it downloads CVE files (given in XML format) once an update is available. Based on CVE files this particular model compiles a list of all CPE names and these are made available to the steps that follow.
In order to reduce the state-space, the search builds on the assumption that in general, vulnerabili-ties are associated to software version numbers. As a result, the first step of the CPE name reconstruction procedure is the identification of version numbers in service banners. Once these version numbers are identified, an in-memory hash table is built to ensure quick search and access to CPE version numbers. The procedure continues with the search of keywords that are also found in the list of CPEs associated with a specific version number. Once a CPE is found to match all keywords, it is placed in the list of possible CPEs that may identify a CVE entry.
In the next phase of the vulnerability assessment, PVAT uses the list of reconstructed CPEs in order to identify CVEs. CVEs are stored in an in-memory graph structure, which associates CPEs to CVEs. However, the procedure is not as straight-forward as one might think, since PVAT needs to account for boolean operators defined for each CVE entry. In fact, CVEs may contain one or more AND/OR sections which denote operators applied on CPEs that are needed for the CVE to be applicable in a specific software context. This is a significant aspect in vulnerability assessment, since in certain cases vulnerabilities depend on the underlying Operating
Systems (OS), as well as a variety of modules and installed software. As a result, PVAT needs to take into account all possible CPEs identified in the previous phases, as well as the boolean operators applied on them.
The output of PVAT is a list of services and their associated vulnerabilities. PVAT also produces elementary reports in the form of PNG image files which classify different services and the number of discovered vulnerabilities.
4.
Experimental Results
This section presents details on the experiments performed with the automated vulnerability as-sessment tool/methodology (PVAT). At first, we present experiments concerning the data returned by Shodan. Then, we present the analysis on the data returned by PRADS given a simple network experimentation topology.
4.1. Scenario A: Experiments With Shodan and PVAT
The experiments aim at showing the degree of exposure of traditional services. We illustrate that the lack of elementary protective measures such as sanitizing service banners and limiting the number of opened ports, may lead to highly visible services which may ultimately “attract” attackers.
For this purpose we have selected five 24-bit IP address blocks (class ’C’ sub-nets) associated to University-type institutions from different member states of the European Union. The selected IP blocks have been carefully verified in order to ensure that they are assigned to the selected institutions. In the experiments that follow we use Ui to denote the i-th University, where i ∈ {1,2,3,4,5}. Next, we launched PVAT with each of the selected IP
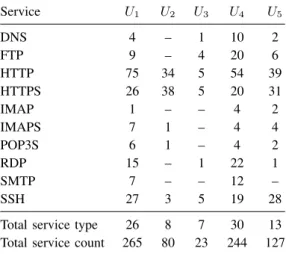
TABLE 2
Discovered service types and hosts. Service U1 U2 U3 U4 U5 DNS 4 – 1 10 2 FTP 9 – 4 20 6 HTTP 75 34 5 54 39 HTTPS 26 38 5 20 31 IMAP 1 – – 4 2 IMAPS 7 1 – 4 4 POP3S 6 1 – 4 2 RDP 15 – 1 22 1 SMTP 7 – – 12 – SSH 27 3 5 19 28
Total service type 26 8 7 30 13 Total service count 265 80 23 244 127
address blocks and with the Shodan communication module enabled in the attempt to identify services, to reconstruct CPE names, and to identify known CVE entries.
First, we look at the number and type of discov-ered services for each University. As depicted in Table 2, the number of discovered services ranges from 23 in the case of U3 to 265 in the case of U1,
while the number of services for U2 is of 80, for U4 is of 244, and for U5 is of 127. Within the list
of services we have found traditional HTTP/HTTPs services, as well as DNS, FTP, and HTTP services. Nevertheless, we have also found less common services such as SNMP, which is usually specific to network switching/routing devices.
On the other hand, as shown in Table 2, the number of discovered services is not necessarily proportional to the number of type of services. For example, in the case of U1 we have found 265
services, and 26 different types of services, while in the case of U4 we have found 244 services, and 30 different types of services.
Next, we launched PVAT’s CPE name recon-struction algorithm on the five different IP blocks. Surprisingly, PVAT identified more than 80 CPEs
University1 University2 University3 University4 University5 0 20 40 60 80 100 120
Number of CPE names
Fig. 2. The number of reconstructed Common Platform Enumeration (CPE) names.
in the case of four Universities, and 31 CPE names in the case of U3. A closer analysis of these CPEs
revealed various products and versions. Most of the CPEs, however were linked to HTTP and HTTPs services. Nevertheless, CPE names have been also discovered for SNMP, FTP, as well as SSH.
More specifically, as illustrated in Fig. 2 and numerically in Table 3, in the case of U1 PVAT
reconstructed 90 CPEs, for U2 89 CPEs, for U3
31 CPEs, for U4 118 CPEs, and finally, for U5 it
reconstructed 79 CPEs. Considering the potential vulnerabilities associated to each of these CPEs, we believe that the discovered CPE names are a clear illustration of the high degree of exposure of the analyzed institutions. It is noteworthy that since the analysis performed by PVAT is offline and it relies exclusively on the correctness of data provided by third-party software, the actual conclusions need to be carefully formulated. Nevertheless, the high number of CPEs returned by PVAT are a clear confirmation of the highly powerful capabilities of service banner-based analysis, which is one of the first steps that an attacker might take in the process of compromising vital Internet-facing services.
In the next phase of the analysis we launched PVAT’s CVE entry identification module. The mod-ule loaded an in-memory mapping of the entire
University1 University2 University3 University4 University5 0 100 200 300 400 500 600
Number of CVE entries
Fig. 3. The number of identified Common Vul-nerability and Exposure (CVE) entries.
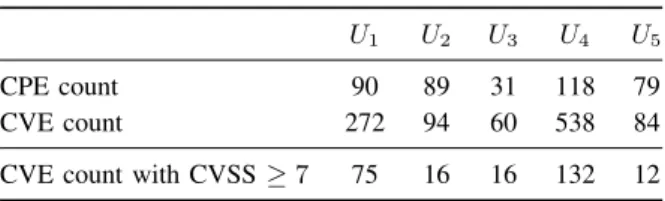
TABLE 3
The number of discovered CPE names and CVE entries.
U1 U2 U3 U4 U5
CPE count 90 89 31 118 79
CVE count 272 94 60 538 84
CVE count with CVSS≥7 75 16 16 132 12
NVD database and used hash-based tables for quick access to CVE entries. By using the set of recon-structed CPE names from the previous phase, CVE entries have been identified for each of the ana-lyzed institutions. In this respect, PVAT identified a surprisingly high number of CVE entries, since each CPE may point to more than one CVE entry. As illustrated in Fig. 3 and numerically in Table 3, for U1 PVAT identified 272 CVE entries, for U2 it
identified 94 CVE entries, for U3 it identified 60
CVE entries, for U4 it identified 538 CVE entries,
while for U5 it identified 84 CVE entries.
These numbers are surprisingly high and raise serious concerns on the vulnerability of the an-alyzed institutions. As a matter of fact, most of the discovered vulnerabilities included a Common Vulnerability Scoring System (CVSS) value above average (CVSS scores are in the range of 1 - lowest, and 10 - highest). Furthermore, for all institutions
2 4 6 8 10
University 1 University 2 University 3 University 4 University 5
Average CVE score and outliers
Fig. 4. Distribution of CVSS values across the five analyzed institutions.
we have found several cases of CVEs with max-imum CVSS values. These indicate vulnerabilities of maximum severity, where attackers may exploit software vulnerabilities in order to run remotely injected malicious code and to finally take control over underlying machines. For illustration purposes the distribution of CVSS values across the five different analyzed institutions is portrayed in Fig. 4.
4.2. Scenario B: Experiments With PRADS and PVAT
The following experiments are aimed at demon-strating PVAT’s ability to process results derived by different network asset discovery tools. Given the popularity ofp0f and its successor,PRADS, the following experiments are conducted with the help
of PRADS.
In this scenario we configured a simple network topology consisting of a client workstation with Chrome Web browser installed, and with an Apache server station. From the client station we launched Chrome and we connected to the Apache Web server. At the same time, we recorded the network traffic between the client and the server.
Next, we launched PRADS with the default asset signature configurations in the attempt
to identify the network assets. Besides the results concerning possible OS versions, which are out of PVAT’s scope, PRADS
returned the following entry for the client host:
10.0.0.171,0,80,6,CLIENT,[http: Mozilla/5.0 (Windows NT 6.1) AppleWebKit/537.36 (KHTML, like Gecko) Chrome/35.0.1916.153 Safari/537.36],1,1404207543
For this output PVAT applied its CPE and CVE reconstruction algorithms on each pair of keyword and version numbers. As a result, for Mozilla and version number 5.0 it returned more than 100 results, while for Chrome and version num-ber 35.0.1916.153 it identified four vulnerabili-ties. However, this particular output is a result of
PRADS’s signature construction rules, which try to
approximate different software and as a result, they give various options. Nevertheless, for each of these options PVAT applies its reconstruction algorithms and it returns as many results as it can find from NVD. Therefore, a significant conclusion of this experiment is that PVAT is able to operate on the output of different network asset discovery tools, but also, that the accuracy of results is highly dependent on the quality of its input.
4.3. Discussion
The experiments presented in this section are a clear indication that even today, banner-based analysis is not “old fashioned”, and that it remains one of the simplest ways that an attacker may acquire information on services and their possible vulnerabilities. Even more disturbing is the fact that in the vast majority of the analyzed cases system administrators seem to make the same configuration mistakes. That is, services are not sanitized (in terms of the information/configuration exposure),
(possibly) unused ports are not blocked by fire-walls, and configurations of critical devices, e.g., network switches, are easily accessible. To make matters worse, attackers now have powerful third-party tools, e.g., Shodan, which they may use to launch stealthy Internet-scale scans for vulnerable services.
Nevertheless, despite these warnings, we also need to look at the positive side of the develop-ment of tools such as Shodan and PVAT. In fact, the public disclosure on their powerful capabilities has risen the level of awareness and the need to place a larger emphasis on security require-ments and on the implementation of security mea-sures. Furthermore, recently published ICS-CERT reports [17] recommend “the usage of tools, such as SHODAN and Google, and leverage those platforms to enhance awareness of the Internet accessible devices that might exist within your infrastruc-ture”. These reports are a clear illustration of the fact that nowadays it does not suffice to simply place security devices, e.g., firewalls and Intrusion Detection/Prevention Systems, in the “right” net-work places. However, these traditional measures need to be coupled with modern detection tools, which are less disruptive as classic penetration-testing techniques, and may provide the first level of information required to create a map of visible and possibly vulnerable Internet-facing services. Based on these results, security administrators may then take appropriate measures in order to significantly reduce the degree of service exposure.
Briefly, we believe that PVAT brings several major contributions to the field:
1 PVAT builds on the advanced features pro-vided by network asset discovery tools and ex-pands their capabilities vulnerability analysis. 2 Since PVAT falls into the category of passive
direct interaction with the analyzed services. Therefore, PVAT may process various inputs originating not only from Shodan, but from other tools as well such as p0f, and PRADS. 3 Finally, PVAT automatically updates its list of
CPE and CVE names, and it does not require constant development of plug-ins. Obviously, since PVAT depends on the availability of vulnerability descriptions in NVD, its output is also highly dependent on the accuracy and completeness of vulnerability reports, as given in NVD.
5.
Conclusion
This paper argued that it is imperative to sanitize the information exposed by services in the attempt to reduce the degree of service exposure. The methodology that was adopted for demonstrating these arguments embraces the advanced features provided by modern network asset discovery tools such asp0f,PRADSand Shodan, while vulnerability reports are directly downloaded from the National Vulnerability Database (NVD). Experimental results conducted on five different university-type institu-tions revealed the severity of service exposure. The results confirmed that service banner-based analy-sis can provide significant information on service type, vendor, and even version numbers, which may then be used to reconstruct CPEs and to extract known CVEs from NVD. The analysis underlined the necessity to apply typical service sanitizing methodologies in order to reduce service exposure and the number of attacks. As future work we intend to expand the applicability of PVAT to other institutions and to implement time-based analysis of services aiming at disclosing possible critical changes in service configuration over a specific time.
Acknowledgment
The research presented in this paper was sup-ported by the European Social Fund under the responsibility of the Managing Authority for the Sectoral Operational Programme for Human Re-sources Development, as part of the grant POS-DRU/159/1.5/S/133652.
References
[1] Cisco, “The internet of things.” http://share.cisco.com/ internet-of-things.html, 2014. [Online; accessed February 2015].
[2] Z. Durumeric, E. Wustrow, and J. A. Halderman, “Zmap: Fast internet-wide scanning and its security applications,” in Proceedings of the 22Nd USENIX Conference on Security, SEC’13, (Berkeley, CA, USA), pp. 605–620, USENIX Asso-ciation, 2013.
[3] Z. Durumeric, M. Bailey, and J. A. Halderman, “An internet-wide view of internet-internet-wide scanning,” in23rd USENIX Security Symposium (USENIX Security 14), (San Diego, CA), pp. 65–78, USENIX Association, Aug. 2014.
[4] Z. Durumeric, J. Kasten, D. Adrian, J. A. Halderman, M. Bailey, F. Li, N. Weaver, J. Amann, J. Beekman, M. Payer, and V. Paxson, “The matter of heartbleed,” in Proceedings of the 2014 Conference on Internet Measurement Conference, IMC ’14, (New York, NY, USA), pp. 475–488, ACM, 2014. [5] J. Matterly, “Shodan.” http://www.shodanhq.com, 2014.
[On-line; accessed December 2014].
[6] H. Ghani, A. Khelil, N. Suri, G. Csertan, L. Gonczy, G. Urban-ics, and J. Clarke, “Assessing the security of internet-connected critical infrastructures,”Security and Communication Networks, vol. 7, no. 12, pp. 2713–2725, 2014.
[7] R. Bodenheim, J. Butts, S. Dunlap, and B. Mullins, “Evaluation of the ability of the shodan search engine to identify internet-facing industrial control devices,”International Journal of Crit-ical Infrastructure Protection, vol. 7, no. 2, pp. 114 – 123, 2014. [8] D. Kedmey, “See every single device connected to the internet.” http://time.com/3221958/internet-map/, 2014. [Online; accessed February 2015].
[9] A. Grau, “Shutting the door on shodan.” http://www.manufacturing.net/articles/2013/12/
shutting-the-door-on-shodan, 2013. [Online; accessed February 2015].
[10] M. Zalewski, “p0f v3: Passive fingerprinter.” http://lcamtuf. coredump.cx/p0f3/, 2012. [Online; accessed December 2014]. [11] E. Fjellskal, “Passive real-time asset detection system.” http:
//gamelinux.github.io/prads/, 2009. [Online; accessed December 2014].
[12] R. Rogers, Nessus Network Auditing. Syngress publishing, 2008.
[13] G. Manes, D. Schulte, S. Guenther, and S. Shenoi, “Netglean: A methodology for distributed network security scanning,” Journal of Network and Systems Management, vol. 13, no. 3, pp. 329–344, 2005.
[14] J. Matterly, “Shodan rest api documentation.” https://developer. shodan.io/api, 2015. [Online; accessed February 2015]. [15] V. Nannen, “The Edit History of the National Vulnerability
Database,” Master’s thesis, ETH Zurich, Switzerland, 2012. [16] B. Cheikes, D. Waltermire, and K. Scarfone, “Common platform
enumeration: Naming specification version 2.3,” Tech. Rep. NIST Inter-agency Report 7695, NIST, August 2011.
[17] National Cybersecurity and Communications Integration Cen-ter, “ICS-Cert Monitor. Internet Accessible Control Systems at Risk.” https://ics-cert.us-cert.gov/sites/default/files/Monitors/ ICS-CERT Monitor %20Jan-April2014.pdf, 2014. [Online; accessed February 2015].