META-ANALYTIC APPROACHES FOR SUMMARISING AND
COMPARING THE ACCURACY OF MEDICAL TESTS
by
YEMISI TAKWOINGI
A thesis submitted to the University of Birmingham for the degree of DOCTOR OF PHILOSOPHY
Public Health, Epidemiology and Biostatistics Institute of Applied Health Research College of Medicine and Dental Sciences University of Birmingham March 2016
University of Birmingham Research Archive
e-theses repository
This unpublished thesis/dissertation is copyright of the author and/or third parties. The intellectual property rights of the author or third parties in respect of this work are as defined by The Copyright Designs and Patents Act 1988 or as modified by any successor legislation.
Any use made of information contained in this thesis/dissertation must be in accordance with that legislation and must be properly acknowledged. Further distribution or reproduction in any format is prohibited without the permission of the copyright holder.
accuracy of competing diagnostic tests informs clinical and policy decision making. This thesis addresses questions centred on assessing the reliability and transparency of evidence from systematic reviews and meta-analyses of comparative test accuracy, including validity of meta-analytic methods.
Case studies were used to highlight key methodological issues, and provided rationale and context for the thesis. Published systematic reviews of multiple tests were identified and used to provide a descriptive survey of recent practice. Availability of comparative accuracy studies and differences between meta-analyses of direct (head-to-head) and indirect (between-study) comparisons were assessed. Comparative meta-analysis methods were reviewed and those deemed statistically robust were empirically evaluated. Using simulation, performance of hierarchical methods for meta-analysis of a single test was investigated in challenging scenarios (e.g. few studies or sparse data) and implications for test comparisons were considered.
Poor statistical methods and incomplete reporting threatens the reliability of comparative reviews. Differences exist between direct and indirect comparisons but direct comparisons were seldom feasible because comparative studies were unavailable. Furthermore,
inappropriate use of meta-analytic methods generated misleading results and conclusions. Therefore, recommendations for use of valid methods and a reporting checklist were developed.
I am extremely grateful to my supervisors Professor Jon Deeks and Professor Richard Riley for their guidance and support. Without Jon’s confidence in me and his encouragement, I would not have applied for the Fellowship that provided a fantastic opportunity to pursue my research and to develop professionally. Richard’s advice both as a supervisor and a colleague have been invaluable. Thank you both very much.
I am indebted to Professor Richard Gray and Mark Nixon who gave me my first job in
applied health research and supported my decision to develop a career in medical statistics. To Professor Alex Sutton whose passion for meta-analysis fuelled my interest in the subject, I owe thanks for helpful advice over the years, especially when I was unsure about starting a career in test evaluation.
My PhD has been quite a journey, along which I have been privileged to make many new friends. Special thanks to the colleagues that I have had the privilege of working with on the examples used as case studies in this thesis, and Boliang Guo and Mariska Leeflang for their contributions. I appreciate everyone who showed interest in my PhD and wellbeing,
especially Professor Petra Macaskill, Karla Soares-Weiser and Alice Sitch.
I could not have maintained my sanity (still questionable) without the love and support of Moti and Mary, my daughters, and Yohanna my dear husband. You have been amazing! Last and most importantly, to my heavenly father in whom I find hope and joy, courage to face challenges and the determination to strive to give the best I can. To God be the glory.
Contents
RESEARCH DISSEMINATION ... i
List of publications ... ii
Original manuscripts (direct output) ... ii
Related manuscripts (case studies) ... ii
Oral presentations ... iv
Poster presentations ... v
Online publications ... vi
1 INTRODUCTION ... 1
1.1 Test evaluation and thesis overview ... 1
1.1.1 Types of medical tests ... 3
1.1.2 Phases of test evaluation... 3
1.2 Role of test accuracy ... 7
1.3 Analysis of primary studies of a single test ... 9
1.3.1 Types of data ... 9
1.3.2 Types of measures ... 10
1.4 Research synthesis and methods for meta-analysis of a single test ... 15
1.4.1 Heterogeneity ... 16
1.4.2 Univariate pooling methods ... 17
1.4.3 Summary receiver operating characteristic regression ... 18
1.5 Comparisons of two or more tests ... 27
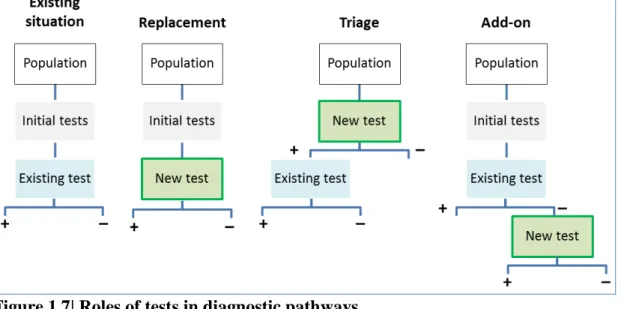
1.5.1 Diagnostic pathways... 29
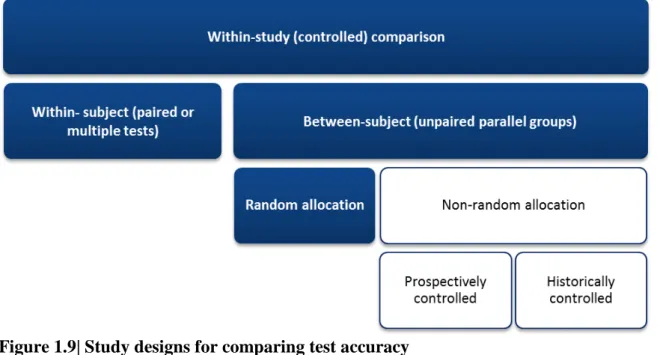
1.5.2 Study designs for test comparisons ... 31
1.5.3 Analysis of test comparisons in primary studies ... 37
1.5.4 Meta-analysis of test comparisons ... 38
1.6 Challenges in assessing comparative accuracy in systematic reviews... 44
1.7 Research questions and thesis outline ... 48
1.7.1 Research questions ... 48
1.7.2 Thesis outline ... 49
2 METHODOLOGICAL CHALLENGES IN META-ANALYSES OF TEST COMPARISONS ... 53
2.1 Introduction ... 53
2.2 Synopsis of case studies ... 54
2.2.1 Rapid diagnostic tests for uncomplicated malaria in endemic countries ... 56
2.2.2 Screening tests for bipolar spectrum disorders... 58
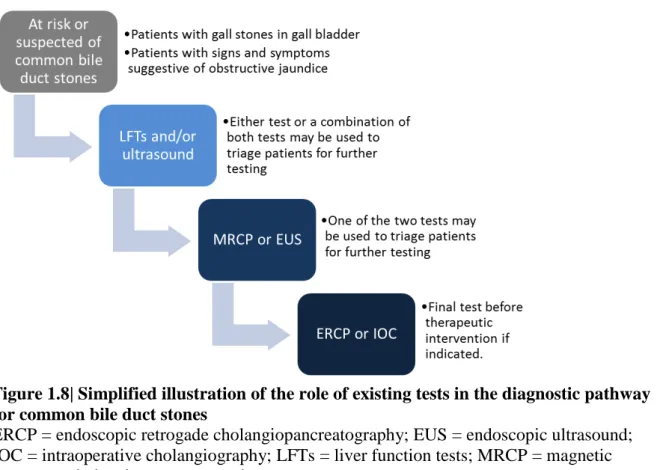
2.2.3 Diagnostic tests for common bile duct stones ... 58
2.2.4 Antenatal screening for Down’s syndrome ... 59
2.2.5 Overview of analysis methods ... 61
2.3 Methodological issues ... 62
2.3.1 What test comparisons should be performed? ... 63
2.3.2 Are meta-analytic methods that compare both SROC curves and points needed? .... 73
2.3.4 Is the assumption of equal variances across tests appropriate? ... 87
2.3.5 Is comparative meta-analysis feasible with few studies or sparse data? ... 93
2.4 Summary…. ... 97
3 IDENTIFYING SYSTEMATIC REVIEWS AND META-ANALYTIC METHODS FOR TEST COMPARISONS ... 100
3.1 Introduction ... 100
3.2 Identification of systematic reviews... 100
3.2.1 Terminology ... 101
3.2.2 Data sources and searches ... 102
3.2.3 Selection of reviews ... 103
3.3 Identification of methods for meta-analysis of comparative accuracy ... 105
3.3.1 Data sources and searches ... 105
3.3.2 Selection of methodology studies... 107
3.4 Search results for systematic reviews ... 107
3.5 Search results for meta-analytic methods ... 109
3.6 Discussion………..111
3.6.1 Summary of findings ... 111
3.6.2 Strengths and limitations ... 111
3.6.3 Conclusions ... 112
4 REVIEW OF PUBLISHED SYSTEMATIC REVIEWS OF COMPARATIVE TEST ACCURACY ... 113
4.2 Methods ... .... ... 115
4.2.1 Review selection and data extraction ... 115
4.2.2 Data analysis... 116
4.3 Results ….. ... 117
4.3.1 General characteristics ... 118
4.3.2 Statistical characteristics ... 120
4.3.3 Presentation and reporting ... 127
4.4 Discussion.……….132
4.4.1 Principal findings ... 132
4.4.2 Comparison with other studies ... 136
4.4.3 Implications for research and practice... 137
4.4.4 Strengths and limitations ... 141
4.4.5 Conclusions ... 143
5 EMPIRICAL EVIDENCE OF THE IMPORTANCE OF COMPARATIVE STUDIES OF DIAGNOSTIC TEST ACCURACY ... 145
5.1 Introduction ... 145
5.2 Methods……….147
5.2.1 Review selection and data extraction ... 147
5.2.2 Data synthesis and analysis ... 149
5.3 Results ….. ... 154
5.3.1 Availability of studies with comparative designs... 154
5.3.3 Evidence of difference in meta-analyses of comparative and non-comparative studies
………...164
5.4 Discussion ... 170
5.4.1 Possible explanations ... 170
5.4.2 Comparison with existing evidence ... 172
5.4.3 Implications for research and practice... 173
5.4.4 Strengths and limitations ... 174
5.4.5 Conclusions ... 176
6 METHODOLOGICAL REVIEW OF STATISTICAL METHODS FOR COMPARATIVE META-ANALYSIS ... 177
6.1 Introduction ... 177
6.2 Identification of comparative meta-analysis methods... 178
6.3 Statistical methods for comparative meta-analysis of test accuracy ... 179
6.3.1 Methods for comparing summary points... 182
6.3.2 Methods for comparing SROC curves ... 189
6.3.3 Methods comparing pooled estimates between meta-analyses ... 201
6.3.4 Methods for comparative meta-analysis of correlated (paired) data ... 203
6.4 Summary of comparative meta-analysis methods... 213
6.5 Conclusions ... 216
7 EMPIRICAL ASSESSMENT OF COMPARATIVE META-ANALYSIS METHODS ... ………..217
PART I: METHODS AND DESCRIPTION OF EMPIRICAL DATA ... 219
7.2 Methods ... . ... 219
7.2.1 Selection of systematic reviews and data extraction ... 219
7.2.2 Selection of comparative meta-analysis models ... 220
7.2.3 Data analysis... 221
7.3 Description of cohort of systematic reviews ... 229
7.3.1 Types of test comparisons ... 235
7.3.2 Frequency of zero cells... 235
PART II: ASSESSMENT OF MODELLING ASSUMPTIONS IN HIERARCHICAL MODELS …… ... ... 237
7.4 Assessment of modelling assumptions based on separate meta-analyses of tests in test comparisons ... 237
7.4.1 Are hierarchical models stable in meta-analyses of individual tests? ... 238
7.4.2 Is heterogeneity in test performance similar between tests in test comparisons? .... 248
7.4.3 Is the shape of SROC curves similar between tests in test comparisons? ... 250
7.5 Summary of assessment of modelling assumptions in hierarchical models ... 251
PART III: IMPACT OF DIFFERENT MODELS ON FINDINGS ... 254
7.6 Impact of different modelling complexity on findings ... 255
7.6.1 Do test results need to be clustered within comparative studies in bivariate meta-regression models? ... 255
7.6.2 Is it important to allow variances to differ by test in bivariate meta-regression models? ... 258
7.6.3 Is it important to allow shape of SROC curves to differ between tests in HSROC
meta-regression models? ... 263
7.7 Performance of different comparative meta-analysis methods ... 266
7.7.1 Comparison of bivariate and univariate meta-regression ... 266
7.7.2 Comparison of unweighted and weighted Moses SROC meta-regression ... 270
7.7.3 Comparison of HSROC and unweighted Moses SROC meta-regression ... 275
7.7.4 Comparison of HSROC and weighted Moses SROC meta-regression ... 280
7.8 Discussion ... 282
7.8.1 Summary of findings ... 282
7.8.2 Implications for research and practice... 286
7.8.3 Strengths and limitations ... 288
7.8.4 Conclusions ... 289
8 PERFORMANCE OF METHODS FOR META-ANALYSIS WITH FEW STUDIES OR SPARSE DATA ... 291
8.1 Introduction ... 291
8.2 Model parsimony ... 293
8.3 Motivating examples of meta-analyses of a single test ... 296
8.3.1 Non-contrast computed tomography for diagnosing appendicitis ... 296
8.3.2 Computed tomography for diagnosing scaphoid fractures ... 296
8.3.3 Results from reanalysis of the two example datasets ... 297
8.4 Simulation study methods ... 301
8.4.2 Meta-analytic models fitted to each dataset ... 306
8.4.3 Facilitating convergence of hierarchical models ... 307
8.4.4 Assessment of model convergence and stability ... 308
8.4.5 Assessment of performance of meta-analytic models ... 308
8.5 Simulation results ... 309
8.5.1 Estimability ... 309
8.5.2 Bias ... 314
8.5.3 Model accuracy ... 315
8.5.4 Coverage ... 317
8.5.5 Summary of simulation results and application to motivating examples ... 318
8.6 Application to test comparisons ... 320
8.7 Discussion ... 321
8.7.1 Principal findings and recommendations ... 321
8.7.2 Comparison with previous research ... 324
8.7.3 Strengths and limitations ... 325
8.7.4 Conclusions ... 326
9 THESIS DISCUSSION AND CONCLUSIONS ... 328
9.1 Overview of thesis... 329
9.1.1 Are methods and reporting of comparative reviews adequate? ... 330
9.1.2 Are comparative accuracy studies essential for test comparisons? ... 331
9.1.4 Do comparative meta-analysis methods give the same results?... 332
9.1.5 How should meta-analyses be undertaken with few studies or sparse data? ... 333
9.2 Validity of test comparisons ... 333
9.3 Strengths and limitations ... 336
9.4 Implications of thesis findings for scientific research and practice ... 337
9.5 Future research ... 340
9.5.1 Sources of bias and variation in comparative studies ... 340
9.5.2 Heterogeneity in relative test performance ... 341
9.5.3 Performance of comparative meta-analysis methods with few studies or sparse data ………...341
9.5.4 Comparing test accuracy across multiple thresholds per study ... 342
9.5.5 Evaluation of Bayesian comparative meta-analysis methods ... 343
9.6 Conclusions ... 343
APPENDICES ... 345
Appendix A: Software programs ... 347
A.1| SAS program for fitting HSROC model with common or separate variance parameters across tests for Type 1 and Type 4 RDTs ... 347
A.2| Stata program for fitting the bivariate model with different covariance structures to ERCP versus IOC data ... 350
Appendix B: Forms, statistical methods and examples for Chapter 4 ... 355
B.1| Screening form for reviews ... 355
B.3| Statistical methods used for test comparisons ... 359 B.4| Summary of methodological and reporting characteristics of five exemplar
comparative reviews ... 364 Appendix C: Sensitivity analysis for one-sided contour-enhanced funnel plot of the ratio of relative diagnostic odds ratio ... 365 Appendix D: Datasets and additional figures for Chapter 7 ... 366 D.1| Characteristics of meta-analyses for empirical evaluation of methods ... 366 D.2| Datasets with convergence and estimation issues in HSROC models applied to
individual tests ... 371 D.3| Estimates from bivariate models with and without assumption of equal variances across tests ... 373 D.4| Comparison of bivariate models with different covariance structures fitted to direct test comparisons ... 378 D.5| Estimates of relative sensitivity from HSROC models with common and different shape between tests for SROC curves ... 379 D.6| Comparison of relative sensitivity and relative specificity from bivariate and
univariate models with equal variances ... 381 D.7| Estimates of relative accuracy from bivariate and univariate models with unequal variances ... 382 D.8| Estimates of variance and correlation parameters from bivariate and univariate models with unequal variances ... 384 D.9 | Estimates from unweighted and weighted Moses SROC meta-regression models .. 386
D.10| Estimates from unweighted Moses SROC and HSROC meta-regression models ... 388 Appendix E: Additional simulation results ... 390 E.1| Performance of all meta-analytic models in estimating sensitivity for scenarios with a DOR of 231 ... 390 E.2| Performance of all meta-analytic models in estimating specificity for scenarios with a DOR of 231 ... 392 REFERENCES ... 394
List of Tables
Table 1.1| Phases of test evaluation ... 5
Table 1.2| Cross classification of index test and reference standard results ... 8
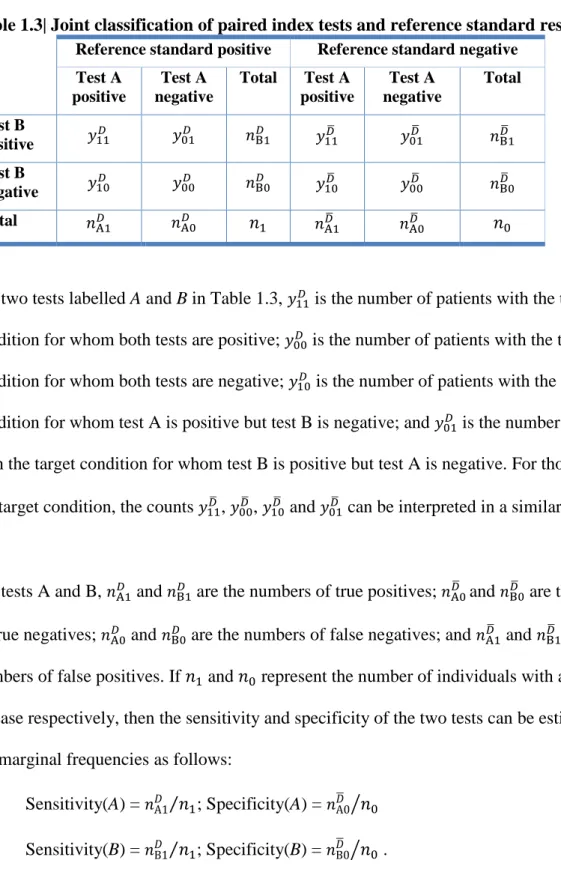
Table 1.3| Joint classification of paired index tests and reference standard results ... 34
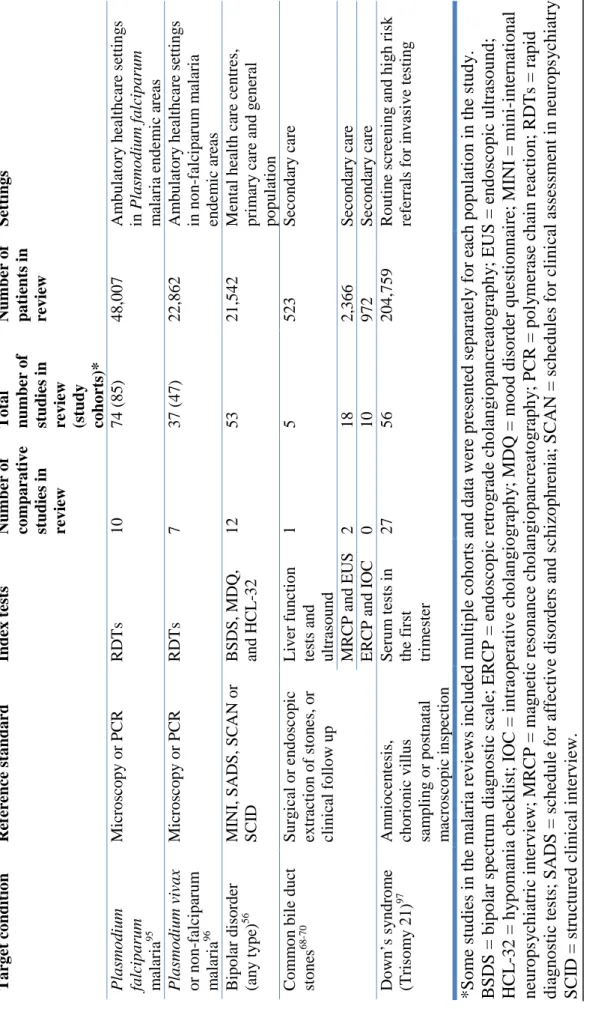
Table 2.1| Evidence profile of seven published reviews ... 55
Table 2.2| Types of rapid diagnostic tests for detecting malaria ... 57
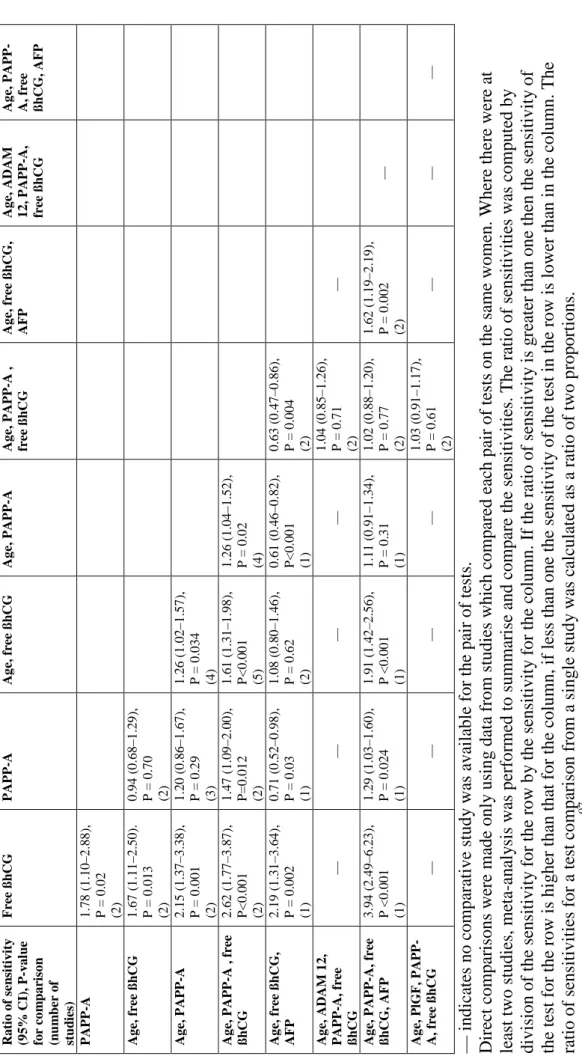
Table 2.3| Direct comparisons of sensitivity of nine first trimester serum test strategies at the 5% false positive rate ... 69
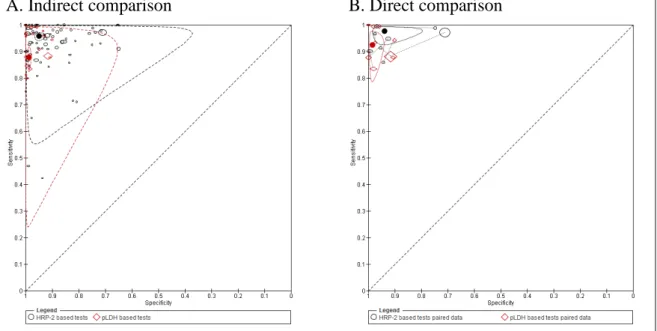
Table 2.4| Summary estimates from direct and indirect comparisons of HRP-2 based RDTs versus pLDH based RDTs for P falciparum malaria ... 71
Table 2.5| Accuracy of the BSDS, HCL-32 and MDQ for detection of any type of bipolar disorder in mental health centre settings ... 79
Table 2.6| Comparison of the accuracy of BSDS, HCL-32 and MDQ for detection of any type of bipolar disorder in mental health centre settings ... 82
Table 2.7| Parameter estimates for asymmetric and symmetric HSROC models for the BSDS with and without an outlier ... 83
Table 2.8| Parameter estimates for asymmetric and symmetric HSROC models for the HCL-32 with and without an outlier ... 84
Table 2.9| Comparison of estimates from models based on different comparative approaches and assumptions ... 91
Table 2.10| Parameter and summary estimates for ERCP and IOC from models with different variance-covariance structure ... 96
Table 4.2| Descriptive characteristics of 127 reviews of comparative accuracy and multiple
tests ... 119
Table 4.3| Outcome measures and test comparison strategy in the reviews ... 121
Table 4.4| Meta-analysis methods used in the reviews ... 123
Table 4.5| Test comparison strategy and comparative meta-analysis methods ... 125
Table 4.6| Investigations of heterogeneity in the reviews ... 126
Table 4.7| Reporting and presentation characteristics of the reviews ... 130
Table 5.1| Characteristics of reviews included in the assessment of availability of comparative studies ... 156
Table 5.2| Characteristics of included reviews and test comparisons in each meta-analysis . 159 Table 6.1| Meta-analytic methods for comparing test accuracy ... 180
Table 6.2| Parameter and summary estimates from bivariate models with increasing complexity of the variance-covariance structure ... 188
Table 6.3| Comparison of unweighted and weighted Moses SROC meta-regression models ... ……….196
Table 6.4| Parameter and summary estimates from HSROC models with increasing complexity of the variance-covariance structure ... 200
Table 6.5| Discordant test results in the diseased and non-diseased groups for study i ... 203
Table 6.6| Probability of each combination of test results for two tests in study i ... 208
Table 6.7| Observed counts of test results cross-classified for two tests in study i ... 209
Table 6.8| Summary estimates and 95% credible intervals from alternative meta-analysis models for comparing accuracy of short femur and short humerus for Down syndrome screening ... 212
Table 7.1| Characteristics of empirical dataset ... 230 Table 7.2| Parameter estimates from unstable HSROC models ... 239 Table 7.3| Bivariate and univariate (unequal variance) models with statistically significant differences in model fit ... 269 Table 7.4| Qualitative differences between unweighted and weighted Moses SROC meta-regression models (shape allowed to differ by test) ... 275 Table 7.5| Qualitative differences between HSROC and unweighted Moses SROC meta-regression models (shape allowed to differ by test) ... 280 Table 8.1| Summary accuracy measures obtained from different meta-analytic models applied to the two motivating examples ... 298 Table 8.2| Scenarios evaluated in the simulation ... 306 Table 8.3| Convergence and estimability of the complete HSROC model applied to 10 000 datasets in 36 different scenarios ... 311 Table 8.4| Performance of all meta-analytic models in estimating the log DOR for scenarios with a DOR of 231 ... 312
List of Figures
Figure 1.1| Framework for the evaluation of in vitro medical tests... 6
Figure 1.2| Relationship between sensitivity, specificity and test positivity threshold ... 11
Figure 1.3| Relationship between diagnostic odds ratios and symmetric ROC curves ... 14
Figure 1.4| Relationship between diagnostic odds ratios and asymmetric ROC curves ... 14
Figure 1.5| SROC plot of the MDQ at a common threshold of 7 for detection of bipolar disorder in mental health centre settings ... 24
Figure 1.6| SROC plot of the MDQ at different thresholds for detection of bipolar disorder in mental health centre settings... 27
Figure 1.7| Roles of tests in diagnostic pathways ... 29
Figure 1.8| Simplified illustration of the role of existing tests in the diagnostic pathway for common bile duct stones ... 31
Figure 1.9| Study designs for comparing test accuracy ... 32
Figure 1.10| Robust study designs for comparing test accuracy ... 33
Figure 1.11| Approaches for comparing test accuracy ... 45
Figure 1.12| Types of test comparisons in a comparative accuracy meta-analysis ... 47
Figure 2.1| Hierarchy of rapid diagnostic tests evaluated against microscopy ... 65
Figure 2.2| Comparison of the nine selected first trimester serum test strategies ... 68
Figure 2.3| Comparison of summary points on SROC plots ... 70
Figure 2.4| Comparison of summary curves on SROC plots ... 72
Figure 2.5| SROC plot of rapid diagnostic tests for non-falciparum malaria ... 74
Figure 2.6| Sensitivity (detection rate) at a 5% false positive rate for the 9 selected test strategies ... 76
Figure 2.7| Forest plot of screening tests for detection of any type of bipolar disorder (BD type
I, BD type II or BD NOS) in mental health centre settings ... 78
Figure 2.8| Scatterplot of D (log odds ratio) against S (implicit threshold) for the BSDS, HCL-32 and MDQ ... 81
Figure 2.9| Forest plot of BSDS, HCL-32 and MDQ for detection of bipolar disorder type II in mental health centre settings... 85
Figure 2.10| Summary ROC plot of the BSDS, HCL-32 and MDQ for detection of bipolar disorder type II in mental health centre settings ... 86
Figure 2.11| Comparison of heterogeneity in test performance for Type 1 and Type 4 rapid diagnostic tests ... 88
Figure 2.12| Forest plot of endoscopic retrograde cholangiopancreatography (ERCP) and intraoperative cholangiography (IOC) for diagnosis of common bile duct stones... 94
Figure 3.1| Flowchart of selection of systematic reviews ... 108
Figure 3.2| Flowchart of selection of reports of meta-analytic methods ... 110
Figure 4.1| Cohort of reviews included in the review of reviews ... 118
Figure 4.2| Reporting characteristics of 127 reviews ... 128
Figure 5.1| Flowchart of review and meta-analysis selection... 158
Figure 5.2| Ratio of relative diagnostic odds ratios (with 95% confidence intervals) ... 165
Figure 5.3| One-sided contour-enhanced funnel plot of the ratio of relative diagnostic odds ratio ... 167
Figure 5.4| Absolute differences in sensitivity and specificity between tests (with 95% confidence intervals)... 169
Figure 6.1| Number of citations per year for original publications of the Moses model, bivariate model and HSROC model for test accuracy meta-analysis ... 181
Figure 6.2| SROC plot of dermoscopy and unaided eye for diagnosis of melanoma ... 187 Figure 6.3| Forest plot of RIA and ELISA for diagnosis of congestive heart failure ... 192 Figure 6.4| Comparison of summary curves from Moses SROC meta-regression models .... 194 Figure 7.1| SROC plots of meta-analytic datasets with mixed thresholds ... 232 Figure 7.2| SROC plots of meta-analytic datasets with common thresholds (1) ... 233 Figure 7.3| SROC plots of meta-analytic datasets with common thresholds (2) ... 234 Figure 7.4| Distribution of number of primary studies for the index and comparator tests in the test comparisons ... 235 Figure 7.5| Number of studies with zero cells in each test comparison ... 236 Figure 7.6| Distribution of number of studies in each meta-analysis of a single test ... 238 Figure 7.7| Estimates of the correlation parameter from meta-analyses of individual tests in 57 test comparisons ... 241 Figure 7.8| Comparison of estimates of variances from bivariate and univariate meta-analyses ... 242 Figure 7.9| Forest plot of sensitivity and specificity for the dataset with the largest difference between univariate and bivariate meta-analyses ... 243 Figure 7.10| Comparison of estimates of standard errors of mean logit sensitivities and mean logit specificities from univariate and bivariate meta-analyses... 244 Figure 7.11| Comparison of estimates of beta from HSROC models with estimates derived from bivariate models ... 245 Figure 7.12| Estimates of beta and its standard error against number of studies in each meta-analysis ... 246 Figure 7.13| Estimates of beta and their 95% confidence intervals from HSROC models .... 247
Figure 7.14| SROC plots of three meta-analyses with 12 included studies and substantial uncertainty in estimation of beta ... 248 Figure 7.15| Variance estimates for random effects for logit sensitivity and logit specificity from meta-analysis of each test in the test comparisons ... 249 Figure 7.16| Variance estimates for random effects for accuracy and threshold from meta-analysis of each test in the test comparisons ... 250 Figure 7.17| Estimates of beta (shape parameter) from separate meta-analyses of pairs of tests in 52 test comparisons ... 251 Figure 7.18| Differences in estimates from bivariate meta-regression models with and without clustering of test results in comparative studies ... 256 Figure 7.19| Comparison of relative sensitivity and relative specificity from bivariate meta-regression models with and without clustering of test results in comparative studies ... 257 Figure 7.20| Differences in estimates from bivariate meta-regression models with equal and unequal variances ... 259 Figure 7.21| Comparison of relative sensitivity and relative specificity from bivariate meta-regression models with equal and unequal variances ... 260 Figure 7.22| Comparison of bivariate meta-regression models with different covariance structures fitted to direct test comparisons ... 262 Figure 7.23| Differences in estimates from HSROC meta-regression models with common and different shape for SROC curves ... 264 Figure 7.24| Comparison of relative sensitivity from HSROC meta-regression models with common and different shape between tests for SROC curves ... 265 Figure 7.25| Differences in estimates from bivariate and univariate meta-regression models with unequal variances ... 267
Figure 7.26| Comparison of relative sensitivity and relative specificity from bivariate and univariate models with unequal variances ... 268 Figure 7.27| Differences in estimates from unweighted and weighted Moses SROC meta-regression (same shape) models ... 270 Figure 7.28| Comparison of unweighted and weighted Moses SROC meta-regression (same shape) models ... 271 Figure 7.29| Differences in estimates from unweighted and weighted Moses SROC (different shape) meta-regression models ... 273 Figure 7.30| Comparison of unweighted and weighted Moses SROC meta-regression
(different shape) models ... 274 Figure 7.31| Differences in estimates from HSROC and unweighted Moses SROC meta-regression (same shape) models ... 276 Figure 7.32| Comparison of unweighted Moses SROC and HSROC meta-regression (same shape) models ... 277 Figure 7.33| Differences in estimates from HSROC and unweighted Moses SROC (different shape) meta-regression models ... 278 Figure 7.34| Comparison of unweighted Moses SROC and HSROC meta-regression models ... 279 Figure 7.35| Differences in estimates from HSROC and weighted Moses SROC
meta-regression (same shape) models ... 281 Figure 7.36| Differences in estimates from HSROC and weighted Moses SROC
meta-regression (different shape) models ... 282 Figure 8.1| Forest plot of sensitivity and specificity estimates from studies included in the two motivating examples ... 297
Figure 8.2| Profile log-likelihood function of the covariance parameter in the bivariate model applied to the appendicitis example ... 300 Figure 8.3| Underlying bilogistic distribution of diseased and non-diseased used in the
simulation ... 303 Figure 8.4| Proportion of meta-analyses that successfully converged for the complete HSROC model in 36 different scenarios with heterogeneity in accuracy and threshold... 310 Figure 8.5| Bias in the estimated diagnostic odds ratio for 36 scenarios with heterogeneity in accuracy and threshold ... 315 Figure 8.6| Mean square error for the estimated log diagnostic odds ratio for nine different scenarios with heterogeneity in accuracy and threshold and diagnostic odds ratio of 231 .... 316 Figure 8.7| Coverage of 95% confidence intervals for the log diagnostic odds ratio for nine different scenarios with heterogeneity in accuracy and threshold and a diagnostic odds ratio of 231 ... 318
List of Boxes
Box 2.1| SAS Proc NLMIXED code for each model....………89 Box 4.1| Criteria for reporting test comparisons in systematic reviews of test accuracy...…139 Box 8.1| Recommendations for selecting alternative models when bivariate or HSROC
i
RESEARCH DISSEMINATION
Findings from the thesis have been published as research articles in peer reviewed journals and presented at local and international meetings as oral or poster presentations. Although supervisors and external collaborators have contributed by helping to refine some of the research ideas, revise and critique the manuscripts, the author is the primary contributor of direct outputs of the thesis and the conference contributions listed below. Other publications related to the thesis, such as the systematic reviews used as case studies in Chapter 2, were undertaken in collaboration with clinical colleagues and other methodologists. The author planned and conducted the statistical analyses in the reviews, and contributed substantially to drafting and revising the manuscripts.
Chapters 5 and 8 have been published as peer reviewed papers. The introductory sections of these papers have contributed material to the introductory Chapter of the thesis. Sections of Chapter 1 on types of data, types of measures and meta-analysis (using the bipolar disorder review presented in Chapter 2 as a working example) have also been published as a peer reviewed paper. Data sources and searches reported in the papers based on Chapters 5 and 8 have contributed to Chapter 3. Manuscripts are being prepared for the content of Chapters 4, 6 and 7.
Preliminary findings from Chapters, 4, 5 and 8 were presented as oral presentations at
Cochrane Colloquia. One of the case studies in Chapter 2 (section 2.3.4.1) was also presented as a poster. The presentation based on Chapter 5 was awarded the Thomas Chalmers Prize at the 19th Cochrane Colloquium. Full results from Chapter 5 were presented as an oral
ii also been involved in developing online distance learning modules and given workshops on topics related to the content of this thesis. Details of all publications are given below grouped according to publication type.
List of publications
Original manuscripts (direct output)
1. Takwoingi Y, Guo B, Riley R, Deeks J. Performance of methods for meta-analysis of diagnostic test accuracy with few studies or sparse data. Stat Methods Med Res. Epub ahead of print June 26 2015.
2. Takwoingi Y, Riley R, Deeks J. Meta-analyses of diagnostic accuracy studies in mental health. Evid Based Ment Health 2015; 18:103-109.
3. Takwoingi Y, Leeflang MM, Deeks JJ. Empirical evidence of the importance of comparative studies of diagnostic test accuracy. Ann Intern Med 2013;158(7):544-54.
Related manuscripts (case studies)
1. Takwoingi Y, Abba K, Garner P. Rapid diagnostic testing for Plasmodium vivax and non-falciparum malaria in endemic areas. JAMA 2015;314(10):1065–66.
2. Alldred SK, Takwoingi Y, Deeks JJ, Guo B, Pennant M, Alfirevic Z, Neilson JP. First trimester serum tests for Down's syndrome screening. Cochrane Database Syst Rev 2015;11:CD011975.
iii 3. Gurusamy KS, Giljaca V, Takwoingi Y, Higgie D, Poropat G, Štimac D, Davidson
BR. Endoscopic retrograde cholangiopancreatography versus intraoperative
cholangiography for diagnosis of common bile duct stones. Cochrane Database Syst Rev 2015;2:CD010339.
4. Giljaca V, Gurusamy KS, Takwoingi Y, Higgie D, Poropat G, Štimac D, Davidson BR. Endoscopic ultrasound versus magnetic resonance cholangiopancreatography for common bile duct stones. Cochrane Database Syst Rev 2015;2:CD011549.
5. Gurusamy KS, Giljaca V, Takwoingi Y, Higgie D, Poropat G, Štimac D, Davidson BR. Ultrasound versus liver function tests for diagnosis of common bile duct stones. Cochrane Database Syst Rev 2015;2:CD011548.
6. Carvalho AF, Takwoingi Y, Sales PMG, Soczynska JK, Köhler CA, Freitas TH, Quevedo J, Hyphantis TN, Roger S. McIntyre RS, Vieta E. Screening for bipolar spectrum disorders: a comprehensive meta-analysis of accuracy studies. J Affect Disord 2014;172C:337-346.
7. Abba K, Kirkham AJ, Olliaro PL, Deeks JJ, Donegan S, Garner P, Takwoingi Y. Rapid diagnostic tests for diagnosing uncomplicated non-falciparum or Plasmodium vivax malaria in endemic countries. Cochrane Database Syst Rev 2014;12:CD011431.
iv 8. Abba K, Deeks JJ, Olliaro PL, Naing CM, Jackson SM, Takwoingi Y, Donegan S,
Garner P. Rapid diagnostic tests can extend access of diagnostic services for
uncomplicated Plasmodium falciparum malaria. Int J Epidemiol 2012;41(3):607-608.
9. Abba K, Deeks JJ, Olliaro P, Naing CM, Jackson SM, Takwoingi Y, Donegan S, Garner P. Rapid diagnostic tests for diagnosing uncomplicated P. falciparum malaria in endemic countries. Cochrane Database Syst Rev 2011;7:CD008122.
Oral presentations
1. Reporting and methods in systematic reviews of comparative accuracy. 21st Cochrane Colloquium, Quebec, Canada. September 2013.
2. Empirical assessment of the validity of uncontrolled comparisons of the accuracy of diagnostic tests. Royal Statistical Society's International Conference, Telford. September 2013.
3. Reporting and methods in systematic reviews of comparative accuracy. 3rd
International Symposium on Methodology for Evaluating Medical Tests. University of Birmingham. July 2013.
4. An empirical assessment of the validity of uncontrolled comparisons of the accuracy of diagnostic tests. 2nd International Symposium on Methodology for Evaluating Medical Tests. University of Birmingham. July 2010.
v 5. An empirical assessment of the validity of uncontrolled comparisons of the accuracy
of diagnostic tests. 17th Cochrane Colloquium, Singapore. October 2009 (Awarded the Thomas C Chalmers Prize).
6. Performance of methods for meta-analysis of diagnostic test accuracy studies when few studies are available. 17th Cochrane Colloquium, Singapore. October 2009.
Poster presentations
1. Empirical evidence of the importance of comparative studies of diagnostic test accuracy. Health and Population Sciences Poster day. University of Birmingham. October 2012.
2. Discrepancy in relative test performance due to modelling strategy in comparative diagnostic meta-analysis: a case study. Health and Population Sciences Poster day. University of Birmingham. October 2012.
3. Performance of methods for meta-analysis of diagnostic tests. Health and Population Sciences Poster day. University of Birmingham. October 2012.
4. Discrepancy in relative test performance due to modelling strategy in comparative diagnostic meta-analysis: a case study. 19th Cochrane Colloquium, Madrid, Spain. October 2011.
vi 5. Performance of methods for meta-analysis of diagnostic test accuracy studies when
few studies are available. 2nd International Symposium on Methodology for Evaluating Medical Tests. University of Birmingham. July 2010.
Online publications
1. Takwoingi Y, Leeflang MM, Davenport CF, Deeks JJ. Analysis with RevMan for Cochrane DTA reviews. Lesson 7.2: Cochrane Collaboration DTA Online Learning Materials. The Cochrane Collaboration, September 2014. Videocast (49 slides, 16 min, sound, colour). Available at
http://training.cochrane.org/authors/dta-reviews/distance-learning.
2. Takwoingi Y. Meta-analysis of test accuracy studies in Stata: a bivariate model approach. Version 1.0. November 2013. Available from: http://dta.cochrane.org/.
1
1
INTRODUCTION
A paper based partly on the content of this chapter has been published.
Citation: Takwoingi Y, Riley R, Deeks J. Meta-analyses of diagnostic accuracy studies in mental health. Evidence Based Mental Health 2015; 18:103-109.
1.1 Test evaluation and thesis overview
Medical tests are necessary to resolve uncertainty about the health status of an individual. A clinically effective test should reduce ambiguity in clinical decision making, lead to prompt and appropriate intervention, and ultimately improve patient outcomes. For example,
tuberculosis (TB) was declared a global emergency by the World Health Organization (WHO) in 1993.1 The spread of HIV and the emergence of multidrug-resistant TB (MDR-TB) have worsened the impact of TB in terms of morbidity and mortality.2 As such rapid diagnosis of MDR-TB is a global priority for TB control. The WHO recommends the use of the Xpert® MTB/RIF system as the initial diagnostic test in individuals suspected of having MDR-TB or HIV-associated TB.3 The information obtained from the test enables quicker decisions about treatment and infection control compared to culture.4 Since testing is pivotal to health care, tests should only be recommended for routine clinical use based on evidence of their clinical performance (i.e. diagnostic accuracy) and clinical effectiveness (i.e. benefits and harms) derived from relevant, high quality primary studies and systematic reviews. Well conducted systematic reviews of relevant, high quality primary research studies are generally considered to be the highest level of evidence.5
Diagnostic accuracy is the ability of a test to correctly identify or exclude a target condition. A systematic review of diagnostic test accuracy (DTA) aims to identify and summarise
2 evidence from multiple studies addressing the same question, including an assessment of the quality and consistency of the evidence. The review may include a meta-analysis by applying statistical methods to combine the results of multiple studies. A DTA review may summarise the accuracy of one or more tests individually or compare their accuracy in a meta-analysis. This thesis focuses primarily on improving comparisons of test accuracy in systematic reviews and meta-analyses to ensure valid methods are used in identifying the most accurate test(s) from a number of competing tests. Comparative accuracy is an area of increasing importance and relevance to health technology assessment. This will be discussed further in sections 1.5 and 1.6.
This chapter provides the background and foundation for the work in the remainder of the thesis. In particular, it gives an understanding of key concepts, demonstrates the role of diagnostic accuracy within the wider context of test evaluation, and then defines the scope of the thesis questions in more detail. The first part of this chapter is designed to promote awareness of the complexities of test evaluation. Sufficient detail is given about test types to enable an understanding of the characteristics of the systematic reviews described in the thesis. The second part focuses on the role of test accuracy, analysis of primary studies of a single test and their synthesis in systematic reviews. The rationale for systematic reviews and the common meta-analytic methods for pooling test accuracy studies, which will be evaluated in later chapters, are introduced. Finally, the third part deals with test comparisons, including study design, roles of tests within a diagnostic pathway and the challenges in assessing comparative accuracy in systematic reviews and meta-analyses. In addition, justification for the questions considered in subsequent chapters is summarised.
3 For simplicity, the term patient will be used throughout the thesis instead of participant. The only exception will be where specific reference is made to individuals suspected of a
particular target condition that is clearly not a disease e.g. screening pregnant women for fetal aneuploidy. The terms target condition and disease will be used interchangeably as
appropriate.
1.1.1 Types of medical tests
There is a wide range of test types. Tests may be performed outside a living body (in vitro diagnostics) or directly applied on or inside the body (in vivo diagnostics). Some tests are specific for a particular target condition or group of related conditions (e.g. amniocentesis for detection of fetal aneuploidy), while other tests may be used for a number of diseases (e.g. CA-125, a biomarker for certain types of cancers). Tests may be as simple as individual elements of clinical/physical examination and history taking or highly sophisticated technological devices. Information from two or more tests may be combined to derive multivariable diagnostic models, clinical prediction rules or algorithms e.g. Alvarado score for diagnosis of appendicitis.6 Several test types will appear in examples and the cohorts of systematic reviews used in this thesis. The wide range of test types leads to different types of data and measures for quantifying test accuracy which in turn have implications for meta-analytic methods. The next section provides a synopsis of test evaluation, a necessary precursor for placing diagnostic accuracy into context.
1.1.2 Phases of test evaluation
The process of test evaluation is multifaceted and challenging, requiring a clear definition of the intended use and role of a test for a specific population within the context of a clinical
4 pathway. Since test evaluation is multifaceted, evaluation cannot be accomplished in a single study but requires a sequence of studies that address different aspects of test performance. The studies are often undertaken in an order which reflects increasing expense, embedding the tests deeper in clinical pathways, and an appreciation of the resource implications of implementation in clinical practice.
Various frameworks have been developed for the process of test evaluation, sometimes designed for specific test types such as laboratory tests,7 genetic tests,8 biomarkers9 and imaging tests.10 Lijmer et al systematically reviewed the literature on schemes for the evaluation of medical tests and identified 19 schemes published between 1978 and 2007.11 Each scheme consists of between four and seven phases. The six common phases and research questions they address are summarised in Table 1.1. At the lowest level of the hierarchy is the evaluation of technical performance and at the highest level is societal efficacy expressed in terms of resource use and societal benefits.
5
Table 1.1| Phases of test evaluation
Phase Type of research question
Analytical performance Does the test give usable information (reliable and reproducible)?
Diagnostic accuracy How well does the test distinguish between diseased and non-diseased individuals?
Phase I Do test results in patients with the target condition differ from those in healthy people?
Phase II Are patients with certain test results more likely to have the target condition than patients with other test results? Phase III Does the test result distinguish between patients with and
without the target condition in a clinically relevant population?
Diagnostic thinking Does the test change diagnostic reasoning and decisions? Therapeutic efficacy Does the test change patient management?
Clinical effectiveness Do patients who undergo the test have better clinical outcomes than those who were not tested?
Societal efficacy Is the test resource-efficient and beneficial for society? This summary was derived from Lijmer et al.11 The diagnostic accuracy phase shows the multiphase model proposed by Sackett and Haynes.12
Lijmer et al concluded that test evaluation is most likely a cyclic and repetitive process rather than a stepwise linear one.11 More recently, Horvath et al9 proposed a dynamic cycle driven by the clinical pathway as shown in Figure 1.1. The cycle consists of five components related to the phases in Table 1.1—analytical performance, clinical performance (diagnostic
accuracy), clinical effectiveness, cost effectiveness and broader impact (societal efficacy). Cost effectiveness is frequently assessed along with clinical effectiveness and is termed societal efficacy when costs are considered from a societal perspective.
6
Figure 1.1| Framework for the evaluation of in vitro medical tests
This cyclical approach to test evaluation is driven by the clinical pathway and shows the dynamic inter-relationship between the different components of the process. The original purpose and role of the test can be redefined if an alternative use for the test becomes apparent during the evaluation process.9 This new role for the test will inform the design of subsequent evaluations. (Adapted from Horvath et al 20149)
As mentioned earlier in section 1.1, the value of a test ultimately depends on its clinical effectiveness, i.e., effect on patient outcomes. Test accuracy can potentially be linked to the accuracy of clinical decision making through the downstream consequences of true positive, false positive, false negative and true negative test results, but benefits and harms to patients may also be driven by other factors too. According to Ferrante di Ruffano et al13, testing represents the first step of a test-plus-treatment pathway and changes to components of this pathway following the introduction of a new test could trigger changes in health outcomes. They identified several mechanisms which they summarised under direct effects of testing, changes to diagnostic and treatment decisions or timeframes, and alteration of patient and clinician perceptions.
7 Following the overview of the test evaluation process, the remaining sections of this chapter will now focus on diagnostic accuracy. First single test evaluations will be considered and then test comparisons.
1.2 Role of test accuracy
Assessment of diagnostic accuracy is an integral part of test evaluation as shown in Table 1.1. Diagnostic accuracy describes the ability of a test to classify individuals, typically simplified into a dichotomy by applying a criteria (referred to as thresholds, cut-offs or cut-points) to define test negatives and test positives. Several authors have proposed multiple phases in the evaluation of diagnostic accuracy to distinguish between early assessment of test performance (i.e. proof-of-concept or exploratory studies) in a population of known cases and non-cases (case control study), and later assessment in a representative population in an appropriate clinical setting (prospective cross-sectional study of suspected cases).12,14-16
Test accuracy is estimated by comparing results of an index test (a new or existing test of interest) with a reference standard, sometimes known as a ‘gold’ standard, as shown in Table 1.2. The reference standard is used to verify the presence or absence of the target condition, and may be a single test or a combination of tests and clinical information not routinely available in practice.
8
Table 1.2| Cross classification of index test and reference standard results
Reference standard positive
Reference standard negative
Total
Index test positive a (true positives) b (false positives) a + b (test positives)
Index test negative c (false negatives) d (true negatives) b + d (test negatives)
Total a + c (disease positives) b + d (disease negatives) a + b + c + d (study total)
In the United Kingdom, the National Institute for Health and Care Excellence (NICE) recommend that evidence for the appraisal of diagnostic technologies should normally incorporate evidence on the accuracy of the diagnostic technology.17 According to the
Australian Medical Services Advisory Committee (MSAC) guideline, in the absence of RCTs of test effectiveness, i.e. direct evidence, linked evidence can be used to infer test
effectiveness when the transferability of results between studies of test accuracy and studies of treatment effectiveness can be reasonably justified.18 Also, European Medicines Agency (EMA) guidance recommends that where it is already known that intervention following the use of a diagnostic test leads to a clinical benefit, there is no need to repeat this proof for every subsequent diagnostic test in the same setting. However, evidence of an adequate reasoning that a clinical benefit is expected should be provided.19
Assessment of diagnostic accuracy has limitations. Improved test accuracy does not guarantee better clinical outcomes, does not convey decisions made based on test results, and the link between test accuracy and patient outcomes is complex. Lord et al20 suggested a framework to help decide whether a new diagnostic test can be adopted based only on evidence of test accuracy or if studies of clinical effectiveness are needed. The test-treatment randomized controlled trial (RCT) is regarded as the ideal study design for evaluating clinical
9 new and existing tests, followed by appropriate management or intervention based on test results, and finally patient outcomes are measured and assessed. However, the cost and duration of test-treatment RCTs often make them unrealistic, and so they are rare.22 An
alternative is to assess health outcomes using decision analysis (or the MSAC linked evidence approach18) to model the consequences of testing and alternative management strategies. This will be discussed briefly in section 1.5.
1.3 Analysis of primary studies of a single test
In the following subsections, types of data and summary measures that can be used to determine diagnostic accuracy are described. Several measures used in primary studies are also used in meta-analysis to quantify test accuracy. Therefore, an introduction to the commonly used measures provides useful background prior to discussing meta-analytic models in section 1.4 and other chapters of the thesis.
1.3.1 Types of data
The diversity of test type leads to different types of data for computing test accuracy. Data may be nominal (binary), ordinal (ordered categories), discrete (count) or continuous. Standard methods for computing test accuracy demand binary classification of the results of the index test and the reference standard (Table 1.2). As such for non-binary data, thresholds are needed to dichotomise the data. The threshold may be an explicit numeric value or may be implicit based on subjective visual interpretation or judgement.
10 1.3.2 Types of measures
Several measures are used to quantify test accuracy. These may be paired measures or single indicators of test performance. Where a test is measured on a continuum, paired measures relate to test performance conditional on a particular threshold. Some single measures are also threshold specific while others are global, assessing performance across all possible
thresholds. The different types of measures are explained below.
1.3.2.1 Paired measures of test accuracy
Paired measures—sensitivity and specificity, positive and negative predictive values, and positive and negative likelihood ratios (LR+ and LR–)—are typically used to quantify test performance because of the need to distinguish between the presence and absence of the target condition. Sensitivity and specificity are the most commonly reported measures. Sensitivity is the probability that those with the target condition are correctly identified as having the condition (i.e. P[𝑌𝑌= 1|𝐷𝐷= 1]), while specificity is the probability that those without the target condition are correctly identified as not having the condition (i.e. P[𝑌𝑌= 0|𝐷𝐷 = 0]). D and Y are binary variables that denote disease status and test result respectively. Sensitivity is also known as the true positive rate (TPR), true positive fraction (TPF) or detection rate, and specificity as the true negative rate (TNR) or true negative fraction (TNF). The false positive rate (FPR) or false positive fraction (FPF), 1–specificity, is sometimes used instead of specificity.
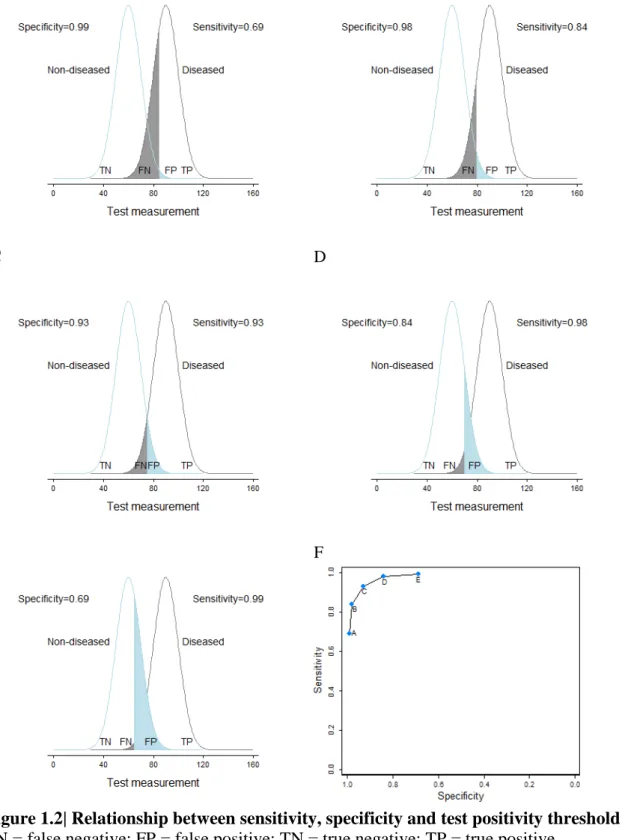
Figure 1.2 (panels A to E) show the effect of varying test threshold on sensitivity and specificity. For a test where disease increases the value of a biomarker, as the threshold decreases, sensitivity increases while specificity decreases, and vice versa. This trade-off
11 between sensitivity and specificity across thresholds is graphically depicted in a receiver operating characteristic (ROC) plot as shown in Figure 1.2 (panel F).
Figure 1.2| Relationship between sensitivity, specificity and test positivity threshold
FN = false negative; FP = false positive; TN = true negative; TP = true positive. (Adapted from Macaskill et al 201023)
A B
C D
12 Traditionally, the ROC plot is a plot of sensitivity against 1-specificity. However, as in Figure 1.2 (panel F), it is possible to plot sensitivity against specificity by reversing the labelling of the specificity axis. The position of the ROC curve depends on the discriminatory ability of the test which is illustrated as the degree of overlap of the distributions of test measurements for the diseased and non-diseased groups (Figure 1.2 panels A to E); the more accurate the test is, the closer the curve to the upper left hand corner of the ROC plot. The ROC curve can also be used to evaluate the discriminative ability of multivariable diagnostic and prognostic models.24
1.3.2.2 Single and global measures of test accuracy
As alluded to earlier, some single measures of test accuracy can be regarded as global
measures of accuracy because they assess test performance across all possible thresholds. This includes the diagnostic odds ratio (DOR) and the area under the curve (AUC). Other single measures like Youden’s index (sensitivity + specificity–1) and probability of a correct result (also known as accuracy) are threshold specific. Single measures are not always relevant in clinical practice because there is no information on the error rates in the diseased (false positives) and non-diseased groups (false positives). These error rates are important for judging the extent and likely impact of downstream consequences.25
Due to its relevance for meta-analysis as will be shown in section 1.4, only the DOR is described here. The DOR is defined as the ratio of the odds of positivity in those who have the target condition relative to the odds of positivity in those without the condition.26
13 Therefore, a test with high TPR and low FPR will have a high DOR. The DOR is calculated as
DOR = TPFP××TNFN ,
where TP, TN, FP, and FN are the number of true positives, true negatives, false positives and false negatives. The DOR can also be expressed in terms of sensitivity and specificity, or likelihood ratios as follows:
DOR = sensitivity 1−sensitivity 1−specificity specificity
=
LR+LR−.The ROC curves shown in Figure 1.3 are all symmetrical about the line of symmetry (sensitivity is equal to specificity at each point on this line). An ROC curve is symmetric when the test results for the diseased and non‐diseased groups have logistic distributions with equal variances. When the variances are unequal, the ROC curve is asymmetric (Figure 1.4). Symmetric ROC curves that arise from bilogistic distributions can be summarised by a
constant DOR as shown for each of the six curves in Figure 1.3. In contrast, asymmetric ROC curves cannot be summarised by a single DOR because the DOR varies with change in
threshold (Figure 1.4 panel B).
The DOR can be a useful measure when comparing tests, particularly if there is interest is in global performance and no preference for either superior sensitivity or specificity. ROC curves can also be used to compare tests. Such comparisons account for the difference in test accuracy across the range of possible thresholds for each of the tests.
14
Figure 1.3| Relationship between diagnostic odds ratios and symmetric ROC curves
DOR = diagnostic odds ratio.
Six symmetric ROC curves are shown on the figure. Each point on a curve corresponds to the common diagnostic odds ratio shown on the curve. Sensitivity is equal to specificity at each point on the line of symmetry (downward diagonal).
(Adapted from Macaskill et al 201023)
(A) Bilogistic distributions of non-diseased and non-diseased groups
(B) Asymmetric ROC curve
Figure 1.4| Relationship between diagnostic odds ratios and asymmetric ROC curves
DOR = diagnostic odds ratio.
(Adapted from Macaskill et al 201023)
DOR = 1 (uninformative test)
Line of symmetry DOR = 2 DOR = 5 DOR = 16 DOR = 81 DOR = 361 0 .0 0 .2 0 .4 0 .6 0 .8 1 .0 Se n si ti vi ty 0.0 0.2 0.4 0.6 0.8 1.0 Specificity
15
1.4 Research synthesis and methods for meta-analysis of a single test
Systematic reviews and meta-analyses of test accuracy studies summarise the available evidence on the accuracy of a test for a given question. Their rate of publication has risen considerably since the 1990s.27 Many test accuracy studies are small,28 and even when studies are large, the number of cases may be small due to low prevalence of the target condition. A meta-analysis is an efficient approach for pooling the results of these studies to obtain more precise estimates of test performance. The extent of heterogeneity can be quantified in a meta-analysis and formal investigations of potential sources of heterogeneity may also be
performed in order to explain why results differ between studies.
Test accuracy reviews can be used to inform evidence based clinical practice guidelines and health care policy,29,30 and are also useful for identifying research gaps. It is also important for the findings of a new study to be appraised within the context of relevant existing evidence. According to Mulrow,
"the hundreds of hours spent conducting a scientific study ultimately contributes only a piece of an enormous puzzle. The value of any single study is derived from how it fits with and expands previous work, as well as from the study's intrinsic properties. Through systematic review the puzzle's intricacies may be disentangled".31
The methodology underpinning reviews has an impact on their validity, and several stages of the process for DTA reviews present greater challenges than reviews of interventions. These include study identification, methodological quality appraisal of studies and meta-analysis.32 Recognising the complexity of DTA reviews, the Cochrane Collaboration—the world’s largest producer of systematic reviews—delayed introducing this review type into the Cochrane Library until there was sufficient development and understanding of methodology to support their implementation and production. The first Cochrane DTA review was
16 published in 2008, 12 years after the formal registration of the Cochrane Screening and
Diagnostic Test Methods Group.32
Methods for conducting test accuracy meta-analyses have evolved over the last two decades.32 A number of approaches have been used ranging from simple univariate pooling methods to highly sophisticated hierarchical methods that include information from multiple thresholds used in each study. These hierarchical methods are more complex than those routinely used for synthesising the effects of interventions. The thesis focuses on methods applicable in the common situation where a single 2x2 table of the results of an index test cross classified with a reference standard is available, or can be derived for each study included in the analysis. The issue of heterogeneity is briefly introduced below before describing the commonly used meta-analytic methods.
1.4.1 Heterogeneity
It is the norm to observe heterogeneity in test accuracy between studies that is much more than would be expected from within-study sampling error alone. Measures of test accuracy are not fixed properties of a test and are not usually transferable across different populations and settings.33 Other factors such as threshold, characteristics of the test and its conduct (including skill and experience of assessors or practitioners), and definition of the target condition may also affect test performance. The spectrum of disease in a population is dependent on prevalence, disease severity, clinical setting and prior testing. While all
measures are susceptible to disease spectrum, measures such as predictive values are directly affected by prevalence.34
17 1.4.2 Univariate pooling methods
Univariate fixed effect or random effects meta-analytic methods pool sensitivity and specificity separately, ignoring any correlation that may exist between the two measures. Fixed effect models assume homogeneity while random effects models enable the possibility of variability in test accuracy beyond sampling error alone by allowing each study to have its own test accuracy, i.e., the model includes a between-study variance component 𝜏𝜏2 or σ2. Although 𝜏𝜏2 is a generally used notation in traditional random effects models, σ2is used throughout the thesis for consistency with the notation of the bivariate model that will be described in section 1.4.4.1. Heterogeneity in test accuracy is expected and so fixed effect models that estimate the underlying common test accuracy are inappropriate and random effects models are recommended.23,35
If the observed logit sensitivity and logit specificity from the ithstudy are 𝜇𝜇̂𝐴𝐴𝐴𝐴 and 𝜇𝜇̂𝐵𝐵𝐴𝐴 respectively, then the general random effects model for sensitivity and specificity can be specified as
𝜇𝜇̂𝐴𝐴𝐴𝐴~𝑁𝑁(𝜇𝜇𝐴𝐴𝐴𝐴, 𝑠𝑠𝐴𝐴𝐴𝐴2), 𝜇𝜇̂𝐵𝐵𝐴𝐴~𝑁𝑁(𝜇𝜇𝐵𝐵𝐴𝐴, 𝑠𝑠𝐵𝐵𝐴𝐴2 );
𝜇𝜇𝐴𝐴𝐴𝐴~𝑁𝑁(𝜇𝜇𝐴𝐴, σ𝐴𝐴2), 𝜇𝜇𝐵𝐵𝐴𝐴~𝑁𝑁(𝜇𝜇𝐵𝐵, σ𝐵𝐵2), (1.1)
where 𝜇𝜇𝐴𝐴𝐴𝐴 and 𝜇𝜇𝐵𝐵𝐴𝐴 are the true underlying estimates of logit sensitivity and logit specificity, and 𝑠𝑠𝐴𝐴𝐴𝐴2 and 𝑠𝑠𝐵𝐵𝐴𝐴2 their variances for the ith study (i = 1, 2, …, n). 𝜇𝜇𝐴𝐴 and 𝜇𝜇𝐵𝐵 represent the average logit sensitivity and logit specificity, and σ𝐴𝐴2and σ𝐵𝐵2 their variances which quantify the degree of heterogeneity between studies. Ideally, a binomial likelihood should be used to model within-study variability but the normal approximation shown in equation (1.1) is commonly used in practice.
18 The simplest and most commonly used random effects method is the DerSimonian and Laird approach which uses a normal distribution to model within-study variability and a moments estimator for the between-study variance. Logit transformed sensitivity or specificity and the within-study variance is undefined when there are zero cells in a study’s two by two table (Table 1.2). A continuity correction (typically 0.5) is applied, leading to a downward bias in test accuracy.36
1.4.3 Summary receiver operating characteristic regression
The summary receiver operating characteristic (SROC) curve approach, developed by Moses et al,37 accounts for potential heterogeneity in threshold. It uses a logistictransformation of the true positive and false positive rates and linear regression to model the relationship between test accuracy, D, and the proportion test positive (related to threshold), S.
𝐷𝐷𝐴𝐴 =𝑎𝑎+𝑏𝑏𝑆𝑆𝐴𝐴 +𝑒𝑒𝐴𝐴 (1.2)
with
𝑒𝑒𝐴𝐴~𝑁𝑁(0,𝜎𝜎2)
where a is the intercept, 𝑏𝑏 is the regression coefficient for S, and 𝑒𝑒𝐴𝐴 is the random error. From each study i, 𝐷𝐷𝐴𝐴 and 𝑆𝑆𝐴𝐴 are computed as
𝐷𝐷𝐴𝐴 = ln�1−TPRTPR𝑖𝑖𝑖𝑖� −ln�1−FPRFPR𝑖𝑖𝑖𝑖� (1.3)
and
𝑆𝑆𝐴𝐴 = ln�1−TPRTPR𝑖𝑖𝑖𝑖�+ ln�1−FPRFPR𝑖𝑖𝑖𝑖� . (1.4)
The difference in the logits, D, is the log of the diagnostic odds ratio. S increases as the proportion of true and false positives increase, and is therefore considered a proxy for
threshold. If accuracy does not depend on threshold, i.e. b = 0, the SROC curve is symmetric and can be described by a constant DOR given by the exponent of the intercept a.
19 A single summary estimate of sensitivity and specificity cannot be obtained from the Moses model. In computing the model variables D and S, both of which are functions of sensitivity and specificity, information is lost on the observed estimates of sensitivity and specificity from each study. However, the expected sensitivity for a given value of specificity can be estimated by
E(sensitivity) =
�
1 +
exp (𝑎𝑎⁄1(1−𝑏𝑏))×
�
1−specificityspecificity�
1+𝑏𝑏 1−𝑏𝑏�
−1
,
(1.5)where a is the intercept and b is the slope from the regression equation in (1.2).
The AUC and Q* are sometimes used to quantify the SROC curve. The AUC is a global measure of test accuracy with values ranging between 0 and 1. The AUC can be calculated as
AUC =
∫
exp� 𝑎𝑎 1−𝑏𝑏�� 𝑥𝑥 1−𝑥𝑥� (1+𝑏𝑏) (⁄1−𝑏𝑏) 1+exp�1−𝑏𝑏𝑎𝑎 ��1−𝑥𝑥𝑥𝑥 �(1+𝑏𝑏) (⁄1−𝑏𝑏) 1 0 d𝑥𝑥 , (1.6)where x is FPR. There is no closed form for the integral in (1.6) and so the AUC is obtained numerically.38 For symmetric SROC curves, the AUC can be expressed in terms of the DOR as
AUC = DOR
(DOR−1)2 [(DOR−1)−lnDOR] . (1.7)
The usefulness of the AUC is limited because certain regions of ROC space may lack data and so the SROC curve extends beyond the range of the data. In addition, SROC curves with the same AUC may have different symmetry properties. As the AUC does not provide information on sensitivity and specificity, it is not possible to assess test accuracy at different thresholds, and the consequences of test errors cannot be inferred at any threshold.
20 Moses et al proposed the Q* as an alternative to the AUC.37 The Q* statistic is the point on the SROC curve where sensitivity is equal to specificity, i.e. the intersection of the curve and the line of symmetry. The line of symmetry is the negative diagonal and sensitivity =
specificity at every point on the line. Q* can be computed as
Q∗ = 1
1+𝑒𝑒−𝑎𝑎 2⁄
.
(1.8)Based on equation 1.4, it can be deduced that S = 0 at Q*. The use of Q* is not recommended as it can be misleading if SROC curves are asymmetric, or study points lie away from the line of symmetry.
The SROC model is usually fitted using unweighted least squares linear regression, or weighted by study size or the inverse of the variance of D. The SROC approach is a fixed effect method in which variation is attributed solely to threshold effect (and sampling error if study estimates are weighted). The approach has methodological limitations which lead to inaccurate standard errors, thus rendering formal statistical inference invalid.39,40 Similar to the DerSimonian and Laird approach, zero cell corrections may be required.
1.4.4 Hierarchical models
Hierarchical models (also known as mixed or multilevel models) take into account correlation between sensitivity and specificity across studies while also allowing for variation in test performance between studies through the inclusion of random effects. The bivariate model41 and the hierarchical summary receiver operating characteristic (HSROC) model42 are the two main approaches recommended for meta-analysis when a sensitivity and specificity pair is available for each study.23,35,43 The two approaches differ in parameterizations, but the models
21 are mathematically equivalent when no covariates are included.44 The choice of approach is often determined by variation in the thresholds reported in the included studies and the focus of inference—a summary point (summary sensitivity and specificity) or a SROC curve. Due to their shared statistical properties, SROC curves can be computed from bivariate models and average operating points from HSROC models, so the choice of model when there is only a single test is academic.23,44,45 However, when there are comparisons between tests or subgroups, the choice of model is important as will be explained in section 1.5.4 and illustrated in section 2.3.2 using three case studies.
For the summary sensitivity and specificity of a test to have a clinically meaningful
interpretation, the analysis should be based on data at a given threshold. For the estimation of a SROC curve, data from all studies, regardless of threshold, can be included but only one threshold per study is selected for inclusion in the analysis. Methods have been proposed which allow inclusion of data from multiple thresholds per study,46-48 but these are rarely used in practice due to their complexity and limitations.49 A SROC plot of sensitivity against specificity is usually used to display the results of the included studies as points in ROC space. The plot can also show meta-analytic summaries such as SROC curves or summary points with corresponding confidence and/or prediction regions to illustrate uncertainty and heterogeneity, respectively (see Figure 1.5 and Figure 1.6).
Both classical and Bayesian hierarchical methods are available but the latter is rarely used by meta-analysts.27 Furthermore, many test accuracy meta-analyses include small numbers of studies and so prior distributions required by Bayesian methods are likely to be influential. Consequently, empirically based prior distributions for variances and correlations are needed