R E S E A R C H A R T I C L E
Open Access
Detecting differential allelic expression using
high-resolution melting curve analysis:
application to the breast cancer susceptibility
gene CHEK2
Tú Nguyen-Dumont
1, Lars P Jordheim
2, Jocelyne Michelon
1, Nathalie Forey
1, Sandrine McKay-Chopin
1, for
Kathleen Cuningham Foundation Consortium for Research into Familial Aspects of Breast Cancer (kConFab)
3,
Olga Sinilnikova
4, Florence Le Calvez-Kelm
1, Melissa C Southey
5, Sean V Tavtigian
6and Fabienne Lesueur
1*Abstract
Background:The gene CHEK2encodes a checkpoint kinase playing a key role in the DNA damage pathway. ThoughCHEK2 has been identified as an intermediate breast cancer susceptibility gene, only a small proportion of high-risk families have been explained by genetic variants located in its coding region. Alteration in gene
expression regulation provides a potential mechanism for generating disease susceptibility. The detection of differential allelic expression (DAE) represents a sensitive assay to direct the search for a functional sequence variant within the transcriptional regulatory elements of a candidate gene. We aimed to assess whetherCHEK2was subject to DAE in lymphoblastoid cell lines (LCLs) from high-risk breast cancer patients for whom no mutation in
BRCA1orBRCA2had been identified.
Methods:We implemented an assay based on high-resolution melting (HRM) curve analysis and developed an analysis tool for DAE assessment.
Results:We observed allelic expression imbalance in 4 of the 41 LCLs examined. All four were carriers of the truncating mutation 1100delC. We confirmed previous findings that this mutation induces non-sense mediated mRNA decay. In our series, we ruled out the possibility of a functional sequence variant located in the promoter region or in a regulatory element ofCHEK2that would lead to DAE in the transcriptional regulatory milieu of freely proliferating LCLs.
Conclusions:Our results support that HRM is a sensitive and accurate method for DAE assessment. This approach would be of great interest for high-throughput mutation screening projects aiming to identify genes carrying functional regulatory polymorphisms.
Background
The CHEK2 gene (cell cycle checkpoint kinase 2) is a multiorgan tumour susceptibility gene involved in the maintenance of genomic stability. CHEK2 functions downstream of ATM (Ataxia-telangiectasia mutated) to phosphorylate several substrates, including TP53 (Tumour protein p53), Cdc25C (Cell division cycle 25C) and BRCA1 (Breast cancer 1, early onset), leading to cell
cycle arrest, activation of DNA repair or apoptosis in response to DNA double-stranded breaks. SinceCHEK2 plays a key role in the DNA damage pathway, loss of function of the protein may allow cells to evade normal cell cycle checkpoints, ultimately leading to tumour initiation or progression. The CHEK2*1100delC dele-tion, falling in the kinase domain of the protein, has been widely studied for its contribution to inherited breast cancer susceptibility [1]. This mutation induces a premature stop codon in exon 10, and causes the trun-cation of the protein at codon 381 thus abrogating its
* Correspondence: [email protected]
1Genetic Cancer Susceptibility Group, IARC, 69372 Lyon, France
Full list of author information is available at the end of the article
kinase activity. The frequency of CHEK2*1100delC dif-fers between ethnic populations, and is higher in the North of Europe and low or absent in other countries [2].
The CHEK2-Breast Cancer Consortium reported a fre-quency of 5.1% for the CHEK2*1100delC variant in familial breast cancer cases who tested negative for BRCA1andBRCA2(Breast cancer 2, early onset) muta-tions, as opposed to 1.1% of carriers in the control population [3]. This intermediate-risk breast cancer sus-ceptibility allele almost triples the risk of developing the disease in unselected breast cancer cases (OR = 2.34; 95% CI[1.72 - 3.20]) [4]. Other founder mutations in CHEK2 have been associated with an increased risk of cancer [5]. Though first discovered in breast cancer patients,CHEK2 mutations have since been reported to predispose to a range of cancer types, including ovarian, prostate, kidney and colorectal cancers [6], supporting the hypothesis thatCHEK2is a multiorgan cancer sus-ceptibility gene [5].
As part of an international breast cancer genetics study aiming to investigate candidate genes conferring an intermediate-risk of breast cancer, we mutation screened the coding exons and the adjacent proximal introns ofCHEK2in 1415 cases and 1204 controls. The main goal of this study was to evaluate and to compare the role of truncating mutations, splice junction muta-tions and rare missense substitumuta-tions in breast cancer susceptibility [7]. In order to fully assess the contribu-tion ofCHEK2in breast cancer susceptibility, we aimed to test whether the gene was subject to differential alle-lic expression (DAE). In such a case, it would be worth extending variant discovery efforts from the coding sequence of the gene to known or predicted regulatory regions to search for causal variants. Indeed, phenotypic variation may be influenced by sequence variations in genes by alterations in the quality or in the quantity of the encoded proteins [8]. These changes are transmitted from the gene to the protein in the guise of modifica-tions of the sequence or the abundance of mRNA. From this perspective, it can be hypothesized that gene expression regulation may be the underlying explanation for a proportion of cancer that have not been resolved yet by mutation screening of coding regions in currently known cancer predisposition genes.
Allelic imbalance was first described in parental imprinting and X-chromosome inactivation but it is becoming clear thatcis-acting variations in gene expres-sion occur commonly in the human genome, playing a key-role in human phenotypic variability [9-11]. Charac-terization of the effect ofcis-acting polymorphisms in regulatory regions is a great challenge due to the diffi-culty to locate these regions. In addition, regulatory var-iants are not robustly detected by sequence analysis
since SNP identification by screening regulatory regions does not consistently allow prediction of the effect of observed SNPs on gene expression. Thus, knowledge of the effect of genetic variants affecting mRNA transcrip-tion is very limited. One possible approach to address this issue is the examination of disruption/alteration of gene expression level. The most sensitive test for this phenomenon is to carry a careful survey of whether two alleles of a gene are equally expressed. This approach has been used in studies aiming at identifying functional cis-variants that can have a role in susceptibility to breast [12,13] and colorectal cancer [14,15]. In some cases, observation of DAE will be explained by a trun-cating mutation resulting in non-sense mediated mRNA decay (NMD) or by a splice junction mutation resulting in an unstable transcript. However, DAE can also be the signature of a heterozygous carriage of a regulatory var-iant [16] or of an epigenetic event (methylation) [17].
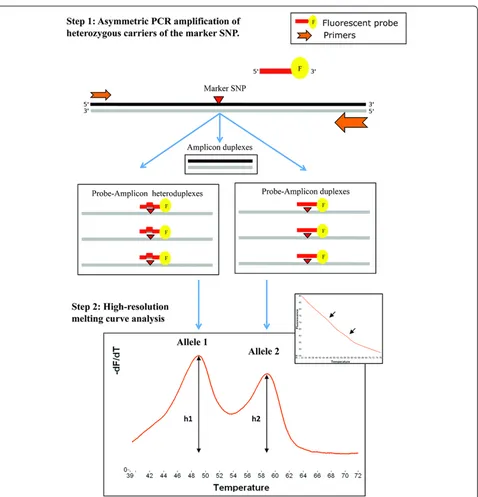
In this study, we used a high-resolution melting (HRM) analysis approach to perform allele-specific expression measurement in CHEK2. As in currently used methods for investigating DAE, this approach is applied to individual subjects who are heterozygous for an exonic marker SNP, specifically targeted by a labelled probe, called SimpleProbe [18,19]. Data acquisition on HRM instruments consists of monitoring changes in the fluorescence intensity of the probe, as it dissociates from the two allelic templates, while the probe-target duplexes are continuously heated. We have already reported the use of this methodology to compare the relative abundance of allelic transcripts in a study inves-tigating mRNA degradation due to NMD in BRCA2 [19], and in a group of selected genes involved in the cellular response to the cytotoxic agent cytarabine [20]. In these studies, DAE analysis was limited by the single-capillary throughput of the HRM device used, the HR-1™ instrument, and allelic imbalance was quantified manually. Here, we report additional experiments and testing, as well as up-scaling possibilities with a high-throughput HRM device, the LightScanner®instrument that uses a 384-well plate format. To improve the analy-sis of allelic expression, an analyanaly-sis tool was developed using R in order to process data acquired with HRM commercialized software. Our script provides allelic imbalance estimates and subsequent statistical calcula-tions that are required to assess DAE.
Methods
Lymphoblastoid cell lines
genes had been identified. Biological samples were obtained from Creighton University School of Medicine (Omaha, NE, USA, 33 familial cases), Centre Léon Bérard (CLB, Lyon, France, 21 patients diagnosed below age 50) and the Kathleen Cuningham Consortium for Research into Familial Aspects of Breast Cancer (kCon-Fab, Melbourne, Australia, 35 familial cases). LCLs were established by Epstein-Barr virus immortalization of patients’blood lymphocytes. Cells were maintained in RPMI 1640 medium (Invitrogen, Cergy-Pontoise, France) supplemented with 20% fetal calf serum (VWR, Fontenay-sous-bois, France), 0.4% fungizon (Qiagen, Courtaboeuf, France) and 1% penicilin-streptomycin (Invitrogen), in 5% CO2 incubator at 37°C with 95% humidity. For NMD inhibition, LCLs were treated for 6 hours with 100 μM puromycin (Sigma Aldrich, St Quentin Fallavier, France).
DNA samples
Genomic DNAs and total RNAs were extracted from LCLs using Puregene DNA isolation kit (Qiagen) and NucleoSpin RNA II kit (Machery Nagel, Hoerdt, France), respectively. Integrity of RNA was controlled using the BioAnalyzer and RNA NanoChip II kit (Agi-lent, Massy, France) according to the manufacturer’s instructions. RNAs harbouring an RNA integrity num-ber (RIN) ≥ 8 were selected for further analysis [21]. Whenever the quality threshold was not reached, a new RNA extraction was performed so that all the RNAs used in this study had a minimum RIN of 8. Comple-mentary DNA (cDNA) synthesis was performed from 1 μg total RNA using SuperScript™ III First Strand Synthesis System for RT-PCR (Invitrogen) with oligo (dT) primers, according to the manufacturer’s instructions.
Mutation screening
The 89 subjects included in this study were drawn from a large-scale case-control mutation screening study invol-ving 1415 cases and 1204 controls, that has been described elsewhere [22,23]. CHEK2*1100delC carriers were all con-firmed by direct sequencing on genomic DNA (For muta-tion screening results, see Addimuta-tional file 1).
PCR amplification for DAE assessment
DAE was assessed in four replicates of primary PCR (PCR1), both with cDNA, cDNA from puromycin-trea-ted LCL, and genomic DNA (For primers and probes, see Additional file 2). PCR1 contained 2 μl template DNA in 1× PCR Buffer, 1.5 mM MgCl2, 0.13 mM dNTP, 0.2 μM forward and reverse primers specific to genomic DNA or cDNA, and 0.05 Units Platinum Taq Polymerase (Invitrogen), in a final volume of 8μl. The temperature cycling protocol was: 94°C for 3 minutes;
30 cycles at 94°C for 30 seconds, 62°C for 45 seconds and 72°C for 30 seconds; and finally 72°C for 5 minutes. To reduce competitive binding of the probe and the complementary strand during the melting curve analysis, the secondary PCR (PCR2) was carried out asymmetri-cally, with the primer generating the target strand at a 5-fold higher concentration (0.5 μM) than the primer for the other strand (0.1 μM). In addition, PCR2 con-tained 2μl of 1:15 diluted in TE-4PCR1 products com-bined with 0.9× Buffer, 1.38 mM MgCl2, 0.12 mM each dNTP, 0.5 μM SimpleProbe (Tib Molbiol, Berlin, Ger-many) and 0.4 Units of Taq Platinum Polymerase in a final volume of 6μl. Clear oil (Avatech) saturated with Tween 80 (Sigma Aldrich) was used to overlay PCR reactions. The temperature cycling protocol was the same as above, except that 45 cycles were performed. DAE analyses were performed in batches of 96 samples, corresponding to 4 replicates of genomic DNA, 4 repli-cates of cDNA and 4 replirepli-cates of puromycin-treated cDNA derived from 8 different LCLs.
High-resolution melting analysis
PCR product melting curves were obtained from the HR-1™ and the LightScanner®instruments by melting from 35°C to 75°C. Data were obtained with the sup-plied software (HR-1™ v1.5 and LightScanner®Software v2.0, respectively), and then exported to an analysis tool that we developed in R, a programming language and software environment for statistical computing and gra-phics http://cran.r-project.org. R scripts were developed in order to retrieve the data, to apply the Savitsky-Golay filter to smooth the derivative melting curves and to cal-culate the peak heights. For each sample, ratios were measured from 4 PCR-replicates and the mean ratio was calculated across all replicate samples. The R scripts are available on http://sourceforge.net/projects/hrmdae. The level of allelic imbalance for each individual was deter-mined from the difference between the log of the signal ratio in cDNA and the corresponding log ratio in geno-mic DNA. Statistical significance for the allelic imbal-ance was calculated using Student’s t-test. Criteria for DAE were the following: i) the point estimate of the dif-ference between genomic DNA and cDNA ratios should be greater than 20%; ii) the Student’s t-test p-value should be ≤0.05, and iii) the 95% confidence interval of the point estimate should not include 0 [14,19,20,24].
Results
Genotyping of CHEK2 exonic SNPs
provided the genotype of all common coding SNPs for every subject enrolled in the molecular epidemiology study. For 89 of the breast cancer patients investigated, LCLs were available to conduct DAE analysis.
In order to make a differential measurement of the level of expression of the two alleles of a gene for a given patient, one must be able to distinguish between the alleles. We used the two most common exonic SNPs that were identified during the mutation screening process, namely rs2236142 and rs2236141, and only the cell lines that are heterozygote for at least one of the two SNPs were selected for further analysis. These two markers are reported to be common in the dbSNP data-base (Minor allele frequency of 49.2% and 25.4% in Eur-opean populations, respectively). Thirty-two out of 89 cell lines were heterozygotes for rs2236142 and 17 out of 89 were heterozygotes for rs2236141 (see Additional Table 1). Eight individuals were double heterozygotes.
Evaluation of the HRM method to detect DAE
This technique relies on the distinction between the two alleles in heterozygous individuals using differences in melting temperature (Tm) with a derivative fluorescent signal correlated to the relative abundance of each tran-script. We first verified that HRM could distinguish between the two alleles of each SNP in our experimental conditions, by assaying genomic DNA and cDNA from all three genotypes. Analysis of the melting curves of the homozygous samples showed a transition at a Tm specific to each allele (Figure 1). Melting transitions were converted into peaks on the derivative plot. Het-erozygous samples presented transitions and peaks corresponding to each allele at both Tm. A no-template control was taken as baseline to subtract local back-ground value to the fluorescence intensity of the samples.
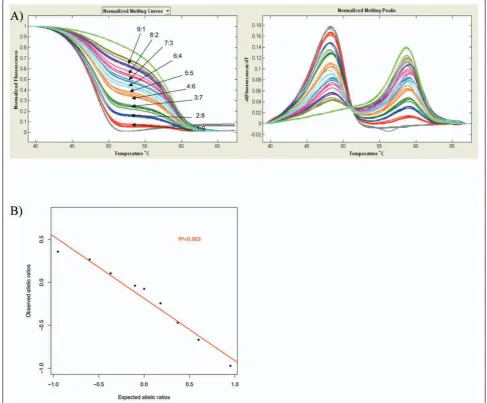
To examine the feasibility of detecting DAE by melt-ing curve analysis, we created a range of meltmelt-ing curves associated with known allelic imbalance. Using homozy-gous genomic DNAs, we produced bi-allelic templates with increasing minor allele:major allele proportions (9:1, 8:2, 7:3, 6:4, 5:5, 4:6, 3:7, 2:8, 1:9).
Allelic (im)balance was observed as the ratio of the peak heights of the fluorescence signal. As expected, the melting profiles of the mixtures of opposite homozy-gotes reflected the relative contribution of each allele to the total mixture (Figure 2A). For both SNPs we observed good correlations between allelic imbalance and peak height ratio measurements. For rs2236142, R2 = 0.974 on HR-1™and R2= 0.963 on LightScanner® (Figure 2B); for rs2236141, R2 = 0.973 on HR-1™ and R2 = 0.963 on LightScanner® (data not shown). The mixing experiments showed that the measured allelic ratios varied in a linear relationship with the dilution ratios. Altogether, these results show that HRM is able to accurately detect different extents of DAE.
Assessment of DAE for CHEK2 in LCLs from breast cancer patients
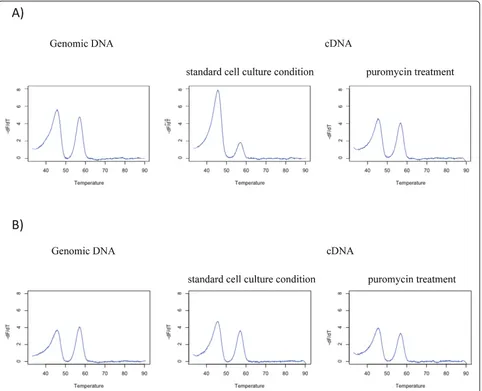
Mutation screening of the 89 LCLs identified four car-riers of the CHEK2*1100delC mutation (see Additional file 1). This mutation induces a premature termination codon and has been reported to trigger the NMD path-way [25,26], which leads to the specific degradation of mRNAs bearing such deleterious mutation [27]. In order to distinguish DAE that would be caused by NMD from DAE that would be caused by a regulatory variant altering the level of expression of the transcript, cDNA was derived from LCLs treated and untreated with puromycin, from each individual.
We performed quantitative measurements on genomic DNA and on both types of cDNA. Genomic DNA served as an internal control and provided the expected peak heights ratio value for a 1:1 allelic ratio, thereby controlling for any bias in the binding of the fluorescent probe to the two alleles. Because of differences in fluor-escence yield, measured peak heights ratios differed from unity when genomic DNAs were assessed. How-ever, the melting profiles of genomic DNA were in accordance with what was expected from the mixing experiment.
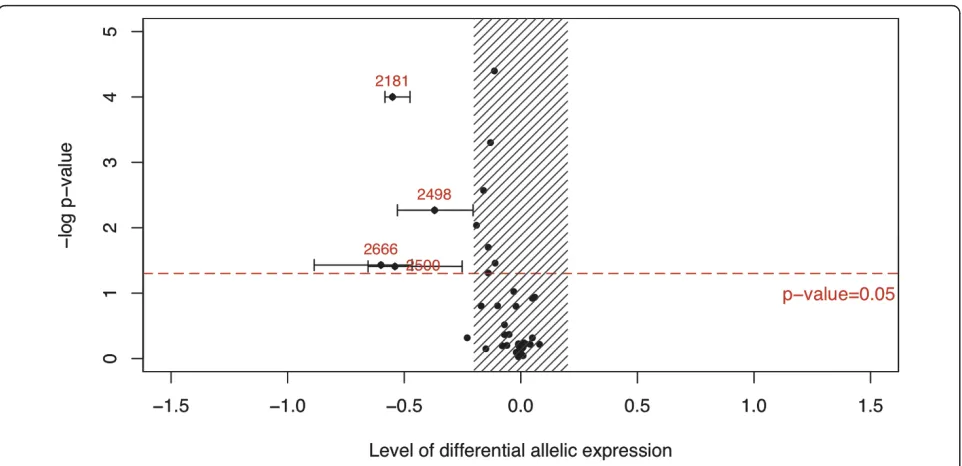
The first series of analysis using the SNP rs2236142 as marker included 32 heterozygous individuals for this coding SNP. The statistical threshold for DAE was reached in four individuals (Figure 3). Mutation screen-ing results indicated that these four patients carried the CHEK2*1100delC mutation (see Additional file 1). Observed levels of DAE varied from 37% to 60%, reveal-ing a substantial expression imbalance of an order likely to have biological importance. NMD inhibitory treat-ment on these four LCLs showed melting curves profiles tending towards the genomic curve profile, which is the reference for a 1:1 allelic ratio (Figure 4A). This con-firms previous findings that the CHEK2*1100delC muta-tion leads to allele-specific degradamuta-tion by triggering the NMD pathway [3]. None of the 28 other individuals of
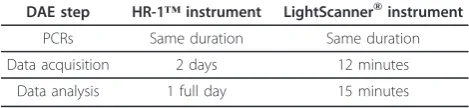
Table 1 Comparison of the duration of the DAE analysis between the HR-1™and the LightScanner®instruments, for 96 samples
DAE step HR-1™instrument LightScanner®instrument
PCRs Same duration Same duration
Data acquisition 2 days 12 minutes
Data analysis 1 full day 15 minutes
this first series showed allelic imbalance, according to our statistical criteria (Figure 4-B). The second series of analysis used SNP rs2236141 as marker and included 17 heterozygous individuals for this coding SNP. Eight of them were also heterozygous for SNP rs2236142 and had already tested negative for DAE with the first
marker. The statistical threshold for DAE was not reached in any of the remaining 9 samples (Figure 3).
Discussion
that HRM is able to detect DAE associated with NMD in LCLs carrying a non-sense mutation in CHEK2. Although no DAE was observed in the patients who do not carry the 1100delC mutation, the series investigated here was limited, and we cannot rule out thatcis -regula-tory variants in CHEK2 may lead to DAE in a tissue specific manner [24]. However, this later hypothesis could not be tested since no breast tissue was available from these patients.
The approach used in our study relies on subjects who are heterozygous for a coding SNP and allows relative quantification of allelic transcripts. This methodology has major advantages over more conventional methods for investigating DAE based on the comparison of gene
expression between individuals as discussed elsewhere [8,10,20]. Since they come from the same tissue sample and have therefore been subjected to the same environ-mental influences (such as genetictrans-acting factors and experimental exposures, including mRNA degrada-tion) both alleles should be equally expressed in the absence of cis-acting sequence variation or epigenetic effects affecting the expression of the target mRNA. Thus, the strength of this approach is that each allele acts as an internal control for confounding factors, dis-closingcis-variation effects without being confounded by anytrans-variation effects.
and LightScanner® (384-well plate format) instruments, with the format depending on the required throughput. Access to DAE assessment technology can be cost pro-hibitive for many laboratories. HRM provides a good alternative when compared to methodologies based for instance, on the use of capillary electrophoresis for sin-gle-base extension assays, such as SnapShot assays [11], allele-specific quantitative real-time PCR [12] and microarray platform [9]. Advantages offered by HRM analysis include its rapidity, cost-effectiveness and secur-ity due to its closed-tube nature. Though the HR-1™is reported to provide a better accuracy [28], both instru-ments performed well to identify the 4 carriers of the CHEK2*1100delC variant showing DAE in the absence of puromycin treatment in our study. However, given the number of samples to test, analysis with the HR-1™ instrument ended up being much more time consuming (Table 1). The results obtained with the LightScanner® instrument showed that this methodology can be applied in larger-scale studies, provided that LCL mate-rial is available, while maintaining high accuracy and remaining cost-effective. Indeed, the protocol is rela-tively inexpensive since it only requires standard PCR reagents and a small amount of fluorescent probe.
The script we developed using R computing software was made compatible with both instruments and greatly reduces the time of analysis. Once HRM data are
acquired, the normalization of the curves, peak heights measurements, ratios calculations and statistical analysis are performed automatically within less than 15 minutes for a set of 96 samples when using the LightScanner® instrument. The output consists in a summary table of the peak heights, relative allelic ratios, and the Student’s t-test values, as well as a plot on which DAE carriers are highlighted. The script can also display other information on demand, such as melting curve profiles which can be displayed for each replicate or by average of 4 replicates for each individual (see examples in Figure 3 and 4).
analysis, by generating disagreeing replicate results for instance [29].
In a DAE study, the main optimization issue is the ability to select a subset of 2-3 marker SNPs so that as many individuals as possible are heterozygous for at least one of the markers. Subsets of individuals giving the most heterozygotes at 2 loci should be chosen in order to maximize redundancy, and to self-check for error reduction. Unfortunately, in the present study, no individual heterozygous for both SNPs showed evidence of DAE. Detection of DAE in a candidate gene may be indicative of the presence of a coding or regulatory var-iant altering expression of the gene product. However, DAE-based approaches can point out the presence of a regulatory causative variant only if the subjects are
heterozygous for the causative variant (and of course for the coding SNP serving as marker). In some situations, the coding SNP used to distinguish both alleles may be itself responsible for the observed DAE, or it can be in linkage disequilibrium (LD) with it,i.e. on the same hap-lotype. In the case of no LD between the marker and the functional variant, it is still possible to map the variant, as previously reported by others [30,31].
Conclusions
by focusing discovery effort on the subset of genes that are most likely to harbour coding or regulatory variants that may alter gene expression. The approach reported here allows revealing the existence of regulatory varia-tions without directly identifying or requiring prior knowledge of specificcis-regulatory SNPs. DAE assays can also highlight the existence of epigenetic factors controlling gene expression [32].
Analysis of the relative allelic ratios of marker SNPs circumvents the issue of confounding trans-acting fac-tors. Any significant differences in these ratios support the existence of DAE and hence, cis-acting polymorph-isms determining gene expression. The primary goal of this type of study is to identify sequence variants that are likely to alter gene expression and gene product function, and thereby influence susceptibility to breast cancer. However, to demonstrate that some of these var-iants actually show disease association, large-scale epide-miological studies are required and may ultimately lead towards the identification of causal genetic factors responsible for susceptibility to disease. In the context of such high-throughput studies, instead of LCLs, one can use blood samples, a more accessible tissue than breast. Identification and elucidation of rare intermedi-ate-risk genetic variants associated with susceptibility to cancer will contribute to a better understanding of the aetiology of the disease.
Software availability
A copy of our R script code has been made available on http://Sourceforge.net.
Project name: HRMdae project;
Project home page: http://sourceforge.net/projects/ hrmdae;
Operating system(s): Platform independent, R environment;
Programming language: R v2, or above; Licence: GPL v3;
Any restrictions to use by non-academics: None.
Additional material
Additional file 1: Mutation screening results for the 41 breast cancer samples enrolled in the DAE study. Additional table showing the mutation screening results for the 41 breast cancer samples enrolled in the DAE study.
Additional file 2: Primers and probes used in the DAE study on the CHEK2gene. Additional table showing the primers and probes sequences used to perform the DAE study.
Acknowledgements
We wish to thank Heather Thorne, Eveline Niedermayr, all the kConFab research nurses and staff, the heads and staff of the Family Cancer Clinics, and the Clinical Follow Up Study (funded by NHMRC grants 145684, 288704
and 454508) for their contributions to this resource, and the many families who contribute to kConFab. kConFab is supported by grants from the National Breast Cancer Foundation, the National Health and Medical Research Council (NHMRC) and by the Queensland Cancer Fund, the Cancer Councils of New South Wales, Victoria, Tasmania and South Australia, and the Cancer Foundation of Western Australia. We gratefully acknowledge Arnaud Dumont for his help on developing the R script. TN-D was the recipient of a fellowship from Fondation de France and a Special Trainee Award from the International Agency for Research on Cancer. LPJ was the recipient of a fellowship from Ligue Contre le Cancer - Comité du Rhône. MCS is a National Health and Medical Research Council Senior Research Fellow and Victorian Breast cancer Research Consortium (VBCRC) Group Leader. This work was also supported by the Canadian Institutes of Health Research team grant CRN-87521-IC089832 and by the National Cancer Institute, National Institutes of Health (NIH) grant R01 CA121245.
Author details
1
Genetic Cancer Susceptibility Group, IARC, 69372 Lyon, France.2INSERM U590, Université Lyon 1, Lyon, France.3Peter MacCallum Cancer Center, East
Melbourne 2, VIC 3002, Australia.4Unité Mixte de Génétique
Constitutionnelle des Cancers Fréquents, Hospices Civils de Lyon, Centre Léon Bérard, 69373 Lyon, France.5Department of Pathology, The University
of Melbourne, VIC 3010, Australia.6Department of Oncological Sciences, Huntsman Cancer Institute, University of Utah, Salt Lake City, UT 84112, USA.
Authors’contributions
TN-D carried out the DAE experiments and drafted the manuscript; LPJ participated in the study design and helped to draft the manuscript; JM carried out the cell culture; NF and SM-C carried out the mutation screening; kConFab and OS provided the cell lines; FL-K participated in the
development of the laboratory workflow and helped to draft the manuscript; MCS participated in the experiment design; SVT conceived the study, participated in its design and coordination and helped to draft the manuscript. FL participated in the study coordination and helped to draft the manuscript. All authors read and approved the final manuscript.
Competing interests
The authors declare that they have no competing interests.
Received: 22 July 2010 Accepted: 11 May 2011 Published: 11 May 2011
References
Oldenburg RA, Kroeze-Jansema K, Kraan J, Morreau H, Klijn JGM,
Hoogerbrugge N, Ligtenberg MJL, van Asperen CJ, Vasen HFA, Meijers C, Meijers-Heijboer H, de Bock TH, Cornelisse CJ, Devilee P (2003) The CHEK2*1100delC variant acts as a breast cancer risk modifier in non-BRCA1/ BRCA2 multiple-case families. Cancer Res 63(23):8153–8157
Honrado E, Osorio A, Palacios J, Benitez J (2006) Pathology and gene expression of hereditary breast tumors associated with BRCA1, BRCA2 and CHEK2 gene mutations. Oncogene 25(43):5837–5845. doi:10.1038/sj.onc.1209875. Meijers-Heijboer H, van den Ouweland A, Klijn J, Wasielewski M, de Snoo A,
Oldenburg R, Hollestelle A, Houben M, Crepin E, van Veghel-Plandsoen M, Elstrodt F, van Duijn C, Bartels C, Meijers C, Schutte M, McGuffog L, Thompson D, Easton D, Sodha N, Seal S, Barfoot R, Mangion J, Chang-Claude J, Eccles D, Eeles R, Evans DG, Houlston R, Murday V, Narod S, Peretz T, Peto J, Phelan C, Zhang HX, Szabo C, Devilee P, Goldgar D, Futreal PA, Nathanson KL, Weber B, Rahman N, Stratton MR (2002) Low-penetrance susceptibility to breast cancer due to CHEK2(*)1100delC in noncarriers of BRCA1 or BRCA2 mutations. Nat Genet 31:55–59. doi:10.1038/ ng879.
CHEK2 Breast Cancer Case-Control Consortium (2004) CHEK2*1100delC and susceptibility to breast cancer: a collaborative analysis involving 10,860 breast cancer cases and 9,065 controls from 10 studies. Am J Hum Genet 74(6):1175–82
Antoni L, Sodha N, Collins I, Garrett MD (2007) CHK2 kinase: cancer susceptibility and cancer therapy - two sides of the same coin? Nat Rev Cancer 7(12):925–36. doi:10.1038/nrc2251.
Nevanlinna H, Bartek J (2006) The CHEK2 gene and inherited breast cancer susceptibility. Oncogene 25(43):5912–5919. doi:10.1038/sj.onc.1209877. Le Calvez-Kelm F, Lesueur F, Damiola F, Vallée M, Voegele C, Babikyan D,
Thomas A, Byrnes GB, Breast Cancer Family Registry, Hopper JL, Southey MC, Andrulis IL, John EM, Tavtigian SV (2011) Rare, evolutionarily unlikely missense substitutions in CHEK2 contribute to breast cancer susceptibility: results from a breast cancer family registry case-control mutation-screening study. Breast Cancer Res 13:R6. doi:10.1186/bcr2810.
Buckland PR (2004) Allele-specific gene expression differences in humans. Hum Mol Genet 13(Spec No 2):R255–60
Lo HS, Wang Z, Hu Y, Yang HH, Gere S, Buetow KH, Lee MP (2003) Allelic variation in gene expression is common in the human genome. Genome Res 13(8):1855–1862
Bray NJ, Buckland PR, Owen MJ, O’Donovan MC (2003) Cis-acting variation in the expression of a high proportion of genes in human brain. Hum Genet 113(2):149–153
Yan H, Yuan W, Velculescu VE, Vogelstein B, Kinzler KW (2002) Allelic variation in human gene expression. Science 297(5584):1143. doi:10.1126/
science.1072545.
Chen X, Weaver J, Bove BA, Vanderveer LA, Weil SC, Miron A, Daly MB, Godwin AK (2008) Allelic imbalance in BRCA1 and BRCA2 gene expression is associated with an increased breast cancer risk. Hum Mol Genet
17(9):1336–1348. doi:10.1093/hmg/ddn022.
Azzato EM, Lee AJX, Teschendorff A, Ponder BAJ, Pharoah P, Caldas C, Maia AT (2010) Common germ-line polymorphism of C1QA and breast cancer survival. Br J Cancer 102(8):1294–9. doi:10.1038/sj.bjc.6605625.
Yan H, Dobbie Z, Gruber SB, Markowitz S, Romans K, Giardiello FM, Kinzler KW, Vogelstein B (2002) Small changes in expression affect predisposition to tumorigenesis. Nat Genet 30:25–26. doi:10.1038/ng799.
Valle L, Serena-Acedo T, Liyanarachchi S, Hampel H, Comeras I, Li Z, Zeng Q, Zhang HT, Pennison MJ, Sadim M, Pasche B, Tanner SM, de la Chapelle A (2008) Germline allele-specific expression of TGFBR1 confers an increased risk of colorectal cancer. Science 321(5894):1361–5. doi:10.1126/science.1159397. Milani L, Gupta M, Andersen M, Dhar S, Fryknäs M, Isaksson A, Larsson R,
Syvänen AC (2007) Allelic imbalance in gene expression as a guide to cis-acting regulatory single nucleotide polymorphisms in cancer cells. Nucleic Acids Res 35(5):e34. doi:10.1093/nar/gkl1152.
Feinberg AP, Tycko B (2004) The history of cancer epigenetics. Nat Rev Cancer 4(2):143–53. doi:10.1038/nrc1279.
Gameau LJ, Brown LD, Moore MA, E DJ, DemYan WB (2005) Optimization of LightTyper genotyping assays. Biochemica 3
Ware MD, DeSilva D, Sinilnikova OM, Stoppa-Lyonnet D, Tavtigian SV, Mazoyer S (2006) Does nonsense-mediated mRNA decay explain the ovarian cancer cluster region of the BRCA2 gene? Oncogene 25(2):323–328
Jordheim LP, Nguyen-Dumont T, Thomas X, Dumontet C, Tavtigian SV (2008) Differential allelic expression in leukoblast from patients with acute myeloid leukemia suggests genetic regulation of CDA, DCK, NT5C2, NT5C3, and TP53. Drug Metab Dispos 36(12):2419–2423. doi:10.1124/dmd.108.023184. Schroeder A, Mueller O, Stocker S, Salowsky R, Leiber M, Gassmann M,
Lightfoot S, Menzel W, Granzow M, Ragg T (2006) The RIN: an RNA integrity number for assigning integrity values to RNA measurements. BMC Mol Biol 7:3. doi:10.1186/1471-2199-7-3.
Nguyen-Dumont T, Calvez-Kelm FL, Forey N, McKay-Chopin S, Garritano S, Gioia-Patricola L, De Silva D, Weigel R, Sangrajrang S, Lesueur F, Tavtigian SV, Breast Cancer Family Registries (BCFR), Kathleen Cuningham Foundation Consortium for Research into Familial Breast Cancer (kConFab) (2009) Description and validation of high-throughput simultaneous genotyping and mutation scanning by high-resolution melting curve analysis. Hum Mutat 30(6):884–90. doi:10.1002/humu.20949.
Tavtigian SV, Oefner PJ, Babikyan D, Hartmann A, Healey S, Le Calvez-Kelm F, Lesueur F, Byrnes GB, Chuang SC, Forey N, Feuchtinger C, Gioia L, Hall J, Hashibe M, Herte B, McKay-Chopin S, Thomas A, Vallée MP, Voegele C, Webb PM, Whiteman DC, Australian Cancer Study, Breast Cancer Family Registries (BCFR), Kathleen Cuningham Foundation Consortium for Research into Familial Aspects of Breast Cancer (kConFab), Sangrajrang S, Hopper JL, Southey MC, Andrulis IL, John EM, Chenevix-Trench G (2009) Rare, evolutionarily unlikely missense substitutions in ATM confer increased risk of breast cancer. Am J Hum Genet 85(4):427–46. doi:10.1016/j.ajhg.2009.08.018. Wilkins JM, Southam L, Price AJ, Mustafa Z, Carr A, Loughlin J (2007) Extreme
context specificity in differential allelic expression. Hum Mol Genet 16(5):537–46. doi:10.1093/hmg/ddl488.
Jekimovs CR, Chen X, Arnold J, Gatei M, Richard DJ, Spurdle AB, Khanna KK, Chenevix-Trench G, kConFab Investigators (2005) Low frequency of CHEK2 1100delC allele in Australian multiple-case breast cancer families: functional
analysis in heterozygous individuals. Br J Cancer 92(4):784–90. doi:10.1038/sj. bjc.6602381.
Anczuków O, Ware MD, Buisson M, Zetoune AB, Stoppa-Lyonnet D,
Sinilnikova OM, Mazoyer S (2008) Does the nonsense-mediated mRNA decay mechanism prevent the synthesis of truncated BRCA1, CHK2, and p53 proteins? Hum Mutat 29:65–73. doi:10.1002/humu.20590.
Conti E, Izaurralde E (2005) Nonsense-mediated mRNA decay: molecular insights and mechanistic variations across species. Curr Opin Cell Biol 17(3):316–25. doi:10.1016/j.ceb.2005.04.005.
Herrmann MG, Durtschi JD, Bromley LK, Wittwer CT, Voelkerding KV (2006) Amplicon DNA melting analysis for mutation scanning and genotyping: cross-platform comparison of instruments and dyes. Clin Chem 52(3):494–503. doi:10.1373/clinchem.2005.063438.
Pastinen T, Sladek R, Gurd S, Sammak A, Ge B, Lepage P, Lavergne K, Villeneuve A, Gaudin T, Brandstrom H, Beck A, Verner A, Kingsley J, Harmsen E, Labuda D, Morgan K, Vohl MC, Naumova AK, Sinnett D, Hudson TJ (2004) A survey of genetic and epigenetic variation affecting human gene expression. Physiol Genomics 16(2):184–193
Pastinen T, Ge B, Gurd S, Gaudin T, Dore C, Lemire M, Lepage P, Harmsen E, Hudson TJ (2005) Mapping common regulatory variants to human haplotypes. Hum Mol Genet 14(24):3963–71. doi:10.1093/hmg/ddi420. Fogarty MP, Xiao R, Prokunina-Olsson L, Scott LJ, Mohlke KL (2010) Allelic
expression imbalance at high-density lipoprotein cholesterol locus MMAB-MVK. Hum Mol Genet 19(10):1921–9. doi:10.1093/hmg/ddq067.
Pinsonneault JK, Papp AC, Sadee W (2006) Allelic mRNA expression of X-linked monoamine oxidase a (MAOA) in human brain: dissection of epigenetic and genetic factors. Hum Mol Genet 15(17):2636–2649. doi:10.1093/hmg/ddl192.
Pre-publication history
The pre-publication history for this paper can be accessed here: http://www.biomedcentral.com/1755-8794/4/39/prepub
doi:10.1186/1755-8794-4-39
Cite this article as:Nguyen-Dumontet al.:Detecting differential allelic expression using high-resolution melting curve analysis: application to the breast cancer susceptibility gene CHEK2.BMC Medical Genomics2011
4:39.
Submit your next manuscript to BioMed Central and take full advantage of:
• Convenient online submission
• Thorough peer review
• No space constraints or color figure charges
• Immediate publication on acceptance
• Inclusion in PubMed, CAS, Scopus and Google Scholar
• Research which is freely available for redistribution