CIVIL ENGINEERING STUDIES
Illinois Center for Transportation Series No. 18-014 UILU-ENG-2018-2014
ISSN: 0197-9191
SEISMIC PERFORMANCE OF
INTEGRAL ABUTMENT HIGHWAY
BRIDGES IN ILLINOIS
Prepared By
James M. LaFave Larry A. Fahnestock
Derek L. Kozak
University of Illinois at Urbana-Champaign
Research Report No. FHWA-ICT-18-012
A report of the findings of
ICT PROJECT R27-133
Calibration and Refinement of Illinois’ Earthquake Resisting System Bridge
Design Methodology: Phase II
Illinois Center for Transportation
August 2018
TECHNICAL REPORT DOCUMENTATION PAGE
1. Report No.
FHWA-ICT-18-012 2. Government Accession No. N/A 3. Recipient’s Catalog No. N/A
4. Title and Subtitle
Seismic Performance of Integral Abutment Highway Bridges in Illinois 5. Report Date August 2018
6. Performing Organization Code
N/A
7. Author(s)
James M. LaFave, Larry A. Fahnestock, and Derek L. Kozak 8. Performing Organization Report No. ICT-18-014 UILU-ENG-2018-2014
9. Performing Organization Name and Address
Illinois Center for Transportation
Department of Civil and Environmental Engineering University of Illinois at Urbana-Champaign
205 North Mathews Avenue, MC-250 Urbana, IL 61801
10. Work Unit No.
N/A
11. Contract or Grant No.
R27-133
12. Sponsoring Agency Name and Address
Illinois Department of Transportation (SPR) Bureau of Research
126 East Ash Street Springfield, IL 62704
13. Type of Report and Period Covered
Final Report
10/1/2013 – 8/31/2018
14. Sponsoring Agency Code
FHWA
15. Supplementary Notes
Conducted in cooperation with the U.S. Department of Transportation, Federal Highway Administration.
16. Abstract
The seismic behavior of integral abutment bridges (IABs) is of particular interest in southern Illinois, where proximity to the New Madrid Seismic Zone may create significant ground motion accelerations during an earthquake. IABs are common in modern bridge construction due to their lack of expansion joints between the superstructure and abutment, which leads to decreased environmental damage at the abutment seat when compared to stub abutment bridges. However, elimination of expansion joints can also lead to development of complex soil-structure-interaction limit states at the abutment and its foundation when an IAB is subjected to lateral loads. This report examines the seismic behavior of typical IABs in southern Illinois and develops feedback and recommendations for improving IAB seismic designs. This is accomplished through modeling IABs as a whole bridge system, subjecting the models to representative ground motions, monitoring the behavior of key IAB components, using the monitored results to form a comprehensive view of seismic behavior, and employing the developed knowledge to form
recommendations for improving IAB seismic performance. IAB models are developed in OpenSees through nonlinear modeling of multiple components, as well as the connections between components, representing typical IAB designs for Illinois, and are then subjected to 1000-year return period hazard ground motions developed specifically for southern Illinois. Incremental dynamic analyses are also performed. IABs of varying superstructure materials, span configurations, bearing layouts, pier heights, and foundation soil conditions are dynamically analyzed using the sets of developed ground motions. Damage to pier columns is especially prominent in IABs with shorter piers and longer abutment-to-abutment spans, while abutment foundation damage in terms of yielding, local buckling, and rupture of the piles frequently occurs in many IAB variants. Recommendations on design modifications to improve the seismic behavior of IABs by limiting the level of damage to these components are also investigated through modifying elastomeric bearing side retainer strength, fixed bearing strength, pier column size, and backfill contributions.
17. Key Words
Jointless bridges; abutment pile foundations; multi-column piers; soil structure interaction; earthquake engineering; bridge bearings; quasi-isolation.
18. Distribution Statement
No restrictions. This document is available through the National Technical Information Service, Springfield, VA 22161.
19. Security Classif. (of this report)
Unclassified
20. Security Classif. (of this page)
Unclassified 21. No. of Pages 85 pp + appendices 22. Price N/A
i
ACKNOWLEDGMENT, DISCLAIMER, MANUFACTURERS’ NAMES
This publication is based on the results of ICT-R27-133, Calibration and Refinement of Illinois’ Earthquake Resisting System Bridge Design Methodology: Phase II. ICT-R27-133 was conducted in cooperation with the Illinois Center for Transportation (ICT); the Illinois Department of Transportation (IDOT); and the U.S. Department of Transportation, Federal Highway Administration (FHWA).
Members of the Technical Review panel were the following:
• Mark Shaffer, TRP Chair, IDOT
• Nick Barnett, IDOT
• Justin Belue, IDOT
• Dan Brydl, FHWA
• John Ciccone, IDOT
• Patrik Claussen, IDOT
• Chad Hodel, WHKS
• William Kramer, IDOT
• Carl Puzey, IDOT
• Kevin Riechers, IDOT
• Jayme Schiff, IDOT
• Dan Tobias, IDOT
The contents of this report reflect the view of the author(s), who is (are) responsible for the facts and the accuracy of the data presented herein. The contents do not necessarily reflect the official views or policies of the Illinois Center for Transportation, the Illinois Department of Transportation, or the Federal Highway Administration. This report does not constitute a standard, specification, or regulation.
Trademark or manufacturers’ names appear in this report only because they are considered essential to the object of this document and do not constitute an endorsement of product by the Federal Highway Administration, the Illinois Department of Transportation, or the Illinois Center for Transportation.
ii
EXECUTIVE SUMMARY
The increased use of integral abutment bridges (IABs) throughout the United States has led to numerous studies concerning their behavior when subjected to a variety of loads. The seismic behavior of IABs is of particular interest to regions such as southern Illinois, where proximity to the New Madrid Seismic Zone may create significant ground motion accelerations during an earthquake. IABs are common in modern bridge design and construction due to their lack of expansion joints between the superstructure and abutment, which leads to decreased damage at the abutment seat when compared to stub abutment bridges because water, soil, and deicing chemicals are unable to penetrate through a compromised expansion joint in an IAB. However, elimination of expansion joints in IABs can also lead to the development of complex soil-structure-interaction limit states at the abutment and its foundation when an IAB is subjected to lateral loads. Despite this distinct behavior in IABs when subjected to lateral loading, such as seismic loads, there is a lack of
comprehensive system-level studies investigating the behavior of IABs subjected to earthquakes. This report aims to determine the seismic behavior of typical IAB designs in southern Illinois and to develop feedback and recommendations that can improve Illinois IAB seismic designs. This is accomplished through modeling IABs as a whole bridge system, subjecting the IAB models to
representative ground motions for southern Illinois, monitoring the behavior of key IAB components, using the monitored results to form a comprehensive view of IAB seismic behavior, and employing the developed knowledge to form recommendations for improving IAB seismic performance. The IAB models are developed in OpenSees through nonlinear modeling of multiple components within an IAB, as well as through connections between the components that allow for their interactions to be observed. The models represent typical IAB designs for Illinois. They are subjected to 1000-year return period hazard ground motions developed specifically for 10 sites within southern Illinois. Incremental dynamic analyses are also performed, by scaling the ground motion accelerations up and down.
IABs of varying superstructure materials, span configurations, bearing layouts, pier heights, and foundation soil conditions are dynamically analyzed using the 10 sets of developed ground motions. The results allow for observations and conclusions to be made concerning the overall seismic
performance of current Illinois IAB designs, as well as about which components are the most
vulnerable to damage during an earthquake. The abutment foundation piles and the pier columns are identified as most vulnerable and frequently encounter severe damage limit states under design-level shaking. Damage to pier columns is especially prominent in IABs with shorter piers and longer
abutment-to-abutment spans, while abutment foundation damage, in terms of the yielding, local buckling, and rupture of the piles, frequently occurs in many IAB variants. Recommendations on design modifications to improve the seismic behavior of IABs by limiting the level of damage to these components are also investigated through modifying elastomeric bearing side retainer strength, fixed bearing strength, pier column size, and backfill contributions.
iii
TABLE OF CONTENTS
CHAPTER 1: BACKGROUND ... 1 1.1 MOTIVATION ...1 1.2 REPORT ORGANIZATION ...2 1.3 LITERATURE REVIEW ...31.3.1 Stub Abutment Bridge Seismic Behavior and Models ………. 3
1.3.2 Integral Abutment Bridge Studies and Modeling ……….. 4
CHAPTER 2: MODELING OF INTEGRAL ABUTMENT BRIDGES ... 7
2.1 OVERVIEW OF PROTOTYPE INTEGRAL ABUTMENT BRIDGES ...6
2.1.1 Parametric Variations ……… 8
2.1.2 Integral Abutment Bridge Details ……….. 10
2.2 INTEGRAL ABUTMENT BRIDGE MODELING ... 10
2.2.1 Integral Abutment Bridge Model Description ……….. 10
2.2.2 Integral Abutment Component Models ……… 12
2.2.3 Non-Abutment Component Models ……… 17
2.2.4 Limit States ……….……….. 21
CHAPTER 3: DYNAMIC ANALYSIS ... 24
3.1 DYNAMIC ANALYSIS PROCEDURE ... 24
3.2 GROUND MOTION TIME HISTORIES ... 25
3.2.1 Formation of Soil Profiles in Southern Illinois ……….. 22
3.2.2 Conditional Mean Spectrum Development ……… 23
3.2.3 Matching Existing Ground Motions to the CMS ………. 24
3.2.4 Surface Level Ground Motions ……….. 25
3.3 SAMPLE DESIGN-LEVEL DYNAMIC ANALYSIS RESULTS ... 27
3.4 SAMPLE INCREMENTAL DYNAMIC ANALYSIS RESULTS ... 31
CHAPTER 4: PARAMETRIC STUDY RESULTS ... 34
4.1 SINGLE-SPAN STEEL IABS ... 34
4.1.1 Design-Level Dynamic Analysis Results ……….. 34
iv
4.2 THREE-SPAN STEEL IABS ... 36
4.2.1 Design-Level Dynamic Analysis Results ……….. 36
4.2.2 Incremental Dynamic Analysis Results ………. 39
4.3 FOUR-SPAN STEEL IABS ... 42
4.3.1 Design-Level Dynamic Analysis Results ……….. 42
4.3.2 Incremental Dynamic Analysis Results ……… 44
4.4 THREE-SPAN CONCRETE IABS ... 48
4.4.1 Design-Level Dynamic Analysis Results ……….. 48
4.4.2 Incremental Dynamic Analysis Results ……… 51
4.5 FOUR-SPAN CONCRETE IABS ... 54
4.5.1 Design-Level Dynamic Analysis Results ……….. 54
4.5.2 Incremental Dynamic Analysis Results ……… 56
4.6 VARIATION OF GROUND MOTION INTENSITY ... 60
4.6.1 Design-Level Dynamic Analysis Results for ClC15EA ………. 62
4.7 OVERALL OBSERVATIONS ... 64
CHAPTER 5: RECOMMENDATIONS FOR DESIGN ENHANCEMENTS ... 67
5.1 REDUCTION IN RETAINER USE ... 67
5.2 REDUCTION IN FIXED BEARING RESISTANCE ... 69
5.3 STRENGTHENING OF PIER COLUMNS ... 71
5.4 INCREASED BACKFILL CONTRIBUTION ... 73
5.5 RECOMMENDATIONS ... 75
CHAPTER 6: CONCLUSIONS ... 78
6.1 OVERVIEW ... 78
6.2 DESIGN RECOMMENDATIONS ... 79
6.2.1 Recommendation Applicability ……… 79
6.3 RECOMMENDATIONS FOR FURTHER RESEARCH ... 80
REFERENCES ... 82
APPENDIX A PROTOTYPE IAB SUPERSTRUCTURE PROPERTIES ... 86
v
APPENDIX C DESIGN-LEVEL DYNAMIC ANALYSIS DATA ... 116
APPENDIX D INCREMENTAL DYNAMIC ANALYSIS DATA ... 137
vi
LIST OF FIGURES
Figure 1.1: Representative diagram of (a) a stub abutment (IDOT, 2012a); (b) an integral abutment (IDOT, 2012b) ………………..……….………………..………5 Figure 2.1: Bridge model naming convention………………..………7 Figure 2.2: Diagram of the three-span IAB configuration considered in the parametric study……….8 Figure 2.3: (a) Diagram of a typical three-span steel IAB, and (b) The representative OpenSees model for that three-span IAB………………..……….………………..…….12 Figure 2.4: Model representation of an integral abutment………………..………….13 Figure 2.5: Sample cyclic behavior for the overall behavior at the pile cap-abutment interface………..14 Figure 2.6: Model representation of the components included in the abutment foundations…………..15 Figure 2.7: (a) Discretization of the pile cross-section, and (b) Discretization of the pile elements along their length………………..……….………………..………16 Figure 2.8: Example zero-length spring behavior for (a) cyclic p-y springs, and (b) cyclic t-z springs….17 Figure 2.9: Location of non-integral abutment components modeled in an overall IAB model………….18 Figure 2.10: (a) Diagram of the superstructure cross-section, and (b) Representative model of the superstructure cross-section with masses………………..………18 Figure 2.11: Sample (a) Type I elastomeric bearing cyclic behavior, and (b) side retainer cyclic
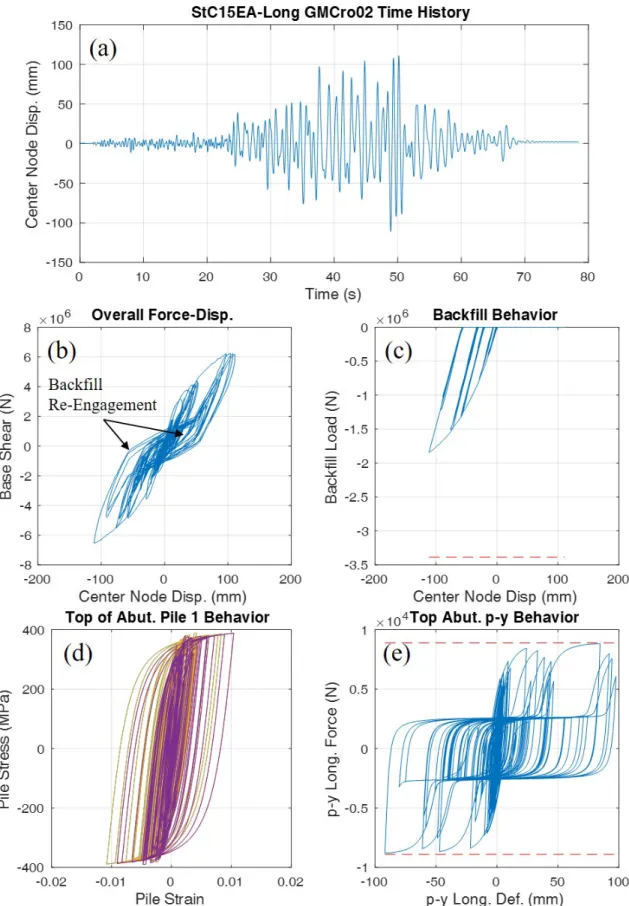
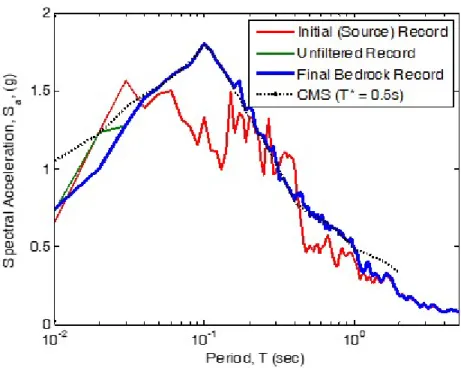
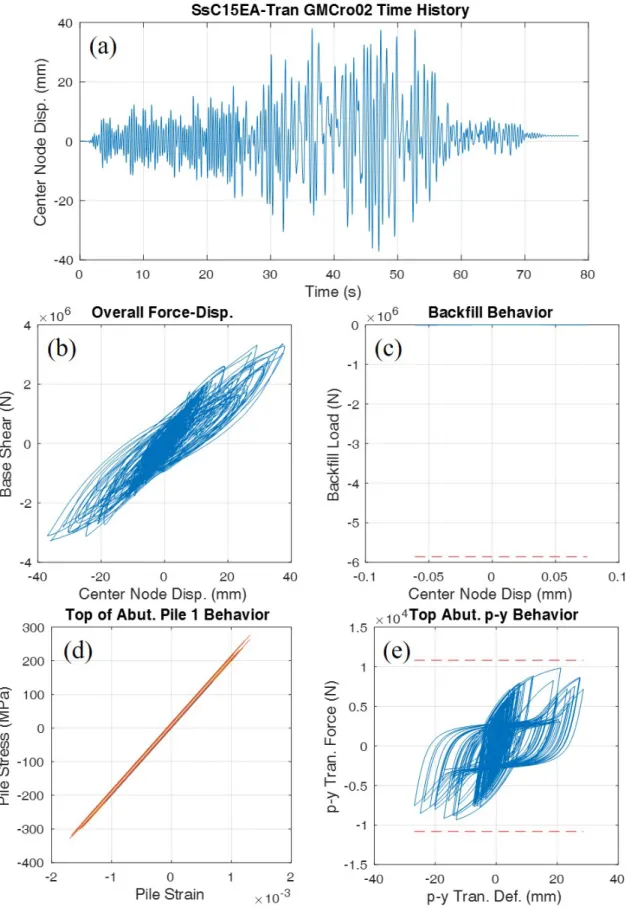
behavior………………..……….………………..……….……….19 Figure 2.12: Sample cyclic low-profile fixed bearing behavior (not including the frictional contribution) for a bearing using 1.25-in. diameter steel anchor bolts………………..………20 Figure 3.1: Final ground motion spectra for Cairo………………..………..…25 Figure 3.2: Dynamic analysis results for StC15EA subjected to a design-level ground motion in the longitudinal direction………………..……….………………..……….28
vii
Figure 3.3: Dynamic analysis results for StC15EA subjected to a design-level ground motion in the transverse direction………………..……….………………..…………29 Figure 3.4: IDA plots for three-span steel IABs in the transverse direction, where a scale factor of 1.00 represents the design-level………………..……….………………..31 Figure 4.1: Sequences of damage for single-span steel IABs, where a scale factor of 1.00 represents the design-level………………..……….………………..……….34 Figure 4.2: Center node displacement time history of CtC15EA subjected to a longitudinal design-level ground motion………..……….………..………..48 Figure 4.3: Center node displacement-base shear behavior of CtC15EA subjected to a longitudinal design-level ground motion………..……….………48 Figure 5.1: Transverse IDA results for the (a) maximum retainer load; and (b) maximum pier column concrete strain in the original and enhanced StC40EA. The dashed lines represent ideal (green), acceptable (yellow), and unacceptable (red) limit state values for the component………..68 Figure 5.2: Transverse IDA results for the (a) maximum retainer load; and (b) maximum pier column concrete strain in the original and enhanced SlC15EA. The dashed lines represent ideal (green), acceptable (yellow), and unacceptable (red) limit state values for the component………..69 Figure 5.3: Transverse IDA results for the (a) maximum fixed bearing load; and (b) maximum pier column concrete strain in the original and enhanced StC40FA. The dashed lines represent ideal
(green), acceptable (yellow), and unacceptable (red) limit state values for the component………70 Figure 5.4: Transverse IDA results for the (a) maximum fixed bearing load; and (b) maximum pier column concrete strain in the original and enhanced SlC15FA. The dashed lines represent ideal
(green), acceptable (yellow), and unacceptable (red) limit state values for the component………71 Figure 5.5: Longitudinal IDA results for the maximum base shear in the original and enhanced
CtC15EA………………..……….………………..………..72 Figure 5.6: Transverse IDA results for the (a) maximum pier column concrete strain; and (b) maximum base shear in the original and enhanced CtC15EA. The dashed lines represent ideal (green),
acceptable (yellow), and unacceptable (red) limit state values for the component………..72 Figure 5.7: Longitudinal IDA results for the (a) maximum pier column concrete strain; and (b)
maximum base shear in the original and enhanced ClC15EA. The dashed lines represent ideal (green), acceptable (yellow), and unacceptable (red) limit state values for the component………..73
viii
Figure 5.8: Transverse IDA results for the (a) maximum retainer load, (b) maximum pier column concrete strain, and (c) maximum abutment pile strain normalized to the yield strain in the original and enhanced ClC15EA. The dashed lines represent ideal (green), acceptable (yellow), and
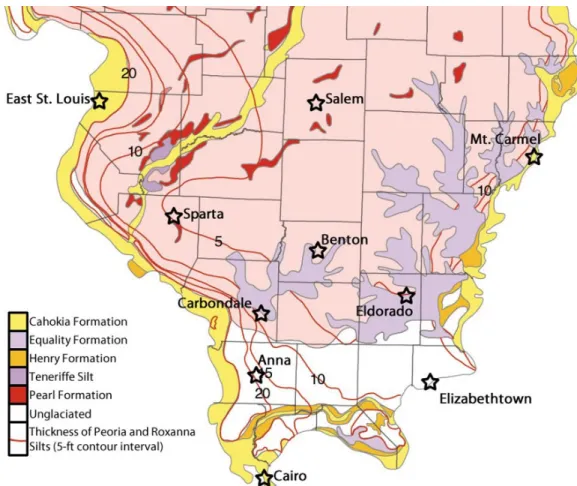
unacceptable (red) limit state values for the component………………..……….73 Figure 5.9: Original and revised abutment pile cap designs………………..………….74 Figure B.1: Location of sites in southern Illinois overlaid on the Quaternary (ice age) deposits map for the region (ISGS, 2005)……….……….90 Figure B.2: Individual shear wave velocity profiles, average shear wave velocity profiles, and the bounds formed by being one standard deviation from the average for the upper 30 m of (a) the alluvial geology, and (b) the non-alluvial geology……….…………..92 Figure B.3: Shear wave velocity profiles for (a) Cairo, which uses the alluvial profile for the top 30 m and the lowland profile for deeper than 30 m; and (b) Anna, which uses the non-alluvial profile for the top 30 m and the upland profile for deeper than 30 m………..………..93 Figure B.4: Smoothed shear wave velocity profiles for (a) alluvial sites and (b) non-alluvial
sites……….…………..….94 Figure B.5: Hazard deaggregation results for (a) Cairo, and (b) East St. Louis (USGS, 2008)………….…..97 Figure B.6: UHS, CMS, and median spectra for a conditional period of 0.5 s at (a) Cairo, and (b) East St. Louis………..98 Figure B.7: CMS and UHS for alluvial sites (a) Benton, (b) Cairo, (c) East St. Louis, (d) Mt. Carmel, (e) Salem, and (f) Sparta……….……….99 Figure B.8: CMS and UHS for non-alluvial sites (a) Anna, (b) Carbondale, (c) Eldorado, and (d)
Elizabethtown……….…….100 Figure B.9: Sample spectra for matching the TCU-089-W source record from the NUREG/CR6728 database (McGuire et al., 2001) to the T* = 0.5 s CMS for Cairo……….………103 Figure B.10: Bedrock ground motion spectra for Cairo matched to the (a) T* = 0.2 s CMS, (b) T* = 0.3 s CMS, (c) T* = 0.5 s CMS, (d) T* = 1.0 s CMS, and (e) T* = 2.0 s CMS……….………105 Figure B.11: Bedrock ground motion spectra for the alluvial sites (a) Benton, (b) Cairo, (c) East St. Louis, (d) Mt. Carmel, (e) Salem, and (f) Sparta………..…….…..106 Figure B.12: Bedrock ground motion spectra for the non-alluvial sites (a) Anna, (b) Carbondale, (c) Eldorado, and (d) Elizabethtown………107
ix
Figure B.13: Comparison of acceleration time histories of a ground motion developed for Cairo at the (a) bedrock level and (b) surface level. (c) The effect of ground motions propagation through the soil in the spectral domain………..….…..108 Figure B.14: Final ground motion spectra for the alluvial sites (a) Benton, (b) Cairo, (c) East St. Louis, (d) Mt. Carmel, (e) Salem, and (f) Sparta………..………109 Figure B.15: Final ground motion spectra for the non-alluvial sites (a) Anna, (b) Carbondale, (c)
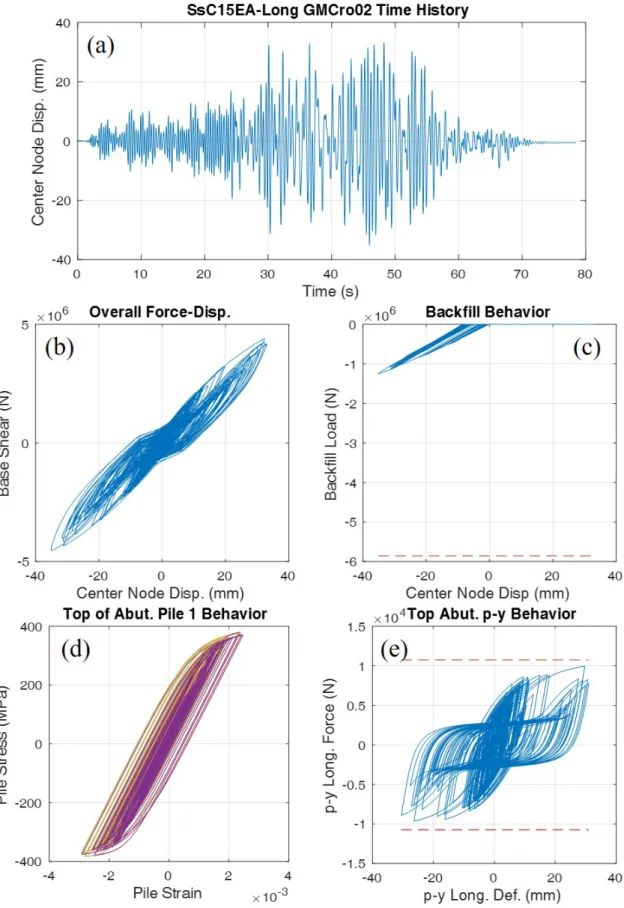
Eldorado, and (d) Elizabethtown……….…110 Figure B.16: Average of the surface level ground motions that were matched to each CMS at the bedrock level for (a) Cairo, and (b) East St. Louis………..……….…111 Figure C.1: Dynamic analysis results for Ss____A subjected to a design-level ground motion in the longitudinal direction………..……….………….127 Figure C.2: Dynamic analysis results for Ss____A subjected to a design-level ground motion in the transverse direction…………..……….………128 Figure C.3: Dynamic analysis results for StC15EA subjected to a design-level ground motion in the longitudinal direction…………..……….………129 Figure C.4: Dynamic analysis results for StC15EA subjected to a design-level ground motion in the transverse direction…………..……….………..130 Figure C.5: Dynamic analysis results for SlC15EA subjected to a design-level ground motion in the longitudinal direction…………..……….………131 Figure C.6: Dynamic analysis results for SlC15EA subjected to a design-level ground motion in the transverse direction…………..……….………..132 Figure C.7: Dynamic analysis results for CtC15EA subjected to a design-level ground motion in the longitudinal
direction…………..……….………133 Figure C.8: Dynamic analysis results for CtC15EA subjected to a design-level ground motion in the transverse
direction…………..……….………134 Figure C.9: Dynamic analysis results for ClC15EA subjected to a design-level ground motion in the longitudinal
x
Figure C.10: Dynamic analysis results for ClC15EA subjected to a design-level ground motion in the transverse
direction………..……….…………136 Figure D.1: IDA plots for single-span steel IABs in the longitudinal direction where a scale factor of 1.00 represents the design-level…………..……….……….140 Figure D.2: IDA plots for single-span steel IABs in the transverse direction where a scale factor of 1.00 represents the design-level…………..……….………141 Figure D.3: Sequences of damage for single-span steel IABs where a scale factor of 1.00 represents the design-level…………..……….……….142 Figure D.4: IDA plots for three-span steel IABs in the longitudinal direction where a scale factor of 1.00 represents the design-level…………..……….……….145 Figure D.5: IDA plots for three-span steel IABs in the transverse direction where a scale factor of 1.00 represents the design-level…………..……….………..146 Figure D.6: Sequences of damage for three-span steel IABs where a scale factor of 1.00 represents the design-level…………..……….……….147 Figure D.7: IDA plots for four-span steel IABs in the longitudinal direction where a scale factor of 1.00 represents the design-level…………..……….………..151 Figure D.8: IDA plots for four-span steel IABs in the transverse direction where a scale factor of 1.00 represents the design-level…………..……….………..152 Figure D.9: Sequences of damage for four-span steel IABs where a scale factor of 1.00 represents the design-level…………..……….……….153 Figure D.10: IDA plots for three-span concrete IABs in the longitudinal direction where a scale factor of 1.00 represents the design-level…………..……….……….156 Figure D.11: IDA plots for three-span concrete IABs in the transverse direction where a scale factor of 1.00 represents the design-level…………..……….………157 Figure D.12: Sequences of damage for three-span concrete IABs where a scale factor of 1.00
xi
Figure D.13: IDA plots for four-span concrete IABs in the longitudinal direction where a scale factor of 1.00 represents the design-level…………..……….………..161 Figure D.14: IDA plots for four-span concrete IABs in the transverse direction where a scale factor of 1.00 represents the design-level………..……….………..162 Figure D.15: Sequences of damage for four-span concrete IABs where a scale factor of 1.00
represents the design-level………..……….………..…163 Figure E.1: IDA plots for the original and enhanced StC40EA in the transverse direction where a scale factor of 1.00 represents the design-level……………..……….……….………169 Figure E.2: IDA plots for the original and enhanced SlC15EA in the transverse direction where a scale factor of 1.00 represents the design-level……………..……….……….………170 Figure E.3: Sequences of damage for the IABs with various retainer configurations where a scale factor of 1.00 represents the design-level……………..……….……….…………171 Figure E.4: IDA plots for the original and enhanced StC40FA in the transverse direction where a scale factor of 1.00 represents the design-level……………..……….………174 Figure E.5: IDA plots for the original and enhanced SlC15FA in the transverse direction where a scale factor of 1.00 represents the design-level……………..……….………175 Figure E.6: Sequences of damage for the IABs with various fixed bearing anchor bolt sizes where a scale factor of 1.00 represents the design-level……………..……….………..176 Figure E.7: IDA plots for the original and enhanced CtC15EA in the longitudinal direction where a scale factor of 1.00 represents the design-level……………..……….………179 Figure E.8: IDA plots for the original and enhanced CtC15EA in the transverse direction where a scale factor of 1.00 represents the design-level……………..……….………180 Figure E.9: IDA plots for the original and enhanced ClC15EA in the longitudinal direction where a scale factor of 1.00 represents the design-level……………..……….………181 Figure E.10: IDA plots for the original and enhanced ClC15EA in the transverse direction where a scale factor of 1.00 represents the design-level……………..……….………182 Figure E.11: Sequences of damage for the IABs with various pier column designs where a scale factor of 1.00 represents the design-level……………..……….………..183
xii
Figure E.12: IDA plots for the original and enhanced CtC40EA in the longitudinal direction where a scale factor of 1.00 represents the design-level……………..……….………..186 Figure E.13: IDA plots for the original and enhanced ClC40EA in the longitudinal direction where a scale factor of 1.00 represents the design-level……………..……….………..187 Figure E.14: Sequences of damage for the IABs with various abutment pile cap designs where a scale factor of 1.00 represents the design-level……………..……….………188
xiii
LIST OF TABLES
Table 2.1: Matrix of IABs Analyzed in the Parametric Study…………..………..………..7
Table 2.2: Basic Design Details for the IAB Parametric Study…………..………..……….11
Table 2.3: IAB Model Limit States..………..………..………..………..21
Table 2.4: Corresponding Strain Values for Pier Column Limit States………..………..…..…22
Table 3.1: Frequency of Limit State Occurrences for StC15EA Under Design-Level Ground Motions…26 Table 3.2: Frequency of Limit State Occurrences for the IDA of StC15EA in the Transverse Direction, Where a Scale Factor of 1.00 Represents the Design-Level…………..………..……….30
Table 4.1: Frequency of Limit State Occurrences for Single-Span Steel IABs Under the Design-Level Ground Motion Suite………..………..………..………..………..……..32
Table 4.2: Frequency of Limit State Occurrences for the IDA of Single-Span Steel IABs, Where a Scale Factor of 1.00 Represents the Design-Level………..………..………..………...34
Table 4.3: Frequency of Limit State Occurrences for Three-Span Steel IABs Under the Design-Level Ground Motion Suite………..………..………..………..………..…..…37
Table 4.4: Frequency of Limit State Occurrences for the IDA of Three-Span Steel IABs With 15-ft Tall Piers, Where a Scale Factor of 1.00 Represents the Design-Level………..………..…………..39
Table 4.5: Frequency of Limit State Occurrences for the IDA of Three-Span Steel IABs With 40-ft Tall Piers, Where a Scale Factor of 1.00 Represents the Design-Level………..………..……………40
Table 4.6: Frequency of Limit State Occurrences for Four-Span Steel IABs Under the Design-Level Ground Motion Suite………..………..………..………..………..…..…42
Table 4.7: Frequency of Limit State Occurrences for the IDA of Four-Span Steel IABs With 15-ft Tall Piers, Where a Scale Factor of 1.00 Represents the Design-Level………..………..……………45
Table 4.8: Frequency of Limit State Occurrences for the IDA of Four-Span Steel IABs With 40-ft Tall Piers, Where a Scale Factor of 1.00 Represents the Design-Level………..………..……………46
Table 4.9: Frequency of Limit State Occurrences for Three-Span Concrete IABs Under the Design-Level Ground Motion Suite………..………..………..………..………..…..…49
Table 4.10: Frequency of Limit State Occurrences for the IDA of Three-Span Concrete IABs With 15-ft Tall Piers, Where a Scale Factor of 1.00 Represents the Design-Level………..………..….…51
xiv
Table 4.11: Frequency of Limit State Occurrences for the IDA of Three-Span Concrete IABs With 40-ft
Tall Piers, Where a Scale Factor of 1.00 Represents the Design-Level………..………..….…52
Table 4.12: Frequency of Limit State Occurrences for Four-Span Concrete IABs Under the Design-Level Ground Motion Suite………..………..………..………..………..…..…54
Table 4.13: Frequency of Limit State Occurrences for the IDA of Four-Span Concrete IABs With 15-ft Tall Piers, Where a Scale Factor of 1.00 Represents the Design-Level………..………..….…57
Table 4.14: Frequency of Limit State Occurrences for the IDA of Four-Span Concrete IABs With 40-ft Tall Piers, Where a Scale Factor of 1.00 Represents the Design-Level………..…………58
Table 4.15: Statistics for the Peak Acceleration Values, amax, in the Sets of 20 Ground Motions at Each Southern Illinois Site………..………..………..………..………..………59
Table 4.16: Site, Characteristics Related to Seismic Performance Zone, Latitude, and Median Peak Acceleration Values………..………..………..………..………..……..…60
Table 4.17: Frequency of Limit State Occurrences During Dynamic Analyses at the Design-Level for Four-Span Concrete IABs Across the Southern Illinois Sites………..………..…………62
Table 5.1: Frequency of Transverse Limit State Occurrences Between Various CtC15EA Designs……..76
Table A.1: Detailed Steel Superstructure Information Used for Bridge Modeling………..87
Table A.2: Detailed Concrete Superstructure Information Used for Bridge Modeling……….88
Table B.1: Location of Sites in Southern Illinois………89
Table C.1: Organization of Figures in Appendix C………….……116
Table C.2: Frequency of Limit State Occurrences for Single-Span Steel IABs Under Design-Level Ground Motion Suite…………..……….117
Table C.3: Frequency of Limit State Occurrences for Three-Span Steel IABs Under Design-Level Ground Motion Suite…………..……….118
Table C.4: Frequency of Limit State Occurrences for Four-Span Steel IABs Under Design-Level Ground Motion Suite…………..……….119
Table C.5: Frequency of Limit State Occurrences for Three-Span Concrete IABs Under Design-Level Ground Motion Suite…………..……….120
xv
Table C.6: Frequency of Limit State Occurrences for Four-Span Concrete IABs Under Design-Level Ground Motion
Suite…………..……….121 Table C.7: Frequency of Limit State Occurrences During Dynamic Analyses at the Design-Level for Single-Span Steel IABs Across the Southern Illinois
Sites…………..………..122 Table C.8: Frequency of Limit State Occurrences During Dynamic Analyses at the Design-Level for Three-Span Steel Labs Across the Southern Illinois Sites………….123 Table C.9: Frequency of Limit State Occurrences During Dynamic Analyses at the Design-Level for Four-Span Steel Labs Across the Southern Illinois Sites…………...124 Table C.10: Frequency of Limit State Occurrences During Dynamic Analyses at the Design-Level for Three-Span Concrete Labs Across the Southern Illinois Sites…………125 Table C.11: Frequency of Limit State Occurrences During Dynamic Analyses at the Design-Level for Four-Span Concrete Labs Across the Southern Illinois Sites…………..126 Table D.1: Organization of Figures in Appendix D………….………138 Table D.2: Frequency of Limit State Occurrences for the Ida of Single-Span Steel Iabs Where a Scale Factor of 1.00 Represents the Design-Level………….………..……….139 Table D.3: Frequency of Limit State Occurrences for the Ida of Three-Span Steel IABs With 15-Ft Tall Piers Where a Scale Factor of 1.00 Represents the Design-Level…………143 Table D.4: Frequency of Limit State Occurrences for the Ida of Three-Span Steel IABs With 40-Ft Tall Piers Where a Scale Factor of 1.00 Represents the Design-Level…………144 Table D.5: Frequency of Limit State Occurrences for the Ida of Four-Span Steel IABs With 15-Ft Tall Piers Where a Scale Factor of 1.00 Represents the Design-Level…………..148 Table D.6: Frequency of Limit State Occurrences for the Ida of Four-Span Steel IABs With 40-Ft Tall Piers Where a Scale Factor Of 1.00 Represents the Design-Level…………..149 Table D.7: Frequency of Limit State Occurrences for the Ida of Three-Span Concrete IABs With 15-Ft Tall Piers Where a Scale Factor of 1.00 Represents the Design-Level………….154 Table D.8: Frequency of Limit State Occurrences for the Ida of Three-Span Concrete IABs With 40-Ft Tall Piers Where a Scale Factor of 1.00 Represents the Design-Level………….155 Table D.9: Frequency of Limit State Occurrences for the Ida of Four-Span Concrete IABs With 15-Ft Tall Piers Where a Scale Factor of 1.00 Represents the Design-Level………….159
xvi
Table D.10: Frequency of Limit State Occurrences for the Ida of Four-Span Concrete IABs With 40-Ft Tall Piers Where a Scale Factor of 1.00 Represents the Design-Level………….160 Table E.1: Organization of Figures in Appendix E……………..164 Table E.2: Frequency of Limit State Occurrences for the Stc40ea Ida With Various Retainer
Configurations Where a Scale Factor of 1.00 Represents the Design-Level……………..……..165 Table E.3: Frequency of Limit State Occurrences for the Slc15ea Ida With Various Retainer
Configurations Where a Scale Factor of 1.00 Represents the Design-Level……………..………..167 Table E.4: Frequency of Limit State Occurrences for the Slc15ea Ida With 8 Retainers per Pier and 2 Weakened Retainers per Pier Where a Scale Factor of 1.00 Represents the Design-Level……….168 Table E.5: Frequency of Limit State Occurrences for the Stc40fa Ida With Original and Weakened Fixed Bearing Anchor Bolts Where a Scale Factor of 1.00 Represents the Design-Level………..172 Table E.6: Frequency of Limit State Occurrences for the Slc15fa Ida With Original and Weakened Fixed Bearing Anchor Bolts Where a Scale Factor of 1.00 Represents the Design-Level………173 Table E.7: Frequency of Limit State Occurrences for The Ctc15ea Ida With Original and Revised Pier Column Designs Where a Scale Factor of 1.00 Represents the Design-Level………177 Table E.8: Frequency of Limit State Occurrences for The Clc15ea Ida With Original and Revised Pier Column Designs Where a Scale Factor of 1.00 Represents the Design-Level………178 Table E.9: Frequency of Limit State Occurrences for The Ctc40ea Ida With Original and Revised
Abutment Pile Cap Designs Where a Scale Factor of 1.00 Represents the Design-Level……….184 Table E.10: Frequency of Limit State Occurrences for the Clc40ea Ida With Original and Revised Abutment Pile Cap Designs Where a Scale Factor of 1.00 Represents the Design-Level……….185
1
CHAPTER 1: BACKGROUND
1.1 MOTIVATION
In 2008 and 2009, the American Association of State Highway Transportation Officials (AASHTO) increased the design seismic hazard level from a 500-year return period event to a 1000-year return period event (AASHTO, 2011). As a result of this increase, many bridge structures in Illinois were affected because seismic design became a requirement at a time when that was not previously the case. The project ICT-R27-070: Calibration and Refinement of Illinois’
Earthquake Resisting System Bridge Design Methodology, was conducted through the Illinois
Center for Transportation (ICT). This research evaluated whether Illinois bridges can withstand the increased seismic hazard when using the Illinois Department of Transportation’s (IDOT’s) Earthquake Resisting System (ERS) concept. The ERS strategy generally keeps the
superstructure and substructure elastic while allowing for the bearings between those two components to act as quasi-isolators by fusing.
The study represented in part by this document continues the line of research and is now associated with the ICT-R27-133 project, Calibration and Refinement of Illinois’ Earthquake Resisting System Bridge Design Methodology: Phase II. There has already been extensive prior research into the seismic behavior of stub abutment bridges in Illinois during Phase I of the project (Filipov et al., 2013a; Filipov et al., 2013b; LaFave et al., 2013a; LaFave et al., 2013b; Steelman et al., 2013; Steelman et al., 2014; Steelman et al., 2016; Steelman et al., 2018). Therefore, phase II of the project focuses on refining the computational bridge models for stub abutment bridges and expanding the research to integral abutment bridges (IABs). This
document presents the results of exploring the latter issue.
The presence of integral abutments in IABs removes the need for expansion joints and bearings between the abutment elements and superstructure, which are typically present in stub
abutment bridges. Because they do not allow for individual movement of the superstructure and substructure, using integral abutments can lead to a much stiffer bridge that would behave differently when subjected to earthquake input ground motions. Given this feature of IABs, most aspects of the quasi-isolated behavior, which are relied upon in stub abutment bridges as part of the ERS, are unable to be achieved.
The potential lack of quasi-isolated behavior in IABs has led to the interest in Phase II of this project to study IABs. While there is no information concerning the seismic behavior of IABs in Illinois, there have been previous studies outside of this project focusing on the behavior of IABs when subjected to thermal and live loads (e.g., Olson et al., 2013; LaFave et al., 2016). Thermal and live loads are of great interest due to their applicability to a larger set of regions (i.e., not just in high seismicity regions such as in this study) and because the lack of an
expansion joint can lead to larger stresses in abutment foundations (Olson et al., 2013). Those projects have also analyzed IABs using numerical models, causing them to be useful resources for seismic IAB modeling.
2
Another portion of the seismic ICT project work that required refinement in Phase II involved the ground motions used for the dynamic analyses of Phase I. Earthquake time histories are difficult to acquire for Illinois, so the modification of existing ground motions is often necessary. However, the ground motions used in Phase I utilized input ground motions for two sites (Cape Girardeau, MO and Paducah, KY), as taken from Fernandez and Rix (2006), with simple linear scaling of the ground motions to better match the AASHTO design spectrum for Cairo, IL (Filipov
et al., 2013b). Both the source ground motions and the modification process in Phase I gave the researchers reasons to believe that changes to the ground motion development procedure were necessary in the future.
Based on the general motivations described above in conjunction with the past research conducted in previous phases of this project, the following research objectives were established:
• Develop horizontal ground motion records with appropriate hazard and site conditions for highway bridge dynamic analysis cases in southern Illinois.
• Develop models for all Illinois IABs using the Open System for Earthquake Engineering Simulation (OpenSees) program (McKenna et al., 2006). The models should be
developed using numerous individual detailed component models combined into an overall bridge model.
• Identify and monitor critical components in IABs when subjected to static and/or dynamic lateral loading, which may differ from what occurs in stub abutment bridges.
• Develop a more comprehensive view of IAB behavior in conjunction with seismic design by using IAB model results and previous knowledge from existing projects and literature.
• Develop feedback and recommendations that can be used to modify IDOT’s IAB design and construction procedures with respect to seismic design.
1.2 REPORT ORGANIZATION
The primary goal of this research was to investigate the seismic behavior of typical IABs in Illinois, assess their performance, and then determine any vulnerabilities in IAB seismic design that should be addressed. This report presents the results of computational modeling for typical IDOT IAB configurations conducted from 2013 through 2018. The computational modeling took place in the Department of Civil & Environmental Engineering at the University of Illinois at Urbana-Champaign. Following is a summary of the contents of this report.
Chapter 1 discusses the motivation for the research and provides an overview of past seismic bridge studies in Illinois as well as IAB studies both in and outside of Illinois.
Chapter 2 presents the parametric variations of the prototype IABs explored in this study. This chapter also details the computational modeling procedures for the IAB models.
3
Chapter 3 outlines the procedures used to perform dynamic analyses and presents detailed results for one bridge model subjected to ground motions of varying intensities.
Chapter 4 presents overall dynamic analysis results for the 51 IAB variants described in Chapter 2.
Chapter 5 explores potential adjustments and design recommendations to enhance the seismic behavior of IABs.
Chapter 6 summarizes the key results determined through this study, as well as any related IAB design and construction recommendations going forward. Recommendations for further research are also provided.
1.3 LITERATURE REVIEW
1.3.1 Stub Abutment Bridge Seismic Behavior and Models
In the past, there have been studies concerning the seismic behavior of bridges in southern Illinois. The majority of these studies have come from Phases I and II of this project. The modeling of stub abutment bridges and their seismic analysis can be explained in three parts; the physical experiments on highway bridge components, the modeling of stub abutment bridges, and the evaluation of these bridges with related conclusions drawn.
The main bridge component of interest in Phase I was the bearings. Bearings commonly used in Illinois bridge designs were studied by Steelman et al. (2013; 2014; 2016; 2018) in order to determine their monotonic and cyclic behavior. The three main types of bearings investigated and tested were Type I elastomeric, Type II elastomeric, and low-profile fixed bearings. The side retainers, which accompany the elastomeric bearings in bridges, were also studied. Type I elastomeric bearings are fabricated using a steel shim reinforced elastomer block, which is fused on top to a steel plate, and in contact with the concrete on the bottom, to allow for movement. Type II elastomeric bearings differ from the Type I bearings by being vulcanized to a steel plate at the bottom and allowing for movement at the top between a steel plate
vulcanized to the elastomer with a polytetrafluoroethylene (PTFE) top surface contacting a polished stainless steel top plate. The low-profile fixed bearings are comprised of two steel plates held in place by pintles (IDOT, 2012a).
Results from the physical experiments demonstrated distinct behavior in all four components. Type I and Type II bearings showed an initial static friction force followed by bearing slip and reduced kinetic friction resistance under monotonic loading. Under cyclic loading, the behavior differed slightly in that the Type I bearings needed to reach a post-slip static friction force before sliding again. On the other hand, Type II bearings only needed to reach the kinetic friction resistance upon reloading. Type II bearings also have significantly less friction due to the smaller coefficient of friction between a PTFE surface and steel than the friction between an elastomer and concrete (LaFave et al., 2013b).
4
The experimental data for the elastomeric bearings, side retainers, and low-profile fixed bearings was used to create simplified structural behavior models that can be used in analysis. The experimental data, which only examined a limited amount of bearing and retainer
specimens, has been further extrapolated such that the behavior of all potential IDOT bearings and retainers can be predicted (Filipov et al., 2013a; Filipov et al., 2013b; LaFave et al., 2013a). Bearings and side retainers are just a few of the components within a complete model for a typical stub abutment bridge. The appropriate model behaviors for the numerous other
components not experimented on by Steelman et al. (2013; 2014; 2016; 2018) were developed based on information found in the existing literature. These components include the piers, the foundations at the abutment and pier locations, the abutment backwall, and the backfill (Filipov
et al., 2013a). Those models were combined with other elements, such as elastic superstructure
elements, to form a complete stub abutment bridge model.
The models in Phase I of the project were adequate to obtain many useful findings and conclusions; however, an improvement was desired to the abutment modeling. Luo et al.
(2016) developed a much more detailed abutment model for use in stub abutment bridges in Illinois. This detailed abutment model expands on the simpler stub abutment model by
providing enhanced details for the expansion joint, backfill, foundation, and backwall behavior. In addition, the backfill’s effect on the wingwalls, the wingwall connection, and the approach slab friction are all explicitly modeled (Luo et al., 2016).
The combination of all the individual components into a complete bridge model for Illinois allowed previous studies to monitor and evaluate the behavior of each component individually during a global bridge analysis (Filipov et al., 2013a; Filipov et al., 2013b; LaFave et al., 2013a). Key limit states within the bridges were evaluated based on component behavior during an analysis, and they were used to determine the sequence of damage in a bridge as the ground motions become stronger. The sequence of damage in stub abutment bridges allows for observations and conclusions to be made concerning the vulnerability of certain components and whether the desired quasi-isolated behavior is achieved in the bridge (Filipov et al., 2013b; LaFave et al., 2013a).
Results from the Illinois stub abutment bridge seismic analyses indicated a few observations, which can be used to form recommendations for future design. The main observation dealt with the behavior of bridges that employ Type II elastomeric bearings. It was found that unseating can be all too common in these bridges, leading to the recommendation that Type II elastomeric bearings should be limited to use in lower seismic regions (LaFave et al., 2013a). Another observation is the frequent occurrence of yielding of the piers under fixed bearings. This led to a recommendation that fixed bearing anchor bolt sizes should be revised (LaFave et al., 2013a).
1.3.2 Integral Abutment Bridge Studies and Modeling
Conventional stub abutment bridges traditionally accommodate movement of the
5
and elastomeric bearings at the abutments (Kunin and Alampalli, 1999), as seen in Figure 1.1 (a). While this method is effective at accommodating the superstructure movement, the expansion joints are expensive to buy, install, maintain, and repair. Expansion joints may also cause larger issues if they leak, which allows water, dirt, and deicing chemicals to reach the abutment seat. This is undesirable due to the difficulty in cleaning this location and the increased potential for corrosion of the girders and other related deterioration (Kunin and Alampalli, 1999; Paraschos and Amde, 2011). The use of elastomeric bearings at the abutments of stub abutment bridges also creates issues due to their cost to purchase and install (Paraschos and Amde, 2011).
The advantage of an integral abutment is in the elimination of the issues presented above for stub abutments. Integral abutments remove the expansion joint and elastomeric bearing components at each abutment in favor of creating a continuous superstructure-substructure system that moves together at the abutments. This monolithic design is achieved by embedding the single row of abutment piles (if a pile foundation is used) into the pile cap, resting the superstructure girders on the pile cap, and then placing the deck and abutment concrete at the same time. By pouring the deck and abutment at the same time, the girders end up being embedded approximately 1 ft or more into the abutment (Olson et al., 2009). A diagram of an integral abutment is presented in Figure 1.1 (b). As can be observed, this abutment style eliminates the use of expansion joints and bearings, as well as the expensive costs associated with their installation and maintenance.
Figure 1.1: Representative diagram of (a) a stub abutment (IDOT, 2012a); (b) an integral abutment (IDOT, 2012b).
While integral abutments provide advantages in the form of reducing potential maintenance costs to the girders and abutment seats, there are also some possible disadvantages and limitations that can present themselves. The major issue with integral abutments stems from the fact that, due to the superstructure and abutment being rigidly connected, both forces and moments are transferred from the superstructure to the abutment and piles, as opposed to just forces in the case of stub abutments. This interaction between the girders and abutments, as well as between the abutment, piles, and the soil surrounding the piles, creates a complex
soil-6
foundation-structure interaction problem (Olson et al., 2009). The unknown effects from this soil-structure interaction (SSI) problem, and the uncertainties they lead to in terms of pile flexural stresses, has led to some design and construction limitations on IAB span lengths and skew angles (Itani and Pekcan, 2011).
The use of IABs in Illinois has led to studies that assess the behavior of IABs under thermal loads, in order to modify IDOT’s IAB design process, as necessary. Studies have included both 2-D and 3-2-D modeling of IABs (Olson et al., 2013; LaFave et al., 2016), as well as the monitoring of IABs in the field (Olson et al., 2009; Olson et al., 2013; LaFave et al., 2017), to determine their behavior when subjected to expected magnitudes of thermal and live loads. These studies have observed how IABs can deal with the expansion and contraction of the superstructure without the use of expansion joints or elastomeric bearings at the abutments.
In addition to these studies of entire IAB non-seismic behavior that have been performed in Illinois, a variety of other studies have also examined the seismic behavior of individual components of IABs. Such component studies include investigating the behavior of the SSI at the abutment (Vasheghani-Farahani et al., 2010; Franchin and Pinto, 2014), the pile-pile cap connection (Frosch et al., 2009), and the girder-abutment connection (Itani and Pekcan, 2011). Although the study of individual IAB components has used detailed models in the past, there are typically shortcomings when considering these studies for understanding the overall seismic behavior of IABs. The three main shortcomings of these IAB models concern the overly
simplistic approach to overall bridge modeling, the focus on individual components, and/or the use of detailed components for thermal and live load studies only.
Most studies only model the components of interest to study their specific effects (Spyrakos and Ioannidis, 2003; Itani and Pekcan, 2011; Franchin and Pinto, 2014); while these studies are important, they are often unable to capture overall bridge behavior. Component-specific models have been developed for the embankment (Shamsabadi et al., 2005; Shamsabadi et al., 2007; Kotsoglou and Pantazopoulou, 2009) and the pile-pile cap connection (Teguh et al., 2006; Frosch et al., 2009). Models do exist that include all the components known to experience significant nonlinear behavior during earthquakes. However, these models have only been used for thermal behavior assessments in the past (Olson et al., 2009; Olson et al., 2013; LaFave et al., 2016). The presented limitations of the previous models to seismic IAB analysis justifies the work in this project to develop detailed IAB models for assessing seismic behavior.
7
CHAPTER 2: MODELING OF INTEGRAL ABUTMENT BRIDGES
2.1 OVERVIEW OF PROTOTYPE INTEGRAL ABUTMENT BRIDGES
This section details the prototype IABs included in the parametric study of IAB seismic behavior. The parametric study includes a range of representative IABs that have typically been designed and constructed in Illinois in the past. The parametric study also includes IABs designed for use in the near future, which incorporate newer design properties (such as longer spans) than previously constructed for IABs. The bridges in the parametric study have all been designed using the IDOT Bridge Manual (IDOT, 2012a) and other IDOT references that provide updated information not found in the Bridge Manual. The IABs in the parametric study (see Table 2.1 and Figure 2.1) are designed for the city of Cairo due to its proximity to the New Madrid Seismic Zone (NMSZ), which is responsible for the high seismic hazard in southern Illinois
Table 2.1: Matrix of IABs Analyzed in the Parametric Study
Figure 2.1: Bridge model naming convention.
The 51 parametric study scenarios, described further in Table 2.1, have been developed by varying a bridge’s superstructure material and span configuration, height of the piers, layout of bearings at the pier locations, and foundation soil condition. Additionally, variations in seismic hazard are also investigated by varying the site of a bridge throughout southern Illinois. These variations are explored using the bridge analyses described in this report and through the
8
naming convention provided in Figure 2.1. No skew is considered. Although a number of IABs in Illinois include skew, a fundamental study of IAB seismic behavior without skew is imperative before adding the complexity of skew.
2.1.1 Parametric Variations
2.1.1.1 IAB Superstructure Material and Span Configuration
The parametric study considers five IAB superstructures, and this set contains two
superstructure girder materials and three span configurations. The two superstructure girder types are steel plate girders and precast prestressed concrete (PPC) girders. The steel girders are based on typical designs while the PPC girder properties are taken from the IDOT All Bridge Designers Memorandum 15.2 concerning PPC IL-shapes (IDOT 2015). This Memorandum contains information on updated PPC shapes used by IDOT to design for longer spans than previously constructed.
The three different span configurations investigated in the parametric study include single-span (1-span), 3-span, and 4-span IABs. The single-span bridge is only considered with steel girders (“Ss” in the naming convention of Figure 2.1), while the 3- and 4-span IABs are considered for both steel girders (“St” and “Sl” in the naming convention of Figure 2.1, for 3- and 4-span, respectively) and concrete girders (“Ct” and “Cl” in the naming convention of Figure 2.1, for 3- and 4-span, respectively). Only steel girders are considered for single-span bridges since the superstructures are modeled as elastic and the differences in response between concrete and steel single-span bridges are likely minimal. The single-span bridges extend 160-ft between the abutments. The three-span IABs represent typical spans for southern Illinois. These bridges consist of exterior spans of 80-ft between the abutments and piers and a central span of 120-ft between the piers. The four-span IABs consist of exterior spans of 145-ft between the
abutments and the piers and two interior spans between piers of 160-ft. The four-span bridges are included in the study as a maximum span that could be encountered with IDOT designs since the overall span of 610-ft is the maximum allowed in the abutment pile selection charts (IDOT, 2012b). A diagram of the three-span IAB configuration is provided in Figure 2.2.
Figure 2.2: Diagram of the three-span IAB configuration considered in the parametric study. 2.1.1.2 Multi-Column Piers
Illinois bridges are typically designed to have either wall piers or multi-column piers. Both of these options have been studied in past Illinois bridge seismic studies, but it has been found that there is little difference between the use of walls or columns at the piers in terms of
9
seismic performance (LaFave et al., 2013a). For this reason, and to reduce the computational expense of the parametric study, only multi-column piers with four columns (“C” in the naming convention of Fig. 2.1) are considered in the IABs of the parametric study.
Although past Illinois bridge seismic studies have indicated that the type of pier does not have a significant effect on the seismic performance of a bridge, they have indicated that the clear height of the piers can have a significant influence on seismic performance (LaFave et al., 2013a). The clear height of the piers (the height between the top of the pile cap and the
bottom of the pier) is varied in the parametric study between a relatively short pier and a taller pier. The short pier clear height is 15 ft (“15” in the naming convention of Fig. 2.1) while the tall pier is represented by a clear height of 40 ft (“40” in the naming convention of Fig. 2.1). The designs of the pier columns vary depending on the specific IAB, as discussed in a later subsection.
2.1.1.3 Bearing Layout
Type I elastomeric bearings and low-profile fixed bearings are considered in the parametric study. While stub abutment bridges typically have bearings at both the abutments and piers, bearings are not needed at the abutments in IABs. Stub abutment bridges require fixed bearings at one pier, whereas IABs are restrained at the ends and may employ elastomeric bearings at all piers. The case of fixed bearings at all piers is also considered, in order to investigate a very stiff bridge scenario.
The elastomeric bearings considered in the parametric study are all Type I elastomeric bearings (“E” in the naming convention of Figure 2.1). Type I elastomeric bearings are accompanied by side retainers in the bridge transverse direction. The fixed bearings considered in the
parametric study are low-profile fixed bearings (“F” in the naming convention of Figure 2.1). The size of the elastomeric bearings and the anchor bolts for the retainers and fixed bearings are discussed in a later section.
2.1.1.4 Foundation Soil Conditions
Four foundation soil conditions are considered in the parametric study: stiff soil (“H” in the naming convention of Figure 2.1), soft soil (“S” in the naming convention of Figure 2.1), alluvial soil (“A” in the naming convention of Figure 2.1), and non-alluvial soil (“N” in the naming convention of Figure 2.1). The stiff and soft soil conditions are based on the realistic bounds of soil for southern Illinois (Luo et al., 2016), while the alluvial and non-alluvial soil conditions are based on actual soil data for southern Illinois (Kozak et al., 2017).
The stiff and soft soil conditions are considered for all sites to represent the realistic bounds. However, only one of either the alluvial or non-alluvial soil conditions are considered for each site, equaling three soil conditions per site. The use of either alluvial or non-alluvial soil conditions at a site is based on the local geology of the site. In summary, the three soil conditions considered in the majority of the parametric study for a site in Cairo are the stiff, soft, and alluvial soil conditions.
10
2.1.1.5 Ground Motion Intensity Variations from Different Site Locations
The majority of the parametric study considers only the soil conditions and seismic hazard for Cairo. This is due to Cairo being the closest location in Illinois to the New Madrid Seismic Zone, which therefore experiences the largest intensity of ground motion shaking and increased seismic hazard. The parametric study also investigates changes in the seismic hazard and the intensity of ground motion shaking by varying the location of the site being investigated. In general, sites further north in Illinois typically have less intense ground motions in terms of spectral acceleration. This is demonstrated by the seismic performance zone designation of sites further north in the state relating to smaller design spectral accelerations at the 1.0 s period than at sites further south. Ten sites are considered, which span across seismic
performance zones 2, 3, and 4. The ground motion intensity of each site is varied in the study by using the appropriate ground motions developed for each site.
2.1.2 Integral Abutment Bridge Details
The bridge parameters considered in the parametric study include IAB designs for each of the 51 different variations. The IAB designs are based on the IDOT Bridge Manual (IDOT, 2012a), IDOT All Bridge Designers Memorandum 12.3 concerning IABs (IDOT, 2012b), and input from IDOT engineers to ensure that the designs are typical for the state. The IABs designed for the parametric study represent typical designs of existing single-span and 3-span bridges, as well as designs for a longer 4-span IAB representative of possible future IAB construction. The basic parameters for the 51 distinct IABs are summarized in Table 2.2. Tables containing more detailed information for the 51 IABs and their modeling in OpenSees can be found in Appendix A.
2.2 INTEGRAL ABUTMENT BRIDGE MODELING
2.2.1 INTEGRAL ABUTMENT BRIDGE MODEL DESCRIPTION
The goal in the development of the IAB model is to accurately represent an IAB’s seismic behavior while still accounting for computational efficiency. This goal is achieved by using experimental data and literature to develop models for individual components, by ensuring that accurate masses are appropriately placed, and by ensuring the model captures the damage found in actual IABs after earthquakes. The model must also account for the bridge parameters of interest, which are varied throughout the parametric study as described earlier. A sample three-span steel IAB is presented alongside its OpenSees model in Figure 2.3, to show the similarity in component placement.
11
Table 2.2: Basic Design Details for the IAB Parametric Study
Superstructure 1-Span Steel 3-Span Steel 4-Span Steel Concrete 3-Span Concrete 4-Span
Girder Size 70" Plate Girder 40" Plate Girder 60" Plate Girder IL54-2438 PPC Girder IL72-3838 PPC Girder Number of Girders 6 @ 7'-0" Spacing 6 @ 7'-3" Spacing 8 @ 5'-6" Spacing 6 @ 7'-3" Spacing 7 @ 6'-2" Spacing Deck Width 43'-2" 43'-2" 43'-2" 43'-2" 43'-2"
Deck Thickness 8" 8" 8" 8" 8"
Span Lengths 160' 80'-120'-80' 145'-160'-160'-145' 80'-120'-80' 145'-160'-160'-145'
Pier Bearings
Type I Bearings - 15-a 20-d 13-b 18-d
Retainer Bolt Dia. - 1.25" 2.00" 1.00" 1.50" Fixed Bearing Bolt Dia. - 1.25" 2.00" 1.00" 1.50"
Column Piers
Column Clear Height - 15' 40' 15' 40' 15' 40' 15' 40' Column Diameter - 2'-6" 3'-0" 2'-6" 3'-0" 2'-6" 3'-0" 2'-6" 3'-0" Reinforcement - 12 - #10 14 - #11 12 - #10 #11 14 - 12 - #10 14 - #11 12 - #10 14 - #11 Reinforcement Ratio - 2.08% 2.04% 2.08% 2.04% 2.08% 2.04% 2.08% 2.04%
Pier Foundation
Column Clear Height - 15' 40' 15' 40' 15' 40' 15' 40'
Pile Section - HP10x42 HP10x42 HP10x42 HP12x74
Number of Pile Rows - 2 2 3 3 3 3 3 3
Piles per Pile Row - 7 8 7 8 7 7 6 7
Distance Between Pile
Rows - 5'-0" 5'-0" 5'-0" 5'-0" 4'-0" 4'-0" 4'-0" 4'-0"
Abutment Foundation
Number of Piles 6 6 8 6 7
12
Figure 2.3: (a) Diagram of a typical three-span steel IAB, and (b) The representative OpenSees model for that three-span IAB.
The IAB model developed for this study is similar to the models developed to study stub
abutment bridge seismic behavior in Illinois (Filipov et al., 2013a; Filipov et al., 2013b; Luo et al., 2016; Luo et al., 2017) using the Open System for Earthquake Engineering Simulation program (OpenSees) (McKenna et al., 2006). The prior work to develop stub abutment bridge models established useful component numerical models for simulating the seismic response of highway bridges in Illinois. Full-scale testing was used to validate elastomeric bearing, side retainer, and low-profile fixed bearing models that were implemented in OpenSees (Filipov et al., 2013a). The overall IAB system model, though, cannot be validated with experimental data. However, qualitative validation has been conducted through the comparison of the IAB model behavior to damage found in post-earthquake IAB observation studies. Waldin et al. (2012) and Wood (2015) found large amounts of damage to the abutments, abutment piles, and piers in IABs after earthquakes in New Zealand. Significant damage to these same components is also found in the IAB models developed in this study, generally validating the overall behavior of the models to capture actual bridge behavior.
2.2.2 Integral Abutment Component Models
The integral abutment model comprises of ten primary sub-components whose models are described in the following subsections. The representation of the model that is used in
13
Figure 2.4: Model representation of an integral abutment. 2.2.2.1 Girder-Abutment Connections
The girder-abutment connection (component 1 in Figure 2.4) consists of two primary elements: 1. A direct bearing of the superstructure girder on either a 2-in thick rocker plate or a 1-in
thick bearing pad. A rocker plate is used if the girders are steel plate girders, and the bearing pad is used if the girders are prestresed concrete beams (IDOT, 2012b). 2. Concrete is poured such that the girders are cast directly into the abutment, and the
deck and abutment are a single monolithic portion of concrete. While the concrete is wet, the girder may still rotate on the rocker plate or bearing pad to accommodate the weight of the concrete deck. However, once the concrete hardens, relative rotation of the girders does not generally occur due to the large section of concrete encasing them in the abutment with a sufficient embedment length.
In the model, the connection is only set to be rigid after the dead load application. To simulate the wet concrete allowing for rotation, and because the wet concrete does not transfer
moments from the superstructure to the abutment during the application of dead load, the connection is first modeled to allow for free rotation. The connection model is then set to rigid during the dynamic analysis to simulate the hardened concrete, which does transfer moments and must maintain a consistent rotation.
2.2.2.2 Abutment and Pile Cap
The abutments and pile caps (components 2 and 3, respectively, in Figure 2.4) are both individually poured sections of concrete which are connected through a construction jointThe components themselves are much stronger and stiffer than any of the other components attached to them. Per standard IDOT details, both components are 3-ft 4-in. wide for steel