John Louis Van Hemert
Iowa State UniversityFollow this and additional works at:
https://lib.dr.iastate.edu/etd
Part of the
Electrical and Computer Engineering Commons
This Dissertation is brought to you for free and open access by the Iowa State University Capstones, Theses and Dissertations at Iowa State University Digital Repository. It has been accepted for inclusion in Graduate Theses and Dissertations by an authorized administrator of Iowa State University Digital Repository. For more information, please [email protected].
Recommended Citation
Van Hemert, John Louis, "Methods for integrated biochemical pathway analysis" (2010).Graduate Theses and Dissertations. 11793.
by
John L. Van Hemert
A dissertation submitted to the graduate faculty in partial fulfillment of the requirements for the degree of
DOCTOR OF PHILOSOPHY
Interdepartmental Major: Bioinformatics and Computational Biology
Program of Study Committee: Julie A. Dickerson, Co-major Professor
Basil Nikolau, Co-major Professor Roger P. Wise
Gustavo MacIntosh Peng Liu
Iowa State University Ames, Iowa
2010
I would like to dedicate this thesis to my wife Jessica, without whose support I would not have been able to complete this work. She has shown great perseverance and love by sacrificing much to allow me to pursue this degree. It is fitting, then, that this work be dedicated to the one who has sacrificed so selflessly over several years. I would also like to thank my friends and family for their loving support during the writing of this work. Specifically my parents, Gary and Mary Beth Van Hemert, whose roles entailed constant encouragement.
TABLE OF CONTENTS
LIST OF TABLES . . . vi
LIST OF FIGURES . . . vii
ACKNOWLEDGEMENTS . . . x
ABSTRACT . . . xi
1. INTRODUCTION . . . 1
2. MONTE CARLO RANDOMIZATION TESTS FOR LARGE-SCALE ABUNDANCE DATASETS ON THE GPU . . . 5
Abstract . . . 5
Introduction . . . 6
Strengths . . . 8
Weaknesses . . . 8
Computational methods and theory . . . 8
Data representation . . . 8
Data manipulation . . . 9
Output . . . 10
Test statistic functions . . . 12
Samples of typical program runs . . . 12
Specifications . . . 14
Hardware requirements . . . 14
Functionality . . . 21
Pathway Integration Across Databases . . . 22
Creating New PathwayAccess Plugins . . . 23
Examples . . . 23
Impact . . . 24
Discussion of Technical Solutions . . . 24
Importing and integrating pathways . . . 25
Caching database queries . . . 27
Committing a model to a database . . . 28
Pseudocode . . . 29
4. DISCRIMINATING OMICS RESPONSE GROUPS IN BIOCHEMI-CAL PATHWAY NETWORKS . . . 37
Abstract . . . 37
Introduction . . . 37
Background Terminology . . . 39
Existing uses of flow simulation . . . 41
Other graph theoretical metrics and properties . . . 42
Modeling directed random walks . . . 42
Summarizing random walk flow between groups of nodes . . . 43
Modeling and testing values in Θ, Θ(rev), and Θ(tot). . . 45
Applications Using Our Web Tool . . . 50
Use Case: LipidA inhibition in E. coli . . . 50
5. EXPRESSION PLATFORM INTEGRATION AND INSIGHTS INTO
THE GRAPEVINE’S RESPONSE TO SHORT WINTER DAYS . . . . 63
Abstract . . . 63
Introduction . . . 64
Results . . . 67
Platform Integration for Exon Quantification . . . 67
Single-Platform Analysis of the Full Photoperiod-induced Bud Dormancy Data 68 Discussion . . . 75
Platform Integration . . . 75
Dormancy-related Genes . . . 75
Methods . . . 81
Platform Integration Technical Study . . . 82
Single-Platform Analysis of the Full Photoperiod-induced Bud Dormancy Data 85 APPENDIX A. GRAPEVINE DNA SEQUENCING PROJECTS . . . 97
APPENDIX B. ANNOTATION DATABASES FOR VITIS . . . 114
Table 4.1 Interpretation of different flow simulations and tests. . . 60
Table 5.1 Transcription Factor Families . . . 68
Table 5.2 Existing data points for the two microarray platforms. . . 82
Table C.1 Icons and buttons on the web tool. . . 122
Table C.2 Significant up-regulated E. coli reactions. . . 123
Table C.3 Significant down-regulatedE. coli reactions. . . 125
Table C.4 Overrepresented Annotation: Cluster 1 . . . 128
Table C.5 Cluster 1 Pathways. . . 129
Table C.6 Overrepresented Annotation: Cluster 3 . . . 130
Table C.7 Cluster 3 Pathways. . . 132
Table C.8 Overrepresented Annotation: Cluster 5 . . . 133
Table C.9 Cluster 5 Pathways. . . 134
Table C.10 Cluster 6 Pathways. . . 135
Table C.11 Overrepresented Annotation: Cluster 7 . . . 136
Table C.12 Cluster 7 Pathways. . . 138
Table C.13 Overrepresented Annotation: Cluster 8 . . . 139
Table C.14 Cluster 8 Pathways. . . 140
LIST OF FIGURES
Figure 1.1 Research Roadmap . . . 2
Figure 2.1 Permutation test schematic . . . 15
Figure 2.2 GPU memory allocation . . . 16
Figure 2.3 GPU verification on CPU . . . 17
Figure 2.4 Speedup x number of columns . . . 18
Figure 2.5 Speedup x number of variables . . . 18
Figure 2.6 Speedup x number of permutations . . . 19
Figure 3.1 Dataflow for PathwayAccess plugins . . . 22
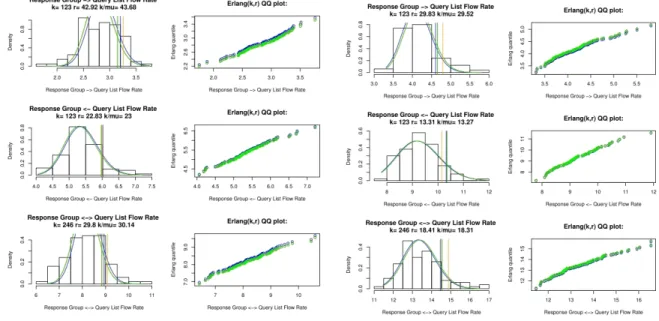
Figure 4.1 General assessment ofMij fit to Exponential . . . 46
Figure 4.2 Erlang assessments . . . 48
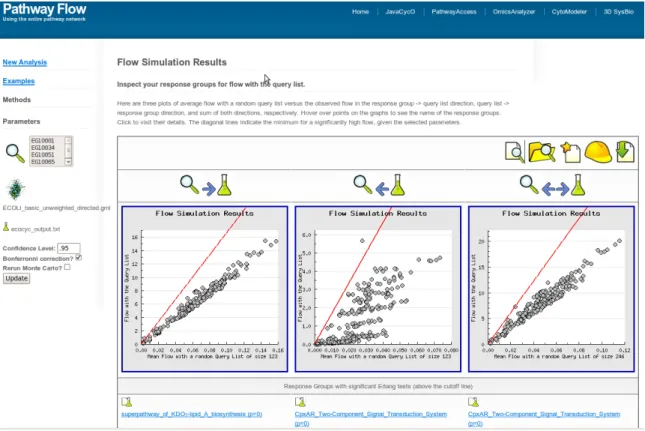
Figure 4.3 Our PathwayFlow webtool . . . 51
Figure 4.4 CHIR-090 binds LpxC . . . 52
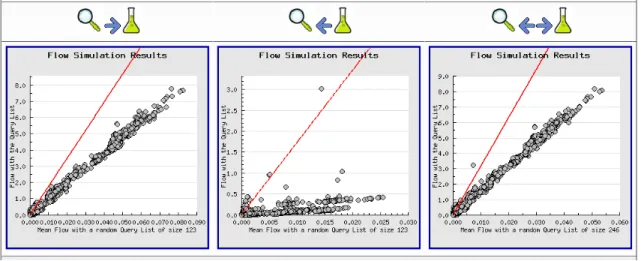
Figure 4.5 Flow plots for up-regulated E. coli pathways . . . 53
Figure 4.6 Flow plots for up-regulated E. coli reactions . . . 54
Figure 4.7 Venn diagram for up-regulatedE. coli pathways . . . 55
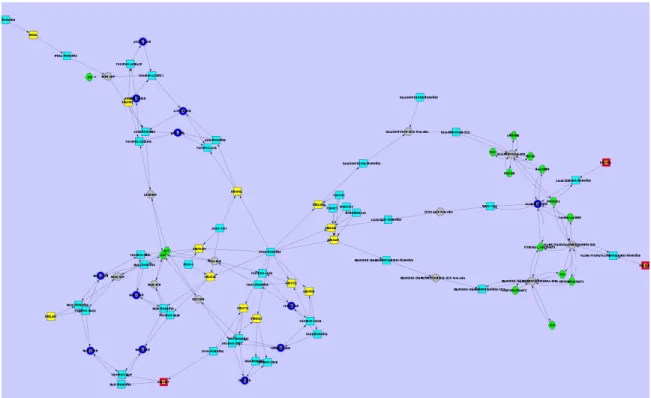
Figure 4.8 The integrated pathways containing significant successor reactions . . . 56
Figure 4.9 The saccharolipid Kdo2-Lipid A . . . 57
Figure 4.10 The integrated pathways containing significant predecessor reactions . 58 Figure 4.11 Flow plots for down-regulatedE. coli pathways . . . 59
770 gene data set . . . 73
Figure 5.6 Transcription Factor Homologues . . . 74
Figure 5.7 The Swappable Prediction Model . . . 84
Figure 5.8 Estimating the ∆ sampling distribution . . . 92
Figure 5.9 ∆-basedp- andq-values . . . 93
Figure A.1 Cross-assembly mapping is a bipartite graph problem . . . 101
Figure A.2 Distribution of Cross-platform MegaBlast hit scores. . . 103
Figure A.3 Cross-platform MegaBlast hit positions . . . 104
Figure A.4 Cross-platform MegaBlast hit positions 3D . . . 105
Figure A.5 Opposite-strand inversion alignment odds ratio . . . 106
Figure A.6 Full chromosome MegaBlast alignments . . . 107
Figure A.7 Full chromosome MegaBlast alignments in GBrowse . . . 108
Figure A.8 Corvina genes detected in Fasoli et al atlas . . . 110
Figure A.9 GBrowse tracks for Corvina indels . . . 112
Figure A.10 PathwayFlow plots for Corvina indels . . . 113
Figure B.1 A VitisMart use case. . . 116
Figure B.2 VitisMart is integrated with our GBrowse server. . . 117
Figure B.3 VitisCyc summary statistics. . . 118
Figure B.4 Chromosome 1 in VitiCyc. . . 119
Figure B.5 The glycolipid biosynthesis pathway in VitiCyc. . . 120
Figure C.1 Automatic ID lookup service . . . 121
Figure C.3 Probes linked by common exons . . . 141
Figure C.4 Cross-platform probe correlations . . . 142
Figure C.5 Normalizing for Integration . . . 143
Figure C.6 Probe-Exon Systems . . . 144
Figure C.7 Year effect distributions . . . 145
Figure C.8 Control probes fluorescence . . . 146
Figure C.9 Assessing multivariate Normality . . . 146
I would like to take this opportunity to express my thanks to those who helped me with various aspects of conducting research and the writing of this thesis. First and foremost, Dr. Julie A. Dickerson for her guidance, patience and support throughout this research and the writing of this thesis. She is an exemplary advisor who always know exactly how to guide her students to success. I would also like to thank my co-advisor, Dr. Basil Nikolau, whose expertise and insights are invaluable. I would also like to thank my committee members for their efforts and contributions to this work: Dr. Roger P. Wise, Dr. Gustavo MacIntosh, and Dr. Peng Liu. Without their feedback, this work would not be possible. I would additionally like to thank collabroators Anne Y. Fennell, Grant Cramer, and Mario Pezzotti. Their guidance and support enabled me to learn much of the necessary methods for this work. Lastly, but not least, I would like to thank Trish Stauble for her advice and coordination during my time as a student in this interdepartmental program.
This work was funded by three fellowships: Graduate Assistance in Areas of National Need (US Department of Education), Grape Research Collaboration Netowrk Student Travel Stipend (National Science Foundation (NSF) grant DBI 0741876), and James Cornette Fellowship (the Iowa State University Bioinformatics and Computational Biology program). Much of the work was also funded by two other NSF grants: DBI 0604755 and EEC 0813570.
ABSTRACT
The common goal for biological research is to develop models for the biological processes we seek to understand. Such models, in the form of biochemical pathway networks which describe the physical interactions between a living cell’s genes, transcripts, proteins, and metabolites (”Omics”), accumulate in different repositories for several model organisms as well as non-model organisms. This thesis presents a set of integrated statistical bioinformatics tools that address key problems in integrating large-scale Omics datasets with pathway network models. A hardware accelerated non-parametric Omics mining method (Monte Carlo on the GPU) allows faster screening of custom test statistics and functions. A software platform for mining pathway databases (PathwayAccess) confers knowledge integration and comparison. Omics and pathway mining are combined for a novel method for statistically discriminating func-tionally meaningful subnetworks for their interaction with lists of entities mined from Omics data, so that software can intelligently mine large and complex pathway databases to answer a wide variety of questions and generate hypotheses (Discriminating Omics Response Groups in Pathways). The method, called PathwayFlow, can discriminate pathways, reactions, metabo-lite classes, or any other biological entity grouping (Response Groups), and automatically accounts for connectivity-caused biases in the pathway network. It also differentiates between regulators (or inputs) and regulatees (or outputs) for a given Query List of Omics entities. It is applied to three real datasets: a simple E. coli gene expression dataset which validates the method, a more complex Vitis gene expression dataset which complements functional enrichment analysis (Grapevine’s Response to Short Days), and an ultra-high throughput re-sequencing dataset for assessing genetic differences between two wine grape varieties (DNA Sequencing Appendix).
Omics refers to the quantification of the entirety of something in a living cell. Whether it is genomics, transcriptomics, proteomics, metabolomics, or other -omics, most studies involve four general steps:
1. Design the experiment. This includes a careful consideration of the objectives of the study and plans for sampling.
2. Generate the data. This is when the experiment is run; samples are generated/collected, and biotechnologies such as sequencing or microarrays are used.
3. Mine the data. This is the first directly computational step (although design should consider statistical requirements for sampling), where data points collected from the biotechnologies are pre-processed and relavent entities (ie differentially expressed genes) are mined from the full population.
4. Interpret the results. This is usually the most intellectually creative and challenging step. Given lists mined from the data, scientists must reconcile them with existing biological knowledge as well as hypothesize new models for the biological processes that were activated or perturbed by the experimental treatments.
The purpose of this dissertation is to communicate my contribution to our ability to con-duct the final two general steps: Data Mining and Results Interpretation, specifically in the metabolic pathway context. These steps are closely linked, not only because they are computa-tional, but because data mining results directly affect interpretation and hypothesis generation; During the data mining step, the interpretation step must be considered so that the desired behaviors are mined and during the interpretation step, one must understand how the omics
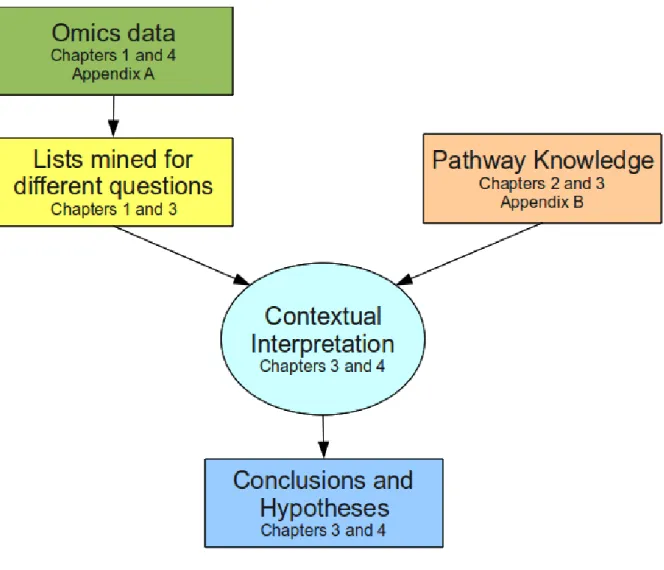
lists were mined from the data. Figure 1.1illustrates the relevant research processes and how they relate to one another as well as their focus in the following chapters.
Figure 1.1 Research processes and the chapters which discuss them.
This document is organized into four chapters, each a manuscript that is either already published in a peer reviewed journal or will be submitted to one. The first chapter, Monte Carlo Randomization Tests for Large-scale Abundance Datasets on the GPU (Van Hemert and Dickerson (2010a), Chapter 2 on page 5), was published in Computational Methods and Programs in Biomedicine in June 2010 and discusses the challenge of mining lists of entities from Omics data and presents a hardware-accelerated Monte Carlo based method for doing so. It is an important component to the general work because mining lists from Omics data is
and presents a software for doing so. It is important because an understanding of the existing pathway databases is necessary for processing such data and knowledge and pertains to the interpretation step, specifically the pathway context.
The third chapter, Discriminating Omics Response Groups in Biochemical Pathway Net-works (to be submitted, Chapter 4 on page 37), presents a novel method for statistically modeling and discriminating subnetworks from a pathway network using sound hypothesis tests. Inputs include a list of Omics entities (i.e. differentially expressed genes), a metabolic pathway network on which to base interpretation, and a preset definition of response groups to be discriminated; response groups can be any delineation of metabolic entities in the network such as pathways, reactions, or chemical compound classes. Current implementations of the tool only support pathway or reaction response groups. The output is a visualization of the hy-pothesis tests used to discriminate significant response groups along with lists of said response groups. The method is validated with a web tool use case for analyzing differentially expressed
E. coli genes in the EcoCyc pathway network and a novel model for E. coli response to Lipid A deprivation is posited. This chapter pertains to the interpretation step and is the main computational contribution of this work by integrating concepts from the first two chapters.
The fourth chapter, Expression Platform Integration and Insights into the Grapevine’s Re-sponse to Short Winter Days (to be submitted, Chapter 5 on page 63), focuses on grapevine data and includes two parts: First, a technical gene expression integration study with a novel method for exon-specific quantification and verified by a comparison to RNAseq data. This sec-tion is a key component to the work because understanding the relasec-tionships between different biotechnologies is necessary for processing Omics data. It also uses some of the same compu-tational theory as the third chapter, but for modeling relationships between exons and the
mi-croarray probes that measure them instead of pathway networks. Second, a novel multivariate data mining effort to mine time-dependent activity from gene expression in the paradormant buds of Vitis riparia along with a functional analysis using conventional category enrichment tests and our novel pathway flow modelling method described in the third chapter. This section is also important because it applies a novel mining method to real data and then complements the flow analysis method in the third chapter with a traditional category enrichment analysis for the resulting gene lists to generate new hypotheses for the grapevine’s response to shorter photoperiods. This chapter discusses all four general Omics steps and uses novel methods for the third and fourth steps.
Two appendices include content from other bioinformatic work conducted during this time. Much of the work presented in the appendices was done at the University of Verona under the supervision of Dr. Mario Pezzotti and funded by a student travel stipend awarded by the Grape Research Collaboration Network. AppendixA on page 97discusses challenges and solutions for processing ultra-high throughput data from Next-Generation Sequencing projects. This section is highly relevant to the main document because it shows exposure and understanding of new biotechnologies and the computational methods that are being developed to process their data. AppendixB on page 114discusses solutions for curating the results and integrating them with functional annotation, which is a non-trivial task when working with multiple collaborators at different locations and different sets of functional annotation.
ABUNDANCE DATASETS ON THE GPU
A paper published in Computational Methods and Programs in Biomedicine
John L. Van Hemert and Julie A. Dickerson
Abstract
Statistical tests are often performed to discover which experimental variables are react-ing to specific treatments. Time-series statistical models usually require the researcher to make assumptions with respect to the distribution of measured responses which may not hold. Randomization tests can be applied to data in order to generate null distributions non-parametrically. However, large numbers of randomizations are required for the precise
p-values needed to control false discovery rates. When testing tens of thousands of variables (genes, chemical compounds, or otherwise), significantq-value cutoffs can be extremely small (on the order of 10−5 to 10−8). This requires high-precision p-values, which in turn require large numbers of randomizations. The NVIDIA® Compute Unified Device Architecture® (CUDA®) 1 platform for General Programming on the Graphics Processing Unit (GPGPU)
was used to implement an application which performs high-precision randomization tests via Monte Carlo sampling for quickly screening custom test statistics for experiments with large numbers of variables, such as microarrays, Next-Generation sequencing read counts, chromoto-graphical signals, or other abundance measurements. The software has been shown to achieve up to more than 12 fold speedup on a Graphics Processing Unit(GPU) when compared to a
powerful Central Processing Unit(CPU). The main limitation is concurrent random access of shared memory on the GPU. The software is available from the authors.
Introduction
Statistical models provide a detailed analysis of the extremity of observed data and are always based on some number of assumptions. These assumptions usually consider the rela-tionships between the test subjects and treatments as well as the nature in which a subject responds to a treatment. Randomization tests provide a non-parametric measure of the ex-tremity of an observation which does not require these assumptions. While some methods such as Knijnenburg et al. (2009) attempt to approximate sampling distribution behavior in the tails by fitting curves to simple permutation sets, exact permutation is the only way to be sure of tail behavior for complex statistics.
Time series experiments violate the usual assumption of independence in statistical testing because samples from different time points are inherently related through time. One method which does not require independence is the generation of a null distribution by reordering data labels in all possible permutations and calculating the value of a test statistic for each permutation. The test statistic calculated from the observed abundance profile can then be tested under the null hypothesis, by comparing it to the generated null distribution. See Figure 2.1 for an illustration of the general randomization test procedure. A test statistic can be any meaningful function of the abundance profile of a variable. While a student’s T statistic is an example of a simple parametric test statistic, other functions can be used with this application, such as comparing different distance metrics between treatments through time. When the number of samples over the time points is prohibitively large, a Monte Carlo simulation simply samples randomly from the population of all possible permutations in order to estimate the true null distribution. Gene expression datasets created using microarray or Next-Generation technology are prime candidates for our method because these datasets contain tens to hundreds of observation on thousands to tens of thousands of variables.
method, known as Bonferroni correction (Holm, 1979), divides the desired false discovery rate by the number of tests. If the FDR is 0.05 (a common selection), then the significance cutoff would be 0.05/20,000 = 0.0000025. Clearly, the precision of sampling only 100 permutations for an abundance profile is inadequate. Sampling 100 random permutation statistics results in p-values of 0.0, 0.01, 0.02, up to 1.0; the smallest non-zero p-value is 0.01, which is much larger than the cutoff value. These examples show that there is a granularity associated with permutation statistics which limits the sensitivity of the overall test. For our example with 20,000 abundance profiles permuted 100 times, there is a granularity of 1/100 = 0.01, so profiles with true exact permutation p-values between 0.0000025 (the cutoff value) and 0.01 would not be considered interesting, because they would usually yield zero random statistics more extreme than their corresponding observed statistics. On average, sampling just 100 permutations would yield p-values of 0.0 and declare them as interesting, resulting in false positives. For this example, a granularity of 1/107 = 10−7 would be necessary to discriminate between true random statistics of 0.0000025 and 0.0000026; false Discovery Rate would not be correctly controlled with less than 107 permutations for each variable. Alarmingly, under a null hypothesis with a uniform distribution ofp-values, an experiment with 20,000 variables would be expected to produce (0.01−.0000025)∗20,000 = 200 unintended significantp-values. Permuting so many abundance profiles so many times each can be computationally pro-hibitive. Fortunately, the process is parallelizable on a graphics processing unit (GPU). GPUs are designed to quickly update information on pixel displays in parallel. GPUs are usually able to carry out specific hardware-tuned calculations meant for graphics display. NVIDIA’s CUDA platform provides a C-like programming language and compiler enabling general pro-gramming of standard and user-defined functions on the GPU. The following sections describe
the algorithm and speedup results for high-precision randomization tests on a GPU. NVIDIA’s CUDA (Corporation, 2007) platform for GPGPU was used to implement an application which performs high-precision randomization tests via Monte Carlo sampling for quickly screening custom test statistics for abundance data. The software achieves up to more than 12 fold speedup on a GPU when compared to a powerful CPU.
Strengths
Conducting large numbers of randomizations for each variable enhances multiple testing correction and improves confidence in results. The massively parallel GPU can be a powerful tool for randomization tests on abundance data when the experiment is complex, parametric assumptions are unmet, and high p-value precision is necessary for correct FDR control.
Weaknesses
Shared GPU memory creates a speedup bottleneck for data-dependent applications. On a multi-cored computing architecture with shared memory, the processing speed of this type of application depends on the architecture’s ability to allow multiple threads (cores) to access memory simultaneously. The architecture used here is CUDA compute capability 1.0, which limits the number of simultaneous coalesced memory accesses to 16 and does not offer large enough on-chip cached memory for typical abundance datasets. Future plans include redesign of the application using a more advanced architecture such as CUDA compute level 1.3 which may provide more flexibility in coalescing memory accesses between threads. Goals of the improved application would include all the those for the current one, plus providing a speedup over the compared CPU architecture significantly greater than 12X.
Computational methods and theory
Data representation
Abundance experiment data are usually stored as text files in the form of delimited tables. Rows are labeled by unique identification numbers or accessions representing different variables.
GCRMA (Irizarry et al., 2003b).
Data manipulation Data preparation
The application reads a tabular abundance data file into host memory and then copies it to device global memory, where it can be read by all threads after the randomization test kernel launches. Before the test statistic calculation begins, another kernel transposes the input data. The data must be transposed to allow for coalesced GPU global memory accesses (see Figure
2.2). See Corporation (2007) for details on memory access coalescence. The kernel used to efficiently transpose the data is provided with the CUDA toolkit as an example project [7].
Permute column indices
Column index permutation is parallelized by thread block. Each data row (abundance profile) is permuted according to permuted indices shared by each thread block. This way, random permutation need only be conducted once for each permutation requested by the user and not r times for each permutation requested where r is the number of data rows. This also allows for coalesced memory accesses when permuted data rows. The kernel parallelizes an algorithm for pseudo-random number generation similarly to the Mersenne Twister project example included in the NVIDIA CUDA Software Development Kit (SDK) (Pdlozhnyuk, 2007). The Mersenne Twister algorithm is a large-period bit vector-based method for pseudo-random number generation and is ideal for implementation on the GPU. The pseudo-random numbers generated are used to shuffle the data row indices (0 through the number of data columns less 1) using the modern implementation of the Fisher-Yates Shuffle described in (Durstenfeld,
1964).
Compare observed statistic with permutation-based statistic
With a shared index permutation now in hand, data row processing is parallelized by thread within each block. Each thread in a thread block is assigned a different data row (abundance profile). Each thread then stores its data row in permuted order according to the index permutation. It then calculates the test statistic and compares it to the same test statistic for the observed (un-permuted) data row (abundance profile), which has been calculated and stored in global GPU memory previously by a different kernel. If the randomly permuted data results in a more extreme test statistic, a count of permutations at least as extreme as the data row is incremented. When finished, this count will be divided by the number of permutations, resulting in a p-value which approaches an exact limit as the number of permutations grows. Note that the meaning of ”more extreme” depends on the meaning of the test statistic. For example, some test statistics may require a comparison of the observation’s and permutation’s distance from zero, rather than a simple comparison of the observation and permutation test statistics. See the pseudocode for the thread kernel in Algorithm 1.
Output
When the permutations are complete for all variables, the count of randomizations at least as extreme as each variable is divided by the number permutations executed for each variable and written to a data file asp-values. Thesep-values can then be quickly plotted in a histogram or other diagnostics in other software. If thep-values do not invalidate the test statistic, they can then be converted to FDR-controlling statistics such as q-values (Storey, 2003; Storey and Tibshirani, 2003; Storey et al., 2004), and used to create lists of interesting variables for further biological analysis.
input : input data matrix location in device memory
input : scratch work area location in device memory
input : result location in device memory
input : number of rows,columns,permutations
output: a count for each row in the data matrix. these represent the number of
randomly permuted test statistics that were more extreme than the test statistic observed for each respective row
forallpermutations doin parallel by thread block
1
initialize ordered column indices in shared block memory,S;
2
initialize random column indices in shared block memory,R;
3
forallcolumns doin parallel by thread within each block
4
store random column index inR;
5
end
6
one thread in each block shuffleS according to R;
7
foreachrow ido in parallel by thread within each block
8
permute rowiaccording toS;
9
calculate test statistic for permuted rowi;
10
if random permuted test statistic more extreme than observed then
11
increment count fori;
12 end 13 end 14 end 15
Test statistic functions
Any function of a data row can be used as a test statistic. Typical functions are usually measures of distance or similarity between treatment groups. These measures are then com-pared similarly to the more restricted contrasts approach in Analysis of Variance. A set of pre-coded test statistics for analyzing two- or three-factor experiments is provided in source code for custom applications, including comparisons of distance metrics such as Canberra dis-tance and Euclidean disdis-tance as well as comparisons of similarity measures such as Pearson, Spearman, or Kendall correlation. Equation 2.1 illustrates the use of Euclidean distance for a complex three-factor experiment. xijk is the abundance measured under the ith treatment for the first factor, the jth treatment for the second factor, and the kth treatment for the third factor. Here, the statistic T is essentially a measurement of the interaction between the first and second factors, in the Euclidean space of the third factor. More complex functions can be written into the source code in the well-labeled statistic function section for custom applications, providing test flexibility and complexity scalability.
TEucDist = s X k (x11k−x12k)2− s X k (x21k−x22k)2 (2.1)
Samples of typical program runs
Testing for speedup and correctness was conducted using simulated data as input. An R script (R Development Core Team, 2010) was written to simulate preprocessed abundance datasets of comparable size to 3-factor experiments found on PlexDB.org (Shen et al., 2005). To test for correctness, a linear model was used to simulate variable behavior through time in two factors. Equation 2.2 describes the linear model. One variable out of the 100 simulated was randomly selected to exhibit an interaction effect.
yijk = µ+αi+βj + (αiβj) +γk+ijk (2.2) where
(αiβj) = the effect of the interaction betweenαi and βj
ijk ∼ N(0,1)(Normally distributed random noise)
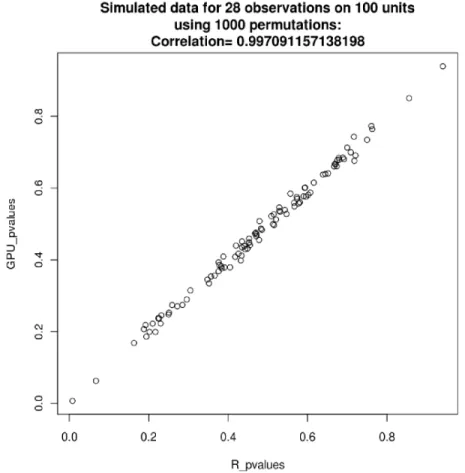
The model in Equation 2.2 was used to simulate 100 variables. These 100 variables were then analyzed using the GPU application with the statistic generated by Equation2.1permuted 1000 times for each variable. The same was done using an R script and the resulting p-values compared. The results were nearly identical, showing correct results from the GPU application. See Figure 2.3.
For speedup profiling, datasets were generated containing different population sizes (data matrix rows) and treatment population sizes (data matrix columns). The number of permuta-tions was also adjusted for testing. A much simpler model for simulation was used for these test to provide easy flexibility in the changing parameters (numbers of data matrix rows, columns, and permutations). Each measurement in the data matrix is simply a pseudo-random number sampled from a Uniform distribution between 0 and 1. Though this model is not realistic, it quickly generates a data matrix of any size for speedup profiling.
Compute time and memory usage for this application are affected by data size and the number of permutations requested. Speedup and GPU memory usage were profiled when increasing each of three values: The number of input data columns (treatments), the number of input data rows (variables), and the number of permutations generated.
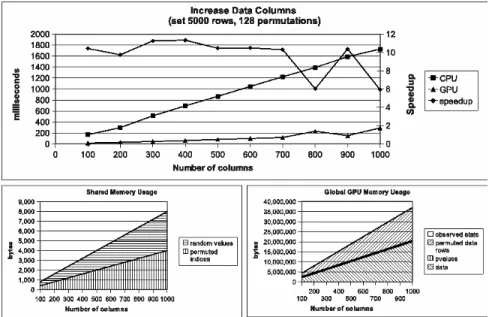
Figure 2.4 shows the profiling results when increasing only the number of data columns in input data. Speedup of over 10 is achieved except for two cases. It is unclear why 800 and 1,000 data columns consistently produced small speedup. These slow-downs occurred for many different randomly simulated datasets of different sizes. CUDA runtime register and memory usage details may hide the cause for this (see Corporation (2007)). Figures 2.5 and
2.6show profiling results when increasing the number of data rows and the number of requested permutations, respectively.
Specifications
This application uses both shared and global GPU memory such that usage is well within the bounds of most NVIDIA CUDA-supporting hardware. Concurrent memory accesses are coalesced to maximize random access bandwidth. Testing and speedup calculation was con-ducted using an Intel(R) Core(TM)2 CPU X6800 at 2.93GHz with 4096 KB cache and an NVIDIA GeForce 8800 Ultra GPU with 16 multiprocessors at 1.51 GHz with 768 MB global memory (804,585,472 bytes) and 16 KB shared memory per thread block (16,384 bytes).
Hardware requirements
1. NVIDIA CUDA graphics card with Compute Capability 1.0 or higher.
Software requirements
1. NVIDIA CUDA driver for the selected graphics card (available from NVIDIA.com). 2. NVIDIA SDK (available from NVIDIA.com).
Availability: This software source is available for on a Subversion (SVN) server at
https://subversion.vrac.iastate.edu/Subversion/RandTestGPU/svn/RandTestGPU/.
Note that it requires the NVIDIA SDK mentioned above. Support is available upon request.
Funding: This project is funded by the National Science Foundation Plant Genome
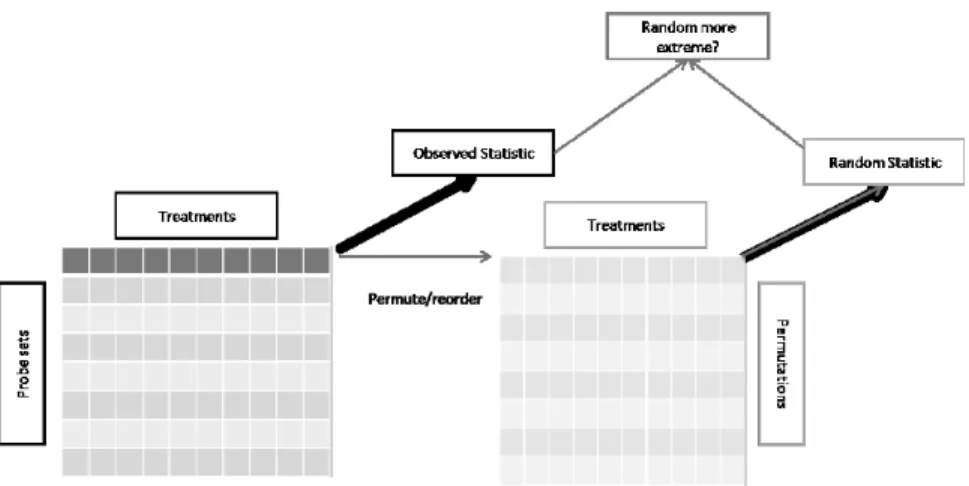
Figure 2.1 Each abundance profile is reordered (permuted) a large num-ber of times and then each permutation is used to calculate a random statistic which is then compared to the observed statis-tic. The right-hand block represents the set of permutations generated and processed for the first data row in the left-hand block.
(a) Tabular structure commonly representing preprocessed abundance data stored in a typical two-dimensional matrix. This is the un-transposed input data.
(b) The same 3x10 data table after transposition.
Figure 2.2 Transposing abundance data for column-major coalesced mem-ory accesses. Note that as the threads walk along their respec-tive variables, they are accessing contiguous cells in memory in
(b)and not in(a). Coalesced accesses require that the threads access contiguous cells in memory simultaneously.(Corporation, 2007)
Figure 2.3 Negligible differences in p-values were observed due to word size and randomization differences between the GPU and R approaches.
Figure 2.4 Wall clock time and speedup (top), shared memory usage (bot-tom left), and global device memory usage (bot(bot-tom right) when increasing the number of input data columns (treatments and/or replications). Speedup of 6-10X is achieved while oper-ating well within memory limitations.
Figure 2.5 Wall clock time and speedup (left), and global device memory usage (right) when increasing the number of input data rows (variables). Speedup of 10-12X is achieved while operating well within memory limitations. Shared memory usage does not change when changing only the number of input data rows.
Figure 2.6 Wall clock time and speedup when increasing only the number of permutations requested. Speedup of 12 is achieved. Memory usage does not change when changing only the number permu-tations.
3. PATHWAYACCESS: CELLDESIGNER PLUGINS FOR PATHWAY DATABASES
A paper published in Bioinformatics
John L. Van Hemert and Julie A. Dickerson
Abstract
Summary:
CellDesigner provides a user-friendly interface for graphical biochemical pathway descrip-tion. Many pathway databases are not directly exportable to CellDesigner models. Path-wayAccess is an extensible suite of CellDesigner plugins which connect CellDesigner directly to pathway databases using respective Java application programming interfaces (API’s). The process is streamlined for creating new PathwayAccess plugins for specific pathway databases. Three PathwayAccess plugins, MetNetAccess, BioCycAccess, and ReactomeAccess, directly connect CellDesigner to the pathway databases MetNetDB, BioCyc, and Reactome. Pathway-Access plugins enable CellDesigner users to expose pathway data to analytical CellDesigner functions, curate their pathway databases, and visually integrate pathway data from different databases using standard Systems Biology Markup Language (SBML) and Systems Biology Graphical Notation (SBGN).
Availability:
Implemented in Java, PathwayAccess plugins run with CellDesigner version 4.0.1 and were tested on Ubuntu Linux, Windows XP and 7, and MacOSX. Source code, binaries,
documen-CellDesigner (Funahashi et al., 2008) is a tool for graphically building biochemical pathway models which integrate model representation by Systems Biology Markup Language (SBML) (Hucka et al., 2003) with graphical representation by Systems Biology Graphical Notation (SBGN) (Le Novere et al., 2009). There exist many databases providing Application Program-ming Interface (API) libraries enabling programmatic queries. These API libraries include many biologically meaningful objects which carry out intuitive functions. For example, a Pathway object can report the set of Reaction objects it contains, a Protein Complex object can report the Monomer objects which contsruct it, and a Metabolite object might report its SMILES and InChi codes. The problem is that a Pathway object in one API is not the same as a Pathway object in the API of a different database; The same biological concept is represented using independently developed in-silico representations, preventing any single application from communicating and integrating across databases.
Functionality
PathwayAccess plugins directly interact with pathway databases so that the user can down-load one or more pathways to a CellDesigner model and updown-load (or commit) a CellDesigner model to a database. Figure3.1shows a dataflow diagram for typical use of the PathwayAccess plugins.
The PathwayAccess plugin framework confers three major benefits, depending on whether individual database API’s support data retrieval and modification. Firstly, the plugins make pathways stored in remote databases available to the powerful modeling and simulation func-tionality already provided by CellDesigner. Secondly, SBGN implemented by CellDesigner provides a standard representation for biologists to curate pathway databases; the user can create a pathway model and commit it to the database of his choice. A user can also download
Figure 3.1 Dataflow for PathwayAccess plugins. PathwayAccess plugins use respective APIs to communicate with different pathway databases and integrate data in CellDesigner. As indicated by arrows, depending on functionality supported by the data-source, dataflow is uni- or bi-directional.
a pathway model from a database, edit it, and commit it back to the database, either replac-ing the original pathway or creatreplac-ing a different version. Thirdly, CellDesigner can be effective in visually comparing and integrating pathway data from one or many different databases; metabolic networks can be downloaded directly into CellDesigner and integrated into custom super-pathways. CellDesigner can export pathways into files for loading into other software such as Cytoscape (Shannon et al., 2003), where SBGN is an ancilliary feature to network analysis functions.
Since CellDesigner and most datasources’ user interfaces provide good automatic layouts, layouts are left to the datasources and CellDesigner independently.
Pathway Integration Across Databases
When PathwayAccess plugins download pathways, they are integrated with the growing model in memory. CellDesigner is suited to support integration because it uses the XML-based SBML data model not only for file storage, but also for objects in memory– ideal for represent-ing annotations integrated from different sources. Among other annotations, PathwayAccess stores synonyms this way, enabling it to match integrated objects in the same subcellular compartment that may be named differently across databases. To prevent duplicate reactions in integrated pathways, a reaction hashing algorithm calculates a unique integer for every combination of reaction substrates, products, and catalysts (see Additional Material). Each
The PathwayAccess framework includes a core library plus one or more independent plug-ins. A plugin developer can easily create a new CellDesigner plugin which communicates with any pathway database providing a Java API. Simply create a new CellDesigner plugin object using the PathwayAccess library and define a set of simple database query operations, depend-ing on whether the plugin will support download and/or savdepend-ing a model to the database. To create a PathwayAccess plugin which downloads a pathway, define 18 simple functions such as get the synonyms of an object (pathway, metabolite, gene, etc). To design a commit fea-ture, define nine simple functions such as add substrates to a reaction in the database. With these simple operations defined for communicating with a database, PathwayAccess handles all interaction both with CellDesigner and the database, similarly to Cytoscape’s Data Integra-tion Request For Comments (Killcoyne and Pico, 2009), and provides a way to enrich objects beyond the annotation used for integration.
Examples
Three PathwayAccess plugins, MetNetAccess, BioCycAccess, and ReactomeAccess were created. In addition to representing biological objects differently, each uses a different com-munication protocol: SQL, Sockets, and Web Services, respectively.
BioCycAccess: Download and Commit to a PGDB. BioCyc databases are
in-dividually deployed for specific organisms and purposes (Karp (2005); Karp et al. (2005),
http://www.biocyc.org). BioCycAccess uses JavaCycO, our new library wrapped around the JavaCyc API (Mueller et al., 2005; Krummenacker et al., 2005), running in client mode to connect to a BioCyc Pathway Genome Database (PGDB) that is running JavaCycO in server mode. It supports both downloading and committing pathways.
ReactomeAccess: Download from Reactome. Reactome is a large repository for pathways (Vastrik et al., 2009). ReactomeAccess supports downloading pathways from Reac-tome directly into CellDesigner models via an API wrapped around ReacReac-tome’s Web Services.
MetNetAccess: Download and Commit to MetNet. MetNetAccess provides
CellDe-signer access to the pathway database MetNetDB using MetNetAPI (Sucaet and Wurtele, 2010), which is wrapped around SQL queries. It supports both downloading and committing pathways. MetNetDB is an integrated pathway database that currently includes Arabidopsis
thaliana, yeast, soybean, and the grapevine. MetNetAccess has been used to curate many pathways for different organisms in MetNetDB (Wurtele et al., 2007). MetNet allows public downloading of data, but only registered curators may modify data in MetNetDB.
Impact
The PathwayAccess suite of CellDesigner plugins is a powerful tool for researchers who work with metabolic pathway data and wish to take advantage of graphical and computational CellDesigner features. By directly accessing and publishing to pathway databases, decentral-ized pathway integration and comparison is made possible over simply saving and loading SBML files. While three PathwayAccess plugins have been released, the practical scope of the PathwayAccess library is as wide as the number of databases to which CellDesigner can connect because communication requires a Java API. MetNetAccess, BioCycAccess, ReactomeAccess and future PathwayAccess plugins enable CellDesigner users to expose pathway data to analyt-ical CellDesigner functions as well as visually integrate and curate pathway data from different databases using standard SBGN– something which has been previously prevented by disparate in-silico representations of biological objects.
Discussion of Technical Solutions
Preventing duplicate species
During an import, there are two sides to our solution: On the database side, a plugin must be able to retrieve all synonyms of a generic pathway object that is to become a CellDesigner species. The PathwayAccessPlugin abstract class requires all extending subclasses (which are the specific plugins, such as BioCycAccess) implement a function that retrieves all synonyms from its database for a given generic pathway object. If the database does not support syn-onyms, the plugin should at least return a list where the single member is the name of the generic object.
On the CellDesginer side, imported species must maintain a list of synonyms that is per-sistent through file saves. For this we designed a simple XML schema that is inserted into the CellDesigner Species Notes, which are seen on the botton right corner of the CellDesigner screen when a species is selected (see procedure AddAnnotation in Section3of this document). Using XML this way confers several benefits: 1) PathwayAccess annotations are easily parsed using the libSBML library, which is the core of CellDesigner, 2) CellDesigner models are saved in XML format by default, so the XML annotations fit nicely within these saved files and are persistent, and 3) our schema is simple enough that the PathwayAccess annotations are human-readable 4) PathwayAccess annotation remains attached to species object in CellDe-signer and SBML. There are two issues, however: 1) The SBML specification does not allow custom XML be added to the Notes field of objects, and 2) if a user adds other text to the Notes field of an object, PathwayAccess is unable to parse the XML. Despite these, issues, PathwayAccess plugins do perform their goals in CellDesigner as along as the user does not add text to the Notes fields of objects or mind seeing SBML warnings during model saves and loads. Also note that PathwayAccess considers object IDs and names specific to databases to
be synonyms as well, and IDs are always first searched in the existing model to find the same ID from the same database without searching synonyms.
Before a pathway is imported to a CellDesigner model, a dictionary of synoyms mapped to species objects is built from all existing species in the model, and used to look up speces by synonym (see procedure ImportPathway in Section3 of this document).
Preventing duplicate reactions
Even if duplicate species are created, duplicate reactions can easily appear when integrating overlapping pathways. Our solution represents the parts of a reaction (inputs and outputs) as a string and converts that string to a unique integer using Java’s hash code function for strings (see procedure ReactionHash in Section 3 of this document). The key is that we can build complete CellDesigner reactions in memory before adding them to the model on the screen. This way, we can build each imported reaction in memory, where its inputs and outputs (reactants, modifiers, and products) are species that have been either newly created or looked up using IDs and synonyms (if the reaction is indeed a duplicate, all inputs and outputs will have been found in the model and not created). CellDesigner assigns model-specific IDs to objects (species and reactions) per SBML standards, so we build the reaction parts-representing string using these SBML IDs. The type of the reaction is also added to the string. Currently, the location of the reaction is ignored because of the volatility of this annotation in different databases for reactions. The ID members of a reaction-representing string are always sorted before creating the hash value of their concatenation. This way, if a two reactions have exactly the same inputs and outputs and they are of the same reaction type, they have the same reaction hash value. See procedure ImportReaction in Section 3 of this document.
Before a pathway is imported to a CellDesigner model, a dictionary of reaction hash values mapped to reaction objects is built from all existing reactions in the model, and used to look up reactions by hash value (see procedure ImportPathway in Section3 of this document).
BioCycAccess
BioCycAccess uses our software, JavaCycO (http://vrac.iastate.edu/∼jlv/javacyc), to con-nect to a local or remote BioCyc database. Communication uses a socket protocol that issues Lisp code to and from the server, plus some special commands we developed for searching. JavaCycO operates in two modes: 1) client mode, and 2) server mode. Within the BioCycAc-cess plugin, JavaCycO operates in client mode. In client mode, JavaCycO maintains a cache of objects in local memory in the database so that their information need not be repeated loaded. To connect to a remote BioCyc database, BioCycAccess must communicate with a server running JavaCycO in server mode along with the PathwayTools software. In both modes, JavaCycO maintains a search cache mapping IDs, names, and synonyms to lists of objects in the database, which is used to lookup existing objects during a pathway commit to the database. If the client instance does not have a synonym in its cache, it asks the server instance to search for it. Since the server mode instance of JavaCycO is persistent across many clients, most clients will build their own cache by issuing search queries to the server; if a server mode instance of JavaCycO runs long enough and is used by enough clients, it will build a cache close to the complete database and become very fast when searching for synonyms.
ReactomeAccess
ReactomeAccess uses an API we designed that wraps around the webservice provided by Reactome.org to query its database. ReactomeAccess includes a custom connection object we designed to maintain a cache of Reactome objects as they are loaded via the webservice.
MetNetAccess
MetNetAccess communicates with MetNetDB using
MetNetAPI (http://metnet3.vrac.iastate.edu/api/), which is a collection of objects wrapped around SQL queries to the MetNetDB MySQL database. MetNetAccess leaves caching to MetNetDB, as MySQL databases do maintain query caches.
Committing a model to a database
Only PathwayAccess plugins that connect to databases supporting data modification can commit a CellDesigner model to the database. JavaCycO supports free data modification (only expose your development PGDBs to JavaCycO for now), so BioCycAccess can commit a model to a PGDB. MetNetAPI supporst data modification with user authentication, so MetNetAccess can only commit a model to MetNet if the user has logged into MetNetDB with a privileged user account. Reactome does not support data modification, so it is not an option for ReactomeAccess.
All PathwayAccess plugins must implement three object initialization functions: initialize a pathway, initialize a reaction, and initialize a species (aka ’entity’). Each of these functions take as input the analogous object from CellDesigner (CellDesigner model is to generic pathway object as CellDesigner reaction is to generic reaction object as CellDesigner species is to generic entity object) and first must search the database for the species in the database. Recall that all PathwayAccess annotation is available withing the CellDesigner species object because it is contained in the Notes field as XML; If the species came from the database, it’s database-specific ID is stored there, along with all names and synonyms from all databases it came from. Other database-specific annotations are stored there as well. For example, MetNetDB uses a confidence annotation, BioCyc databases provide a comment field, and both MetNetDB and BioCyc share an EC field for zero or more EC numbers. If a match is found, plugins must clear the object so that all information for it in the CellDesigner model can overwrite existing information about it in the database. Else, the plugin must create the object in the database and return it in an ’empty’ state, whatever that may mean for the particular database
PathwayAccess plugins must also implement functions to add inputs (reactants and modi-fiers) and outputs (products) to reaction objects in the database.
Database API’s manipulate biological object locally in memory and if they support modi-fiying the database, they provide some sort of object commit function that actually writes the object to the database. All PathwayAccess plugins must implement a commit object method that takes as input one of its generic pathway database objects and writes it to the database. See procedure CommitModel in Section 3of this document.
Pseudocode
The following procedures are the important operations in PathwayAccess that allow for integration from different databases as well as curation. See
http://vrac.iastate.edu/∼jlv/pathwayaccess/for documentation, binaries, and source code. This pseudocode is somewhat detailed to communicate exactly how and when the proce-dures interact. Note that all of these proceproce-dures are implemented in the PathwayAccess library and not in the plugins; new plugin developers never need to implement these procedures be-cause we have already done so and provided the PathwayAccess library for it. They only need to implement simpler database communication functions. In pseudocode below, these required functions are used when the procedures ”ask plugin to...” These statements are first listed to communicate the requirements for creating a new PathwayAccess plugin. See them in more de-tail by clicking the API Documentation link athttp://vrac.iastate.edu/∼jlv/pathwayaccess/.
Acknowledgement Thank you to Yves Sucaet and Eve Wurtele for developing
MetNe-tAPI and to Jesse Walsh for testing JavaCycO. This work is funded by the National Science Foundation Plant Genome Research Program, DBI 0604755, and EEC 0813570.
ProcedureCalls to plugin that developer must implement
// This is not a procedure, but the set of lines in the following procedures which ask the plugin for something.
GenericObjectsList ←ask plugin for all of genericPathwayObject’s reactions;
1
id ← askplugin for ID of genericReactionObject;
2
GenericObjectsList ←ask plugin for all of genericReactionObject’s reactants;
3
GenericObjectsList ←ask plugin for all of genericReactionObject’s modifiers;
4
GenericObjectsList ←ask plugin for all of genericReactionObject’s products;
5
id ← askplugin to retrieve its database’s unique ID of object;
6
name← ask pluginto retrieve the name of object;
7
type ←ask plugin to retrieve the CellDesigner type of object ; // CellDesigner constants
8
like SIMPLE COMPOUND or GENE
location ←ask plugin to retrieve the subcellular location of object;
9
Synonyms← ask pluginto retrieve any synonyms of object;
10
genericPathwayObject = ask pluginto intialize and commit the current CellDesigner model as
11
a pathway;
genericReactionObject← ask plugin to initializeReaction;
12
object ← askplugin to initialize and commit species;
13
ask plugin to addobject togenericReactionObjectas a reactant;
14
object ← askplugin to initialize and commit species;
15
ask plugin to addobject togenericReactionObjectas a modifier;
16
object ← askplugin to initialize and commit species;
17
ask plugin to addobject togenericReactionObjectas a product;
18
ask plugin to commitgenericReactionObject;
19
ask plugin to addgenericReactionObject togenericPathwayObject;
ProcedureImportPathway(plugin,genericPathwayObject,model)
input : a PathwayAccess plugin, plugin
input : a generic pathway object defined by theplugin’s database API,genericPathwayObject
// First, build a mapping from reaction hashes to reactions already in the model
initializeReactionHashes;
1
ReactionsList← ask current CellDesigner model for all existing reactions;
2
foreachReaction in ReactionsListdo
3
hash ←ReactionHash(Reaction);
4
add (hash ⇒Reaction) toReactionHashes;
5
end
6
// Next, build a mapping from species names and synonyms to species already in the model
initializeSpeciesDictionary;
7
SpeciesList← ask current CellDesigner model for all existing species;
8
foreachspecies in SpeciesListdo
9
foreach namein all NAME annotations for speciesdo
10
add (name ⇒species) to SpeciesDictionary;
11
end
12
end
13
// Next, begin importing generic reactions
GenericObjectsList ←ask plugin for all of genericPathwayObject’s reactions;
14
foreachgenericReactionObject in GenericObjectsList do
15
Reaction ← ImportReaction(plugin,genericReactionObject);
16
id ← ask pluginfor ID of genericReactionObject;
17
AddAnnotation(Reaction, ”plugin.ID”, id);
18
end
ProcedureImportReaction(plugin,genericReactionObject,ReactionHashes)
input : a PathwayAccess plugin, plugin
input : a generic reaction object defined by theplugin’s database API,genericReactionObject
input : a dictionary of reaction hash values mapped as keys to reactions in the model,
ReactionHashes. This is populated before every new download operation by reading
the XML node HASH stored in all reactions’ Notes attributes. See procedure ReactionHash.
output:result, either a newly created CellDesigner reaction object, or the matching reaction
that already exists in the model
result ← create new, empty CellDesigner reaction;
1
GenericObjectsList ←ask plugin for all of genericReactionObject’s reactants;
2
foreachobject in GenericObjectsList do
3
species ← ImportSpecies(plugin,object);
4
add species toresultas a reactant;
5
end
6
GenericObjectsList ← askplugin for all of genericReactionObject’s modifiers;
7
foreachobject in GenericObjectsList do
8
species ← ImportSpecies(plugin,object);
9
add species toresultas a modifier;
10
end
11
GenericObjectsList ← askplugin for all of genericReactionObject’s products;
12
foreachobject in GenericObjectsList do
13
species ← ImportSpecies(plugin,object);
14
add species toresultas a product;
15
end
16
hash← ReactionHash(result);
17
if ReactionHashes not contains key hash then // it is a new reaction
18
add result to current CellDesigner model;
19
add (hash ⇒result) toReactionHashes;
20
return result;
21
else // it is a redundant reaction
22
destroy result;
23
return ReactionHashes lookup hash;
24
end
ProcedureReactionHash(reaction)
input : a CellDesigner reaction, Reaction
output:hash, a unique integer for the type, reactants, modifiers, and products of Reaction
initializePartsList ; // a list of strings representing the parts of Reaction
1
add Reaction’s type to PartsList;
2
foreachspecies in all Reaction’s reactants, modifiers, and products do
3
add species ID toPartsList;
4
end
5
sort PartsList;
6
PartsString ← convert PartsListto a single concatenated string;
7
hash← JavaStringHashCode(PartsString); // Java’s hashing algorithm
8
return hash;
ProcedureImportSpecies(plugin,object)
input : a PathwayAccess plugin, plugin
input : a generic biological object defined by the plugin’s database API, object
input : a dictionary of names, synonyms, and database IDs, SpeciesDictionary.
output:result, either a new Species, or existing match. id ← askplugin to retrieve its database’s unique ID of object;
1
name← ask pluginto retrieve the name of object;
2
type ←ask plugin to retrieve the CellDesigner type of object ; // CellDesigner constant
3
location ←ask plugin to retrieve the subcellular location of object;
4
if location is unknown then
5
location ← cytosol;
6
end
7
Synonyms← ask pluginto retrieve any synonyms of object;
8
key ← ’plugin id’; // search for ID from same database
9
if SpeciesDictionary contains key then
10
result ← SpeciesDictionary lookupkey;
11
else
12
key ← ’location type name’; // search for name
13
if SpeciesDictionary contains key key then
14
result ← SpeciesDictionary lookupkey;
15
else
16
foreach synonym in Synonymsdo
17
key ← ’location type synonym’; // search for a synonym
18
if SpeciesDictionary contains key key then
19
result← SpeciesDictionary lookup key;
20 break; // be greedy 21 22 end 23 end 24
if result null then // No match found. Create a new species.
25
result ← create new species of type typeinlocation named name;
26
end
27
AddAnnotation(result, ”plugin.ID”, id));
28
AddAnnotation(result, ”plugin.NAMES”,name ∪Synonyms);
29
add to SpeciesDictionary mapping ’plugin id’⇒result;
30
add to SpeciesDictionary mapping ’location type name’⇒result;
31
foreach synonym in Synonymsdo
32
key ← ’location type synonym’;
33
add (key ⇒result) to SpeciesDictionary;
34 end 35 end 36 return result; 37
ProcedureAddAnnotation(sbase,label,Values)
input : a CellDesigner SBML object, sbase
input : an annotation label, label
input : a set of values to add under label,Values
// PathwayAccess annotations are stored by building a simple XML tree in the Notes attribute of a CellDesigner species or reaction:
// <List name="label part 1"> // <List name="label part 2"> // <Item value="Values item 1"> // <Item value="Values item 2"> // <Item value="Values item 3">
// label can be a hierarchy path such as "MyPlugin.NAMES"
LabelParts← split labelon delimiter (’.’);
1
notesXML ←get Notes attribute for sbase;
2
XMLtarget ← find XML List node innotesXML referred to byLabelParts;
3
if XMLtarget null then
4
XMLtarget ← build XML List node innotesXML referred to byLabelParts;
5
end
6
add Valuesas XML Items under XMLtarget;
ProcedureCommitModel(plugin)
input : a PathwayAccess plugin, plugin
organism← ask user to select organism from those in plugin’s database;
1
ask the plugin to validate the model for commit; // this is where MetNetAccess checks
2
for privileged user authentication if invalid then
3
show error message;
4
return;
5
end
6
genericPathwayObject = ask pluginto intialize and commit the current CellDesigner model as
7
a pathway;
ReactionsList← ask current CellDesigner model for all existing reactions;
8
foreachReaction in ReactionsListdo
9
genericReactionObject← ask plugin to initializeReaction;
10
foreach species in Reaction reactants do
11
object ← ask plugin to initialize and commitspecies;
12
ask plugin to add object togenericReactionObjectas a reactant;
13
end
14
foreach species in Reaction modifiers do
15
object ← ask plugin to initialize and commitspecies;
16
ask plugin to add object togenericReactionObjectas a modifier;
17
end
18
foreach species in Reaction products do
19
object ← ask plugin to initialize and commitspecies;
20
ask plugin to add object togenericReactionObjectas a product;
21
end
22
ask plugin to commitgenericReactionObject;
23
ask plugin to add genericReactionObjecttogenericPathwayObject;
24
end
BIOCHEMICAL PATHWAY NETWORKS
A paper to be submitted to Nucleic Acids Research
John L. Van Hemert1,2,3 and Julie A. Dickerson1,2,3,4
Abstract
Analysis of Omics experiments generates lists of entities (genes, metabolites, etc) selected based on specific behavior. Functional interpretation of these lists usually entails some sort of catorgy enrichment tests using functional annotations like Gene Ontology terms. We present a method for interpreting Omics lists in the context of metabolic pathway and regulatory networks using directed stochastic modeling of the networks themselves. We also present web tool for using our method and a proof of concept application to anE. coli transcriptomics data set where we used the web tool to confirm common knowledge of the importance of Lipid A and posit a model for E. coli response to Lipid A deprivation. Intuitively, the main theme is response to osmotic stress, but we also were able to detect other responses that are supported by the literature.
Introduction
Analysis of Omics experiments generates lists of entities (genes, metabolites, etc) selected based on specific behavior. Common practice is to leverage existing functional knowledge of
1
Electrical and Computer Engineering
2Bioinformatics and Computational Biology 3
Iowa State University, Ames, Iowa
the entities in a list by further listing the functional annotations assigned to the members of the list. Category enrichment analysis generally refers to testing the null hypothesis that the distribution of functional annotation in the entity list is similar to the distribution of functional annotation for all entities (Nettleton et al., 2008; Barry et al., 2005; Subramanian et al., 2005; Maere et al., 2005). If that hypothesis is rejected, one or more of the functional annotations in the entity list is either over- or under-represented, and a general functional response or perturbation is inferred for the experimental treatment and specific test used to generate the entity list. For example, most plant biologists mine a number of sets of genes from results that exhibit an expected behavior of biological interest and then map the selected genes to static functional annotation and then manually or computationally determine which functions are associated with the behavior in the experiment (Nettleton et al., 2008), (Maere et al., 2005). Knowledge is often digitally stored as networks, whether it is ontological (Ashburner et al., 2000; Cordero et al., 2009; Avraham et al., 2008) or biochemical (e.g., Reactome (Vastrik et al., 2009), KEGG (Okuda et al., 2008), PathwayTools/BioCyc (Krummenacker et al., 2005), and MetNetDB (Wurtele et al., 2007)). This makes functional analysis much more complex than simple set comparisons, requiring more complex tools like MapMan (Thimm et al., 2004; Rotter et al., 2009; Usadel et al., 2009), Array2KEGG (Kim et al., 2010), or KEGG Spider (Antonov et al., 2008) to name a few. Most plant pathways are stored in AraCyc, PlantCyc (both BioCyc Pathway Genome Databases (PGDBs)), and MetNetDB. These resources provide web-based access to simple pathway visualizations, searching, links to other databases, as well as some basic analysis tools.
Category enrichment is unable to directly infer causality; if a functional annotation term is enriched in an entity list, we cannot determine whether the function is somehow causing the perturbation of the members of the entity list, or members of the entity list are themselves a response to some other signal and the enriched function is a response to the entities.
At the same time, biochemical pathway models are accumulating in central repositories such as BioCyc, MetNetDB, Reactome, and KEGG databases. These pathway models use and assign functions to entities by placing them in networks of chemical reactions. Pathway
Our purpose in this work is to provide a methodology and tool for discriminating groups of entities (Response Groups) in a pathway network which are highly connected to a Query List
of entities which results from a previous selection from Omics data. Such a tool has several requirements:
1. Receive as input a biochemical pathway network structure
2. Receive as input a Query List of entities referred to by nodes in the pathway network. En-tities in a Query List could be any combination of genes, enzymes, chemical compounds, or reaction events in the pathway network.
3. Receive as input a definition of Response Groups to discriminate. Response Group compartmentalization must be flexible; Response Groups can be the set of all functional pathways in the network, all reactions in the network, or the set of all compound classes in the network, for example.
4. Response Groups must be able to overlap on entities; Entities, both members and non-members of the Query List, must be able to be non-members of multiple Response Groups. 5. The set of all Response Groups need not cover then entire pathway network; not all
nodes in the pathway network are guarranteed to be a member of any Response Group.
Background Terminology
A graph or network is a set of vertices or nodes connected by a set of edges.
A connected component in a graph is a set of nodes and edges where there is a path