Nitrogen efficiency in practical
agriculture – fundamental processes
and how to control them
Conference at the
Royal Swedish Academy of Agriculture and Forestry
April 12
th1999
Each author is responsible for his own article The report is prepared in collaboration with
Contents
PrefaceIngemar Öhrn, Thomas Rosswall and Jan Persson ... 7
Some aspects of nitrogen use efficiency in arable agriculture
A. E. Johnston ... 9
Prospects for manipulating crop residues to control nitrogen mineralisation-immobilisation in soil
Erik Steen Jensen ... 25
Carbon and nitrogen dynamics as well as nitrogen utilization in dependence on soil texture
Martin Körschens ... 43
Flows and transmission of nitrogen in grassland systems: Problems and approaches
Steve C.Jarvis ... 59
Demonstration of the application of the environmental protection plan for protection of the ground water in three water catchment areas
Hans Spelling Oestergaard ... 81
Managing nitrogen in dairy farming systems
Frans Aarts, B. Habekotté and H. van Keulen... 89
Policies to reduce nitrogen loss from agriculture in England
John Archer ... 103
List of participants ... 111
Previous issues are listed on the third page of the cover
Preface
On the occasion of His Majesty the King of Sweden celebrating his 50th birthday in 1996 the three Scientific Academies and the Feder-ation of Industries in Sweden celebrated the event by starting a fund that the King decid-ed to use for science technology and the en-vironment, especially concerning renewable resources. The soil biology group of the De-partment of Soil Sciences at the Swedish Uni-versity of Agricultural Sciences (SLU) was one of the first to get a grant from the fund and as a result The Swedish Royal Academy of Forestry and Agriculture (KSLA) in colla-boration with The Swedish University of Ag-ricultural Sciences invited prominent agricul-tural scientists to a seminar concerning Nitro-gen Efficiency in Practical Agriculture. The group consists of a couple of young scientists working with soil biology problems from the-oretical as well as practical points of view. The aim of the seminar is in close harmony with the objectives of the fund, as well as fall-ing within the framework of SLU and KSLA. The seminar not only concerned cost efficien-cy in the nitrogen effect on quantity and qual-ity of the products, but also the effect on the surrounding environment. The seminar was of an international character as almost all of the invited speakers were guests from foreign countries. In that way we hope to create new contacts and new impulses for the future. The seminar also aimed at being a starting point of a research project, Nitrogen Efficiency and Nitrogen losses – improvements in practical agriculture, initiated by the Foundation for Swedish Research in Plant Nutrition, operat-ing within the framework of KSLA.
Nitrogen efficiency in practical agriculture is a topic of extreme importance,
particular-ly with regard to identification of where the real problems are to be found. This is why, in this seminar, it is so important to really use available knowledge – to try to synthesise it in a coherent fashion – which is also impor-tant in basic policy-making. It is not only for a scientist to synthesise our knowledge for dis-cussion without the scientists, but it is equal-ly important to take that information and reach out into society at large, be it at govern-ment level, municipal level or the individual farmer. So what are the limitations to the transfer of scientific knowledge to practical solutions? Sometimes it is because the scien-tists have not formulated the first question properly. They are interested in the involve-ment of science but not perhaps in solving a particular problem. And we also speak in sci-entific jargon that is not easily understood by policy-makers. We must understand the pol-icy process as much as the polpol-icy-makers must understand the scientific process. And, of course, the end result should be incentives for changes in the management at the individ-ual farm, hopefully through good examples, and more carrots than sticks.
So today we are faced with the question of whether we can produce enough for the growing population without negative environ-mental impacts. Can we assume that food is really accessible to everybody – thereby pro-viding food security? The mission statement of the Swedish University of Agricultural Sci-ences was established by the Government about four years ago after long strategy dis-cussions within the university and involving environmental actors. It states that we should develop Man’s understanding in the sustain-able use of biological natural resources. This
is very different from the case 10 or 15 years ago, when the question was to maximise pro-duction.
Today, in agriculture and in forestry, the scientific community and the farmers talk about equal ways of reaching production goals as well as environmental conservation goals. Thus, the sustainable approach must go through what the university does – re-search, education, continuous environmental assessment, or information exchange and extension. At present, equal emphasis is not given to production goals and environmental goals.
The theme of today’s discussion is how ef-ficiently one can use nitrogen that is present in the soil, nitrogen that is built into the soil, and nitrogen provided through the addition of manure, organic matter or fertilisers. Of key interest are global changes and changes in the composition of the atmosphere. Addi-tionally, we may touch upon the research that is ongoing in Sweden into wetlands and the establishment of wetlands as nitrogen sinks,
primarily with the aim of getting the nitrogen into the air rather than into the waterways, together with the removal of N-rich residues and careful irrigation.
This brings us back to the interrelationship between basic and applied science, illustrat-ing the importance of givillustrat-ing basic sciences an equal weight. We must ensure that govern-ments realise that the need to finance basic science is an absolute necessity in providing a platform for solving practical problems. Today’s discussions may be held in the light of the recently published Swedish Govern-ment’s Commission recommending that all applied science should be moved and merg-ed with basic science in the funding struc-ture.
Finally, we may once again assert that there is no applied science if there is no sci-ence to be applied.
Ingemar Öhrn Thomas Rosswall Jan Persson
Some aspects of nitrogen use efficiency
in arable agriculture
A.E. JOHNSTON
Professor IACR-Rothamsted, Harpenden Herts, UKIntroduction
Today there is an essential need to use nitro-gen (N) fertilizers to achieve both economic yields at the farm level and to produce enough food to feed the rapidly increasing world population. It is equally important to consider issues about the environmental im-pact that the excessive use of N may have. Learning how to use N most efficiently will help to reconcile these two different needs. This paper considers some aspects of N use efficiency in arable agriculture.
Historical background
Against the background of the widespread use of N fertilizers in agriculture today it is not easy to recall that even in the 1830s there was still uncertainty about the source of N for plants. It was known that plants acquired their carbon, hydrogen and oxygen from car-bon dioxide and water. Elements like phos-phorus, potassium, calcium, magnesium, sil-icon and chlorine, the mineral elements,
found in plant ash were known to be taken up from the soil. But whether the plant got its N from the ammonia in the atmosphere or the vast reserve of N2 gas in the atmosphere or from the soil was a matter of conjecture.
J.B. Lawes, owner of the Rothamsted estate near Harpenden, some 40 km north of Lon-don, had been an undergraduate at Oxford before returning to Rothamsted in 1834. While at Oxford, Lawes must have been influ-enced by Professor C.C. Daubeny whose re-searches at Oxford from the early 1820s on-wards ended a very barren period in the de-velopment of agricultural science. Daubeny stressed the need for experiments in agricul-ture and after he had returned to Rothamst-ed, Lawes made some experiments on small plots in the field and in pots of soil in 1837 and 1838. He compared the effects of equal weights of N supplied by different nitroge-nous salts on the growth of cabbages and tur-nips (both used as animal feed). Lawes came to three important conclusions, i) ammonium phosphate ”to be one of the most powerful manures known”, ii) ”applying ammonium salts to a soil deficient in minerals is useless”,
iii) ”on soils well supplied with minerals the ammonia from the atmosphere will be insuf-ficient to give good yields of agricultural crops” (Lawes, 1842, 1843).
Points i) and ii) were probably among the first to recognise interactions between nutri-ents. The soils at Rothamsted at that time would have been very deficient in phospho-rus (P). Current attempts to improve N use ef-ficiency require that all nutrients must be optimum as must pathogen control (for ex-amples see Figs. 2.1 and 2.2, Johnston, 1994). Point iii) was clear from the results, yields of cabbage without N were 10.4 kg/25 plants, yields with ammonium phosphate were 46.7 kg/25 plants. Point iii) supported Justus von Liebig’s contention in his initial report (Lie-big, 1840) to the British Association for the Advancement of Science. He noted that the ammonia in the atmosphere was not suffi-cient for the purposes of agriculture. By infer-ence from this statement he must have decid-ed that plants did not use N2 gas directly. The report was published as a book throughout the years that followed and in the 3rd edition
published in 1843 Liebig changed this state-ment and wrote that ammonia in the atmos-phere was quite sufficient for the purposes of agriculture. The first harvest of winter wheat in 1844 on Broadbalk at Rothamsted dis-proved this changed view. The largest yields were obtained where ammonium salts were applied. Subsequently the Broadbalk results were confirmed by those from other experi-ments. But Liebig found it difficult to change his views and the controversy between Lawes and Gilbert at Rothamsted and Liebig at Giessen on the source of N for plants rum-bled on for some 20 years (Johnston, 1991a). However, controversy rather than consensus can sometimes be a greater stimulus to con-tinued research, and this may be one reason why some of the experiments started by Lawes and Gilbert at Rothamsted between 1843 and 1856 still continue.
Nitrogen cycles
Liebig was probably the first to suggest an N cycle (Liebig, 1840). It was very simple. De-caying vegetable and animal matter in and on the soil released ammonia into the atmo-sphere and rain then washed this ammonia back into the soil where it was used by plants. Today, developing N cycles of varying com-plexity has become something of an industry but as long as they are properly constructed they offer hope in helping to improve N effi-ciency in agriculture.
At the farm and field level all components of the appropriate N cycle must be consid-ered. But first it is instructive to consider some of the major changes and their magni-tude as indigenous vegetation has been re-placed by arable cropping in the temperate regions. Figure 1 shows that the N cycle in both systems has many components in com-mon. The important changes are in the use of manures and N fertilizers in arable cropping – the amount will vary appreciably from site to site – and the much larger amounts of N removed in the harvested produce – often to places a very long distance away from where the crop was grown.
Under indigenous vegetation much of the N in the standing biomass would be returned to the soil either in plant debris or animal dung. The conversion of a soil under indige-nous vegetation to one under arable cropping invariably results in a loss of N as soil organ-ic matter declines (for examples see John-ston, 1986, 1991b). There will also be chang-es in the quantitichang-es of N moving between components within the soil.
Much research in recent years has been devoted to understand the N cycle in the crop-soil system. As knowledge has im-proved, the complexity of the components and the pathways of movement involved have become apparent. Additionally, esti-mates of the amounts of N in both compo-nents and pathways have been made. This is
Figure 1. A comparison of the nitrogen cycle under indigenous vegetation and under arable cropping. The importance of crop residues and biological nitrogen fixation for indigenous vegetation and ma-nures and fertilizers for arable cropping is highlighted (based on a personal communication from B.T. Christensen).
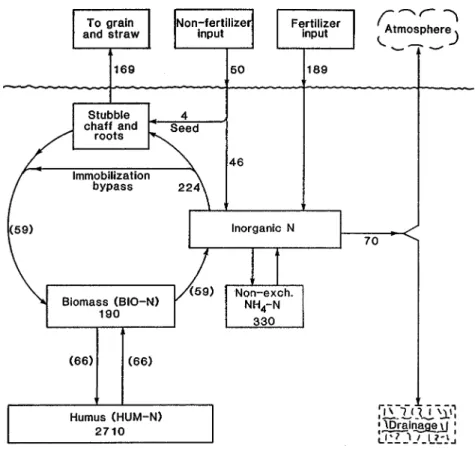
often best done on soils where the level of soil organic matter is not changing greatly be-cause this is the largest N component in the soil system. For example, Jenkinson and Par-ry (1989) published Fig. 2 for Broadbalk plot 9 given NPK fertilizer (nominally 192 kg N ha-1) where the soil organic matter content
has changed little in the last 100 years. The annual offtake of N in grain plus straw (169 kg ha-1) and the annual addition of fertilizer N
(actually 189 kg ha-1) were data from 15N
ex-periments done on this plot in 1980 and 1981 (Powlson et al., 1986). In this 15N experiment
the fertilizer N was always applied to an ac-tively growing crop so as to minimise the risk of N loss by leaching. Powlson et al. (1986) also estimated an additional, non fertilizer, annual net N input of about 50 kg ha-1 (the
value used in Fig. 2). Fig. 2 shows amounts of N in other components and pathways, for details see Jenkinson and Parry (1989). How-ever, it was not possible to say how much of the 70 kg N ha-1 which was unaccounted for
was lost by leaching and how much to the atmosphere.
Much recent work has been done to try to partition more precisely the N losses on
Broadbalk between leaching, denitrification, volatilization and immobilization by K.W.T. Goulding and his group at Rothamsted. In part, this has been made possible by im-proved techniques and by the replacement of the underdrainage system on a part of the experiment in autumn 1993 so that leaching losses can be more accurately monitored. In addition, the soil solution has been sampled for analysis with permanently installed po-rous cups. Denitrification, ammonia volatili-zation, atmospheric inputs and mobilisation/ immobilisation have also been measured at various times between 1990 and 1998. Losses of nitrate by leaching varied greatly between the 1990/91 and 1997/98 drainage seasons and ranged from 7 to 64 kg ha-1 (mean 30 kg
ha-1). This suggests that less than half the 70
kg N ha-1 unaccounted for in Fig. 2 was lost by
leaching from this arable soil with a predom-inantly unchanging level of soil organic mat-ter. The majority of the remaining N which was unaccounted for was lost by denitrifica-tion (perhaps 80%) and the rest by volatiliza-tion.
Much larger losses of N were recorded on the farmyard manure (FYM) plot (Goulding,
personal communication). According to John-ston et al. (1989) the input of N to this FYM plot has varied only a little around a mean value of 225 kg ha-1 in 35 t ha-1 FYM. To this
should be added the 50 kg N ha-1 input from
other sources (Powlson et al., 1986). (Previ-ously Johnston et al. (1989) used 30 kg N ha-1
as the input from other sources. As neither value was measured directly either could be used but the larger value (50 kg) will be used here making a total N input to the FYM plot of 275 kg ha-1 each year. Johnston et al. (1989)
estimated the amount of N unaccounted for during each of three periods, 1852-61,
1892-Figure 2. Nitrogen cycle under continuous winter wheat grown in the Broadbalk experiment, Rothamsted
and receiving 192 kg N ha-1 each year since 1968. All N transformations are assumed to take place
in the plough layer (0-23 cm). Many of the figures were derived from 15N-labelled fertilizer
experi-ments made between 1980 and 1983; figures within boxes are kg N ha-1 (mean of all four years);
figures between boxes are the means of 1980 and 1981; figures in parentheses are calculated from the model described by Jenkinson and Parry (1989).
1901, 1970-78. Using the larger input from other sources, i.e. 50 kg N ha-1, the average
an-nual amount of N unaccounted for was 140, 155 and 145 kg ha-1 respectively. These very
similar amounts of N are because initially yields and N offtakes were small but soil or-ganic matter was increasing rapidly immobi-lising much N. Recently yields and N offtakes have much increased but soil organic matter is increasing only slowly. Goulding (personal communication) has estimated an annual leaching loss of about 60 kg N ha-1 and
denitri-fication of about 110 kg N ha-1, estimated from
plots where both leaching and denitrification were measured. This 170 kg N ha-1 accounts
for more than the 140 to 155 kg N ha-1 which
was unaccounted for as discussed above and highlights the difficulty of getting accurate N balances unless all inputs and outputs are measured with reasonable precision.
Nitrogen losses
By the early 1970s in the UK there were an increasing number of reports of increasing concentrations of nitrate (NO3) in potable waters taken from both aquifers and surface supplies (for example see papers in MAFF 1976). These were considered to be due di-rectly to the increasing use of N fertilizers and there were predictions of a nitrate time bomb, especially awaiting the percolation of nitrate-loaded leachate into aquifers. However, Syl-vester-Bradley et al. (1987) made estimates of the N applied to winter wheat and N offtake by the crop grown in England and Wales us-ing: i) Survey of Fertilizer Practice data for N use on winter wheat; ii) the national average grain yields of winter wheat for England and Wales from MAAF statistics (allowance was made for N in straw based on the proportion of straw removed from fields), and iii) a %N based on grain protein concentrations from survey data obtained by the Home-Grown Cereals Authority. The authors showed that the application of N to winter wheat did not appreciably increase above the amount of N harvested in the crop until the mid 1980s. Why therefore had NO3 levels in potable wa-ters begun to increase in the early 1970s?
One very plausible explanation was the ploughing up of grassland in the UK during and after the 1939-45 war. The proportion of arable crops to the total area of crops and permanent grass had increased from about 38% between 1930-35 to 48% in 1940 and then to 60% in 1945. Between 1950 and 1970 the proportion ranged between 55 and 58%. The
likely effect of ploughing grassland on N loss-es can be deduced from two experiments at Rothamsted when grassland, with about 3% C in the soil, was ploughed (Johnston, 1986). In both experiments crops were grown in rota-tion. In one experiment during six years there were three cereals, two root crops and a one-year grass ley. In the first 30 one-years about 30% of the soil carbon was lost. In the other exper-iment there were two cereals and four root crops in six years and the decline in soil C was even larger, about 40% in the first 20 years. Even where the smaller amount of or-ganic matter was lost, the annual loss of N in the first 12 years averaged about 130 kg N ha-1. If all this N had been available during the
growing period, the amounts were much larg-er than those which the cultivars grown at that time could have used. The certain role of soil organic matter in N losses was estab-lished.
Improvements in the efficiency
of nitrogen fertilizer use
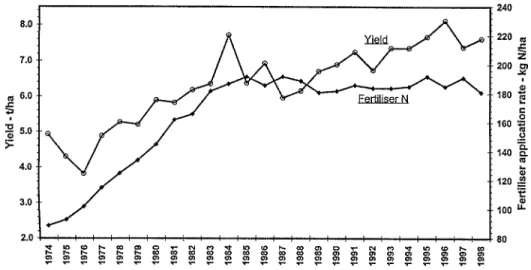
Without doubt there have been improve-ments in N use efficiency in recent years as shown by the data for the winter wheat crop in England and Wales (Fig. 3). Between 1974 and 1998 the average national yield increased from 5.0 to 7.5 t ha-1 grain. Initially in this
pe-riod, N use also increased rapidly from about 85 kg ha-1 in 1974 to about 185 kg ha-1 in 1984;
since then N use has remained largely un-changed. Thus, grain yield per unit of N ap-plied, i.e. N use efficiency, has improved since 1984. This improvement in yield might, how-ever, have been accompanied by a lower grain % N.
The most accurate way of assessing N use efficiency is to use 15N labelled fertilizer but
this is costly. Much more widely used is the difference method:
% recovery = N uptake with N minus N uptake without N x 100 N applied
This method is probably acceptable in many cases where the experiment is done on a soil with a uniform history and there is a true control. When there is a true control, N recoveries calculated by the difference meth-od are often similar to those using 15N labelled
fertilizer (Macdonald et al. 1997; Glendining et al. 1997; Powlson et al. 1986). However, when there is no true control, as when using data from soils with a long continued history of different N treatments, then N recoveries by the crop using 15N are very different from
those calculated using the difference method. For example, Powlson et al. (1986) showed for Broadbalk data, averaged for 1980 and 1981, that the recovery by winter wheat grain plus straw of 144 and 192 kg N ha-1 was 82 and 76%
respectively by the difference method but only 56 and 56% respectively when using 15N.
This discrepancy between the two methods is because when estimated by the difference method, % recovery is very dependent on the
amount of N taken up by the crop to which none is applied.
However, comparisons between periods using the difference method are valid on Broadbalk because the crop grown continu-ously and given no N has removed similar amounts of N annually for many decades. Throughout its long history some plots have always received the same amount of N and % recovery has improved markedly since the 1960s (Table 1). This is mainly due to the in-creased yields of current cultivars and their improved grain:straw ratios with grain %N being much larger than straw %N. The data in Table 1 also well illustrate the points about economic and environmental issues. Applying 96 kg N ha-1 to Cappelle Desprez in 1970-78 was
econmically justifiable as was applying 192 kg N ha-1 to Brimstone in 1985-87. But, based on
the % recoveries in Table 1, applying 96 kg N ha-1 to Cappelle Desprez left only 36 kg N ha-1
unaccounted for. While applying 192 kg N ha-1
Figure 3. Yield of winter wheat, grain t ha-1, and fertilizer nitrogen use, kg N ha-1, on winter wheat in England
and Wales 1974-1996 (personal communication from Chris Dawson and Associates based on data from the British Survey of Fertiliser Practice and Ministry of Agriculture, Fisheries and Food Sta-tistics).
Table 1. Percentage recovery of fertilizer nitrogen applied to winter wheat grown continuously on Broad-balk, Rothamsted.
Period Cultivar N applied, kg ha-1
48 96 144 192 % recovery* 1852-71 Red Rostock 32 33 32 29 1966-67 Squarehead´s Master 32 39 36 -1970-78 Cappelle Desprez 56 63 59 52 1979-84 Flanders 69 83 76 69 1985-87 Brimstone 67 77 67 57 Nitrogen applications
1852-71, all in autumn as equal weights of ammonium sulfate and chloride 1966-67, 24 kg ha-1 in autumn remainder in spring as ammonium sulfate
1970 and since, all in spring as calcium ammonium nitrate
* Determined by the difference method
to Brimstone left 83 kg N ha-1 unaccounted for,
i.e. more than twice as much.
When N is applied to a soil, the crop and soil microbial population are in competition for the N. The effect of the long-continued use of inorganic N fertilizers on soil organic N re-serves has been reviewed by Glendining and Powlson (1995). For example, in the Broad-balk experiment, the residue of some 20,000 kg ha-1 fertilizer N, applied annually at 144 kg
ha-1 since 1843, has increased total organic N
by only about 700 kg ha-1 in the top 23 cm soil
compared to a total of 2900 kg ha-1 organic N
in the soil to which no fertilizer N has been applied. The mineralisation of this organic N increased the N content of winter wheat by 41 kg ha-1 (Shen et al. 1989). Glendining and
Powlson (1995) also noted that although the increases in mineralised N from the extra or-ganic matter tend to be modest, they should be taken into account when recommending N fertilizer applications. The Broadbalk soil data also show that the extra soil organic matter on plots given fertilizer N had reached a new stable equilibrium level within a few decades (Jenkinson, 1977; Johnston, 1969). When soils have reached their equilibrium level of soil organic matter then any input is matched by an equal output.
The use of labelled N, although more cost-ly, does allow some additional information to be obtained. Powlson et al. (1986) reported results using 15N labelled fertilizer on the
win-ter wheat on Broadbalk (Table 2). Nitrogen unaccounted for (total applied minus that in grain, straw, chaff, stubble and soil) averaged 19% (range 8-27%). Little of the N was proba-bly lost by leaching in spring because the N was applied to an actively growing crop and in three of the four years there was insuf-ficient rainfall to cause through drainage. Using data from a number of Rothamsted experiments, Addiscott and Powlson (1992) showed that in many cases the major path-way of N loss in spring was denitrification.
Pilbeam (1996) reviewed 15N experiments
on rain-fed winter wheat across a wide range of soil and climatic conditions and found that, on average, 20% (range 10-30%) of the applied
15N labelled fertilizer could not be accounted
for. Whatever other considerations might apply, this is a financial loss to the farmer. Determining the loss processes and consider-ing ways of preventconsider-ing the loss would greatly improve N use efficiency.
Table 2 shows that, on average, about 20% of the 144 kg N ha-1 applied to winter wheat
fertilizer-derived N was nearly all in three fractions, stubble and crowns, soil microbial biomass and soil organic matter. Less than 2% was present as nitrate at risk to loss by leaching. Many other experiments on cereals have shown that less than 5% of the applied fertiliz-er N was present in the soil as nitrate at har-vest when the nitrogen was applied at the re-commended amount and time (Macdonald et al. 1989). On a sandy loam soil, an experiment had plots with a range of organic matter
con-Table 2. Percentage distribution at harvest of fertilizer-derived nitrogen applied at 144 kg N ha-1 labelled with
15N, Broadbalk, Rothamsted
Year % fertilizer nitrogen in
Grain Straw Soil Unaccounted for
1980 55 13 17 15
1981 37 16 20 27
1982 45 23 24 8
1983 44 13 16 27
Mean 45 16 19 19
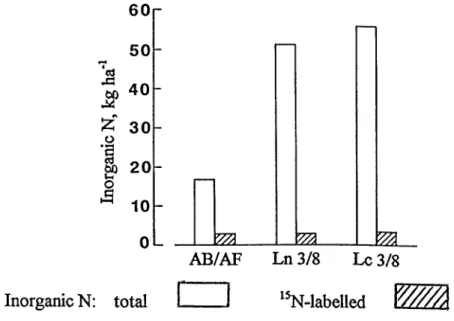
Figure 4. Inorganic nitrogen in soil (0-50 cm) following the harvest of winter wheat to which 140 kg ha-115
N-labelled N fertilizer had been applied in April. The wheat was grown in contrasted rotations: AB and AF, all arable cropping; Ln, grass leys given fertilizer N and Lc, grass-clover leys without ferti-lizer N. The leys were ploughed after 3 (Ln3 Lc3) or 8 (Ln8 Lc8) years.
tents and using 15N showed that all soils had
very little labelled nitrate in them at harvest. But there was much more unlabelled mineral N in the soils with more organic matter fol-lowing leys than in the soils after arable crops (Fig. 4) (Macdonald et al. 1989). Again, when 144 kg ha-115N labelled fertilizer was applied
to spring barley on soils with 0.100 and 0.298% total N, the total inorganic N in the soil at harvest was 34 and 69 kg ha-1 respectively.
N was only 1.6 and 3.2% of the 144 kg N ha-1
applied as fertilizer to the soil with least and most organic matter respectively (Glendining
et al. 1997). Thus, much of the nitrate in the soil in autumn came from the mineralisation of soil organic matter. The 15N experiments
showed that for cereals it was not the organ-ic matter formed during that year whorgan-ich was breaking down quickly. When the soils were sampled 12 months later, following a second cereal crop, more than 90% of the labelled organic N measured the previous autumn was still in the soil. Much of the nitrate must have come from the mineralisation of much older reserves of organic matter.
These small amounts of nitrate left as an unused residue from an N fertilizer applica-tion in cereal experiments do not necessarily apply to all arable crops. There are often much larger residues after say potatoes and many vegetable crops. However, in many tem-perate climates cereals are the predominant arable crop and, in general, if N fertilizers are applied at the appropriate time and in the correct amount they are used efficiently as estimated by the amount of mineral N remain-ing in soil at harvest. Usremain-ing N fertilizer gives small increases in soil organic matter from which modest amounts of N can be mineral-ised and this must be allowed for in N recom-mendations. Again it must be emphasised that improvements in N fertilizer use effici-ency will come from both quantifying the amount of N lost by the various pathways in different farming systems and attempting to minimise these losses, and from improved N fertilizer recommendations.
Fertilizer nitrogen
recommendations
In recent years, much effort has been expend-ed in attempts to improve fertilizer N recom-mendations. They have included allowing for the yield and protein potential of the site,
es-timating or measuring soil mineral N prior to the fertilizer application, and using chemical extractants to estimate the organic N which might be mineralised. The calculations are often computer-aided to allow the inclusion of as many variables as possible. Today, for winter sown cereals it is frequently suggested that the total quantity of N recommended is applied in two or three applications.
Recently Poulton and Johnston (personal communication) have summarised data for N responses by winter wheat (10 years) and spring barley following the winter wheat (9 years). The winter wheat was grown in a rota-tion of all arable crops or following 3 or 8 years of either grass-clover leys or an all-grass ley given fertilizer N, i.e. potentially there was a wide range of mineralisable or-ganic N in the soils of this experiment. Four N rates were tested on each crop and from the fitted response curves for both cereals each year, the optimum economic yield (Yemax) and its associated N application (Nemax) were cal-culated. These values, determined by exper-iment, were compared with the N fertilizer recommendations using Bulletin 209 (MAFF 1994). This is a standard source of recom-mendations in the UK and for N, an index sys-tem (0, 1, 2) is used. This is based on previous cropping and recommendations vary with soil type. For winter wheat the yield potential of the site is an additional factor. Poulton and Johnston used the known mean yield of win-ter wheat over the 10-year period in each ro-tation as the yield potential for that soil. The average values for Nemax for the 10 years of wheat data and 9 years of barley data were very close to the N recommendations derived from Bulletin 209 (Table 3). Thus, the average recommendation given by Bulletin 209 was excellent. There were discrepancies, how-ever, in individual years. The number of years when the determined Nemax was larger than, sufficient or less than, the recommended N application (± 10 kg ha-1) is shown in Table 3.
Table 3. Comparison of the amount of fertilizer N recommended by RB209(1) with the amount needed to achieve economic maximum yield as estimated by curve fitting. Ley-Arable experiment, Woburn, 1981-1991.
Winter wheat(2), first crop after Spring barley(3), second crop after
AB & Ln3 & Lc3 & AB & Ln3 & Lc3 &
AF Ln8 Lc8 AF Ln8 Lc8
N Index(4) 0.5 1.0 1.5 0 1 1
Expected yield(5), t ha-1 7.5 7.5 8.0 - -
-Recommendation, kg N ha-1 168 150 130 125 90 90
Mean value for Nemax(6) 166 144 124 132 94 92
Number of years when Nemax(7) was: smaller than 9 10 8 4 4 5 the same as 7 4 7 6 8 9 larger than 4 6 5 8 6 4 the recommended application ± 10 kg ha-1
(1) Fertilizer Recommendations for Agricultural and Horticultural Crops. Reference Book 209 (MAFF, 1994) (2) Winter wheat, 1981-90, 10 years data each for Ln3 and Ln8; Lc3 and Lc8
(3) Spring barley, 1982-91 (excluding 1983). Nine years data each for Ln3 and Ln8; Lc3 and Lc8 (4) Based on previous cropping as defined in RB209
(5) Based on the average estimated economic maximum yield (to the nearest 0.5 tha-1) from the fitted
response curve
(6) Mean N
emax; winter wheat, 1981-90; spring barley 1982-91 (excluding 1983)
(7) Based on the amount of N associated with the estimated economic maximum yield each year
was Nemax within ± 10 kg N ha-1 of the N
recom-mendation. The recommendation was too large in about 45% of the observations for wheat and 24% of those for barley. It is not yet possible to offer a good explanation for this variability although it was clearly due to var-iability in Yemax between years. This has vari-ous practical implications. If the yield was larger than the assumed potential yield, then the penalty could be a lower than expected grain %N. If the risk of this happening can be realised soon enough then foliar applications of N can be used to increase grain %N. If the yield was smaller than the assumed potential yield, then it is likely that a greater than usu-al amount of N would be unaccounted for. Lower than expected yields could be due to adverse weather or increased disease
inci-dence. Neither can be predicted with preci-sion.
If the variability in Nemax is only due to the N supply, then it must be related to the availa-bility of soil N by mineralisation of organic N. In this experiment, annual N uptake for all no N treatments varied from 18 to 118 kg ha-1 for
winter wheat and from 9 to 83 kg ha-1 for
spring barley. The average treatment mean for the 10 years of wheat ranged from 48 (con-tinuous arable) to 91 kg ha-1 (after the grass
clover ley). For spring barley the values were 32 to 65 kg ha-1 for the same treatments,
spectively. The best way to estimate such re-lease would be by a model which could pre-dict the release of mineral N from soil organ-ic matter up to say anthesis. Because miner-alisation is partly dependent on temperature
and moisture, some reliable long term weath-er forecast would be required. A model for N release by mineralisation would be applicable to all crops.
For cereals, there is another complicating factor, namely the ability of the crop to pensate i.e. fewer tillers are frequently com-pensated for by heavier grain mass but with-out necessarily requiring more N.
In a 16-year study of the growth and yield after anthesis of winter wheat grown on Broadbalk, Thorne et al. (1988) observed that grain yield was closely related to the number of grains m-2. But this property depends on
the number of ears m-2 and grains per ear,
both of which depend on the survival of shoots and florets. This survival is influenced in the few weeks before anthesis, after the main N application is given, by a variety of factors of which N supply is only one. If this is generally true, then predicting N need for ce-reals will be liable to errors unless other fac-tors like water, temperature and radiation which influence shoot and floret survival can also be predicted. This does not mean that the search for a reliable N recommendation system should be abandoned. Rather it im-plies that when comparing or validating sys-tems there must be sufficient observations on crop growth throughout the season to ex-plain any variations in response to those which were predicted.
The future and nitrogen
recommendations
Soil analysis
Many extractants and methods have been suggested for the analysis of soils to estimate the likelihood of a crop responding to N but few have been adopted for routine use. Sam-pling soil to 90 to 100 cm in spring and analys-ing for mineral N (nitrate plus ammonium) has been proposed and used successfully occasionally. However, the large number of
cores required to minimise soil heterogenei-ty makes the analysis expensive. In England and Wales it is usually only recommended when it is thought that there may be large residues of mineral N from previous cropping or manure application and any financial sav-ings made by decreasing the fertilizer N appli-cation would offset the cost of the analysis.
Modelling
Annual, site specific recommendations for N are all important. Because of the numbers involved such recommendations will have to be computer generated and based on reliable models. Besides factors like the site yield potential, any reliable computer system will have to successfully simulate the quantity of N mineralised from soil organic matter after the time that a decision has to be made about the size of the final N application. The Roth-amsted SUNDIAL-FRS (Fertilizer Recommen-dation System) aims to do this (Bradbury
et al. 1993, Smith et al. 1996). The required amount of N can be divided between a num-ber of applications depending on the appear-ance of the crop or non-destructive measure-ments made on it.
Other approaches
Nitrification inhibitors are again being active-ly researched to find lower cost products. If effective over appropriate timescales, single rather than split N applications would be pos-sible. Another alternative would be a slow re-lease fertilizer with the rate of rere-lease closely matched to crop demand. This might involve fertilizers with different release characteristics for different crops. Where irrigation is used fertigation must become the preferred option. As a backup to N fertilizer recommenda-tions, non destructive plant analysis methods are being developed to monitor the N status of the crop throughout the growing season. This will allow more accurate decisions about late N top dressings. A hand-held device can be used to determine the chlorophyll content
of the crop (Schepers et al. 1992). A large number of estimates can be made quickly on leaves at the same stage of development giv-ing a reliable mean value. Such monitors are being used commercially in Europe by, for example, Hydro Agri. Hydro Agri are develop-ing the opportunity for the further use of this concept by linking chlorophyll sensors mounted at the front of a tractor to a rear mounted, variable rate fertilizer spreader through a computer installed in the tractor cab. As the tractor passes through the crop, the N rate is adjusted according to the sensor readings via the computer software. Other reflectance measurements are being investi-gated for other nutrients. The main concern is to ensure that there is no interference from factors like water stress, nutrient imbalance or foliar disease which may affect the reflect-ance measurement.
Whether the driving force for improving N use efficiency is economic, environmental or a combination of both, it is essential that re-search continues to improve N recommenda-tions and determine the pathways of loss of N from the soil-plant-animal system. It will also be essential to quantify the possible losses by each pathway. This must be done in well con-ducted experiments in which all possible loss pathways are monitored. Considering only one possible process at a time and develop-ing practices to minimise loss by that way ignores the interactions between path-ways. Minimising losses by one pathway in-variably increases losses by another. The need is for experiments to measure and inte-grate all loss processes at the same site over several years and develop economic proce-dures to lessen the total loss.
References
Addiscott, T.M. and Powlson, D.S. 1992. Parti-tioning losses of nitrogen fertilizer between leaching and denitrification. Journal of
Ag-ricultural Science (Cambridge). 118:101-107.
Bradbury, N.J., Whitmore, A.P., Hart, P.B.S. and Jenkinson, D.S. 1993. Modelling the fate of nitrogen in crop and soil in the years fol-lowing application of 15N labelled fertilizer
to winter wheat. Journal of Agricultural Science (Cambridge). 121:363-379.
Glendining, M.J. and Powlson, D.S. 1995. The effects of long continued applications of in-organic nitrogen fertilizer on soil in-organic nitrogen – a review, pp. 385-445. In: R. Lal and B.A. Stewart (eds.) Soil Management: Experimental Basis for Sustainability and Environmental Quality. CRC Press Inc., Boca Raton, USA.
Glendining, M.J., Poulton, P.R., Powlson, D.S. and Jenkinson, D.S. 1997. Fate of 15
N-la-belled fertilizer applied to spring barley grown on soils of contrasting nutrient sta-tus. Plant and Soil. 195:83-98.
Jenkinson, D.S. 1977. The nitrogen economy of the Broadbalk experiments. I. Nitrogen balance in the experiment. Rothamsted Ex-perimental Station Report for 1972, Part 2, pp. 103-110.
Jenkinson, D.S. and Parry, L.C. 1989. The ni-trogen cycle in the Broadbalk Wheat exper-iment: A model for the turnover of nitrogen through the soil microbial biomass. Soil Bi-ology and Biochemistry. 21:535-541. Johnston, A.E. 1969. Plant nutrients in
Broad-balk soils. Rothamsted Experimental Sta-tion Report for 1968, Part 2, pp. 93-112. Johnston, A.E. 1986. Soil organic matter,
ef-fects on soils and crops. Soil Use and Man-agement. 2:97-105.
Johnston, A.E. 1991a. Liebig and the Rotham-sted experiments, pp. 37-64, In: G.K. Judel and M. Winnewisser (eds.) Symposium ”150 Jahre Agrikulturchemie”. Justus Lie-big-Gesellschaft zu Giessen, Giessen. Johnston, A.E. 1991b. Soil fertility and soil
organic matter, pp. 299-313. In: W.S. Wilson (ed.) Advances in soil organic matter re-search: the impact on agriculture and the
environment. Royal Society of Chemistry, Cambridge.
Johnston, A.E. 1994. The Rothamsted Classi-cal Experiments, pp. 9-37. In: R.A. Leigh and A.E. Johnston (eds.) Long-term experi-ments in agricultural and ecological scienc-es. CAB International, Wallingford. Johnston, A.E., McGrath, S.P., Poulton, P.R.
and Lane, P.W. 1989. Accumulation and loss of nitrogen from manure, sludge and com-post: long–term experiments at Rothamst-ed and Woburn, pp. 126-139. In: J.A.A. Hansen and K. Henriksen (eds.) Nitrogen in organic wastes applied to soils. Academic Press, London.
Lawes, J.B. 1842. Ammoniacal Manure. The Gardener’s Chronicle 2 April 1842, London. Lawes, J.B. 1843. Ammonia. The Gardener’s
Chronicle 7 October 1843, London. Liebig, J. von. 1840. Organic Chemistry in its
Application to Agriculture and Physiology. Tayler and Walton, London.
Macdonald, A.J., Poulton, P.R., Powlson, D.S. and Jenkinson, D.S. 1997. The effects of sea-son, soil type and cropping on recoveries, residues and losses of 15N-labelled fertilizer
applied to arable crops in spring. Journal of Agricultural Science (Cambridge). 129: 125-154.
Macdonald, A.J., Powlson, D.S., Poulton, P.R. and Jenkinson, D.S. 1989. Unused nitrogen fertilizer in arable soils – its contribution to nitrate leaching. Journal of Science, Food and Agriculture. 46:407-419.
MAFF 1976. Agriculture and Water Quality. Her Majesty’s Stationery Office, London. 469 pp.
Pilbeam, C.J. 1996. Effect of climate on the recovery in crop and soil of 15N labelled
fertilizer applied to wheat. Fertilizer Re-search. 45:209-215.
Powlson, D.S., Pruden, G., Johnston, A.E. and Jenkinson, D.S. 1986. The nitrogen cycle in the Broadbalk Wheat Experiment – recov-ery and losses of 15N-labelled fertilizer
ap-plied in spring and inputs of nitrogen from
the atmosphere. Journal of Agricultural Science (Cambridge). 107:591-609.
Schepers, J.S., Francis, D.D., Vigil, M. and Be-low, F.E. 1992. Comparison of corn leaf ni-trogen and chlorophyll meter readings. Communications in Soil Science and Plant Analysis. 23:2173-2187.
Shen, S.M., Hart, P.B.S., Powlson, D.S. and Jenkinson, D.S. 1989. The nitrogen cycle in the Broadbalk wheat experiment: 15N
la-belled fertilizer residues in the soil and in the soil microbial biomass. Soil Biology and Biochemistry. 21:529-553.
Smith, J.U., Bradbury, N.J. and Addiscott, T.M. 1996. SUNDIAL: a PC useable system for simulating nitrogen dynamics in arable land. Agronomy Journal. 88:38-43.
Sylvester-Bradley, R., Addiscott, T.M., Vaidy-anathan, L.V., Murray, A.W.A. and Whit-more, A.P. 1987. Nitrogen advice for cere-als: Present realities and future possibili-ties. Proceedings No. 263 The Fertiliser Society, York, UK. 36 pp.
Thorne, G.N., Darby, R.J., Day, W., Lane, P.W., Welbank, P.J. and Widdowson, F.V. 1988. Variation between years in growth and nu-trient uptake after anthesis of winter wheat on Broadbalk field at Rothamsted, 1969-84. Journal of Agricultural Science (Cam-bridge). 110:543-559.
Questions to A. E. Johnston
Erik Steen Jensen: I will ask you about these data you presented from Pilbeam. I find it dif-ficult to understand that there should be such a general relationship, like finding 20 percent of the fertiliser nitrogen not being accounted for. Do you have any suggestion why such relationship should exist?
A. E. Johnston: I think that is the challenge. Let me say, and perhaps I didn’t mention it earli-er, that if you look at the individual data be-tween those different sites, which vary very
considerably in the water input, the amount of labelled nitrogen which was in the crop, and the amount of nitrogen which was in the soil, vary very considerably in conditions in which there were small amounts of rainfall, there was a little in the crop because the crop yields were small, and there was much re-maining in the soil. But, certainly yes, 20 per-cent on average. I would say that there is a variation, but there were two outliers. Most of them seem to come about that line of 20 per-cent. I have no idea, but I think this is the chal-lenge, the challenge is to find out where that 20 percent has gone. And I mean, we thought about it a lot at Rothamsted and the 15N data
I showed for the four years, there was some variability between years. And the years in which we found most nitrogen which we couldn’t account for, were the years in which there had been an excessive amount of rain after the N had been applied and so we as-sumed that most of that had actually been lost. But we think we know that there was no actual leaching loss on those plots in that year so there must have been a gaseous loss at that time. Of course, what is important is whether that gaseous loss was N2O or wheth-er it was gaseous nitrogen, N2.
Erik Steen Jensen: So, you don’t think it could be related to the 15N methodology actually,
since I guess all these experiments were be-ing done usbe-ing 15N.
A. E. Johnston: Yes, they were all done using
15N. If it was the methodology, we have all
spent a lot of time doing things that we might regret, but hopefully it was not the methodol-ogy. Clearly you can get a good balance. So no, I hope it wasn’t the methodology, if it was, a vast range of laboratories in different parts of the world have all gone wrong.
Niels Erik Nielsen: Was it assumed in all these cases that there was no pool substitution of nitrogen 15 in the crop with the atmosphere.
A. E. Johnston: Yes, as far as I am aware, that assumption was made.
Niels Erik Nielsen: Ok, but that seems to be rather dynamic, is that not so?
A. E. Johnston: I think there is a problem of whether we are doing the calculations in the right way, and there has been just a couple of papers recently from Germany, which are suggesting other ways of doing this calcula-tion rather than by the difference method. I am not sure whether they are right, but the added nitrogen interaction has been some-thing that has been creating a considerable stir for a long period of time. But I think you can say with the 15N experiments of course, if
you do the job properly, if your analytical techniques are good, you should get the right answer. Because as long as you are measuring what is in the soil, what is in the crop, if you can measure what is lost by leaching and if you can measure what is lost by denitrifica-tion, which is very difficult for both of those, you should get a mass balance which is right. So even if there has been some pool substitu-tion, then we should see it in the soil. It should come out in the soil analyses. The grave concern, of course, is whether it has been any loss from the plant which we haven’t measured, but still it would appear the loss section, it would appear as the nitro-gen which has not been accounted for, I mean that should be the beauty of 15N. It gets over
all these problems of not knowing whether we are losing from the crop, if we are losing from the soil, or whether we are losing by gaseous or by leaching.
Göte Bertilsson: You compared the recom-mendations with the actual economic return in the experiment. Now when you calculate economics, it is quite important what prices you use, and especially in the quality eco-nomics of today. It may differ very much and also depending on what you consider, if you
consider the cost of application and the cost of using the harvest, so to say. Do you have any comment on that?
A. E. Johnston: I think I just tended to use what we have used for many years which is a standard set of figures which has included only the value of the grain versus the cost of the nitrogen, but clearly the differential cost of putting on a small amount of nitrogen is very small.
Göte Bertilsson: Wouldn’t that lead to an over-estimation of the recommendation? A too high recommendation.
A. E. Johnston: It might, but I think basically, if you are going to go down the line and try to put everything into your economics, it be-comes extremely difficult, and of course, we are soil scientists and not economists, so I’ve taken a simple view as being a way forward and just try to use it to illustrate the fact that average values are extremely good. I mean John Archer was involved many years ago with a number of others in a sort of national average recommendations and clearly they ought to be right. I mean they are based on the average yields and average responses in the last forty odd years, so we would expect the average values to be right. I mean, they have been constantly upgraded, but we would expect them to be right. But the prob-lem is explaining why they are not right eve-ry year. Why in some years the tion is too low, some year the
recommenda-tion is too high, and that seems to relate to the level of yield that we get. The level of yield we get seems to relate to factors that, at the moment, we do not attempt to put into any sort of modelling exercise. We don’t attempt to model effect of weather on yield, or pests and diseases, which are equally important. But we’ve got to take it that in those particu-lar experiments, we did our very best to con-trol pests and diseases. So we are really look-ing, I think, in those experiments that were largely effects of weather on yield. And I have to say that we have tried to put together enough data to challenge the modellers, to see whether they could have modelled it bet-ter on an annual basis than we achieved in experiments. But I think that what that set of data shows is that there is no point in going any more down the line of annual model ex-periments, unless we are prepared to do a lot more detailed monitoring of the growing crop throughout the whole of the growing season, like Gillian Thorn and her colleagues did in the experiments on Broadbalk. I mean, there is a huge number of man-hours that went into that. Series of work that involved people from many different disciplines, physiologists, soil chemists and agronomists – it was very ex-pensive, but it is the only way forward. It is no good any more just doing straightforward response trials, we are wasting time and mon-ey if we do that. We have got to know what the crop responded to in each of the years in which we do it, and why the crop fails to grow, and why it grows better then we would otherwise have expected.
Prospects for manipulating crop
residues to control nitrogen
mineralisation-immobilisation in soil
ERIK STEEN JENSEN
1, 2Professor
1Department of Agricultural Sciences
The Royal Veterinary and Agricultural University
Taastrup, Denmark
and Per Ambus2
2Plant Biology and Biochemistry
Depart-ment
Risø National Laboratory Roskilde, Denmark
Abstract
Crop residues are an important resource for maintaining soil fertility in agro-ecosystems. Nitrogen cycles of agricultural ecosystems are known to be more open compared to cy-cles in natural systems, cause more N to be lost to the atmosphere and the aquatic envi-ronment. Despite decades of research on car-bon-nitrogen cycling in plant soil systems, only limited practical progress in terms of controlling N losses and closing the N-cycles of agro-ecosystems seems to have taken
place. Crop residues, especially those with a high C/N ratio, are tools, which may be used to controlling the N mineralisation-immobili-sation turnover in soil. It is eminent that cere-al straw causes net immobilisation of N in the autumn during their decomposition, but the extent of N conservation is disputed. This paper presents some new methods of using cereal residues to manage soil N in autumn and winter. Special emphasis is on the effects of physical modification of residues and the manipulation of spatial distribution of incor-porated residues.
Introduction
Cultivation of soil causes the soil nitrogen (N) cycle to be more open than in a natural or semi-natural ecosystem with permanent plant cover, and agricultural soils are thus more prone to N losses. Despite a significant research effort for more than half a century, ’untimely nitrate’ is still a major problem re-lated to agricultural soils. Soil scientists ap-parently have not been successful in trans-forming basic knowledge on C and N dynam-ics in the soil-plant-atmosphere system into significant practical advances regarding N use and losses for the farmer and the environ-ment.
Improved synchronisation of N release, crop demand and uptake is possibly the main key to improving the N use and reducing the losses to the wider environments. Relevant management tools for optimising this syn-chrony are the timing of soil tillage and ferti-lization, crop residue quality and manage-ment of the interactions between tillage and residue quality. Crop residues are an impor-tant resource in a sustainable agricultural system, but for many years this fact was neg-lected. The farmer considered the residue a problem, and the main concern was how to get rid of it in the most convenient way, e.g. by burning in the field.
In the short-term incorporation of crop res-idues provides the energy and nutrients for microbial growth and activity, and are thus the driving force of the mineralisation-immo-bilisation (MIT) processes in the soil and a source of N for plants (Jansson and Persson, 1982). In the long-term incorporation of crop residues is important for the maintenance of organic C and N in arable soils (Campbell and Zentner, 1993; Rasmussen and Parton, 1994). Thousands of laboratory incubations and a large number of field experiments have con-tributed to a better understanding of the ef-fects of residue biochemical quality, e.g. sol-uble substances, C/N ratio, lignin,
polyphe-nols, and of abiotic and biotic factors on de-composition, net N mineralisation, soil organ-ic matter formation, dynamorgan-ics of the morgan-icrobi- microbi-al biomass, gaseous losses etc. The soil tem-perature and moisture content, the availabi-lity of inorganic nutrients, especially N, and the quality of the residues are the most im-portant factors in determining the rate of resi-due turnover and the net mineralisation of N (Jenkinson, 1981; Mary et al., 1995). We can now model and better predict the process rates and we are beginning to understand gross fluxes of N transformations (e.g. Recous et al., 1999)
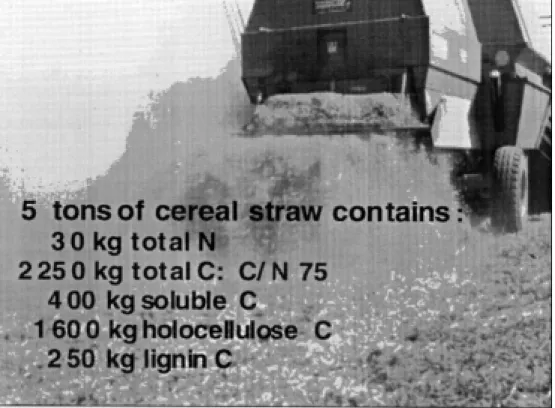
Five tons of cereal straw contains about 2250 kg carbon of varying composition (Fig. 1). This carbon may potentially be used more efficiently in controlling process rates in N cycle. It is well known that crop residues with a high C/N ratio, such as cereal straw,´ may cause net immobilisation of N to occur for a long period (e.g. Jensen, 1996a). In laborato-ry incubations, with non-limiting inorganic N concentrations and ground cereal straw, net immobilisation is often found to 35-40 mg N kg-1 C added in cereal straw or 12-16 kg N t-1
straw (Recous et al., 1995; Ambus and Jensen, 1997). However, in field experiments and un-der N-limited laboratory conditions net im-mobilisation are typically 2-4 kg N t-1 cereal
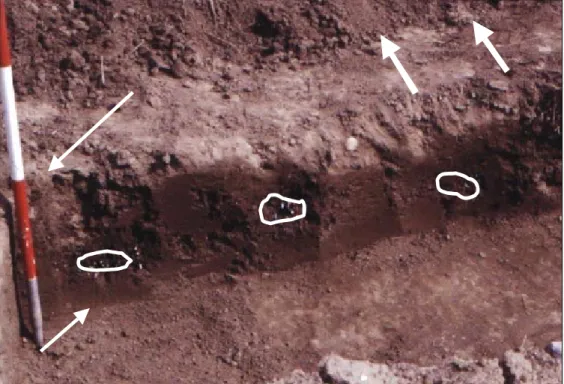
straw (Christensen, 1986; Jensen, 1996a;b). The contact between crop residues and soil is modified via mechanical operations, such as chopping/milling and tillage/incorpo-ration method. Studies of plant residue turn-over at the laboratory scale involve grinding of the material to increase the homogeneity of residue distribution in the soil matrix and reduce sub-sampling error. This is an artificial situation compared to the heterogeneous dis-tribution of field-incorporated residues. Nor-mal field incorporation of straw involves har-rowing and ploughing. These operations will often cause an uneven distribution of the resi-dues in the soil. The contact between residue and soil influences the decomposition and
Figure 1. The carbon and nitrogen within crop residues constitute an important resource for maintaining soil fertility. However, the residue carbon can be managed more efficiently in controlling the N mineralisation-immobilisation turnover in soil.
the effect of residues on N-cycle processes, especially during the early stages of decom-position (Sørensen et al., 1996; Angers and Recous, 1997; Ambus and Jensen, 1997, Jen-sen and Ambus, 1998). Apparently, there is scope for manipulating the straw, e.g. the par-ticle size, the time of incorporation and distri-bution in the soil profile, to control minerali-sation-immobilisation turnover of N in soil.
The aim of this paper is to review some methods to manipulate crop residue and to present data on the effect of these methods on soil N dynamics.
Potential manipulations of
crop residues and their effects
on MIT
The crop residue quality is an important fac-tor in determining the effect on MIT. The qual-ity may be changed genetically by modern plant breeding methods and by the fertiliza-tion of the crop. Similarly, the crop residue quality may be modified by mixing residues of different qualities from different fields or grow plant species with different residue quality as intercrops. The distribution of re-sidues is normally heteroge2neous within the field, e.g. due to the combiner placing straw in rows and the harrowing tool collecting
clumps etc. Physical modification is another method for manipulating the straw. Today most combiners are equipped with cutting devices to comminute the residues, but par-ticles could potentially be smaller than the typical 5-10 cm. New incorporation methods and machinery can be used for modifying the distribution of the straw in the soil profile.
Modification of crop residue quality by breeding and nutrient management
Plant breeding has led to a significant in-crease in the harvest index of cereals (re-duced straw biomass), whereas the nutrient concentration in old and new cereal cultivars seems to be comparable (Sandfær et al., 1965). This causes the potential amount of N to be recycled, when growing new cultivars, to be low. However, cereals are supplied with high amounts of fertilizers and there is often
0
0.2
0.4
0.6
0.8
1
0
50
100
150
200
N-fertilizer (kg N/ha)
%N in straw
W. Barley
S. Barley
W. Wheat
S. Wheat
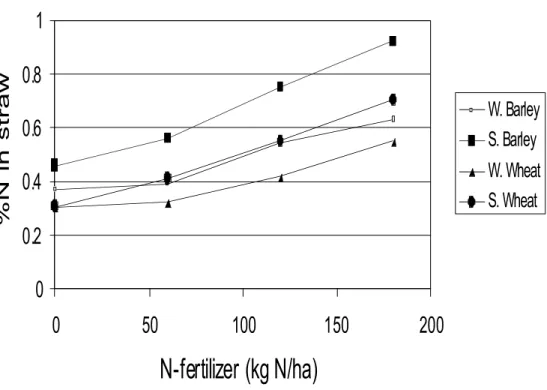
Figure 2. Nitrogen concentration in straw of winter and spring forms of wheat and barley. Results are meanof four years experiments on a sandy loam soil at Risø National Laboratory (Data from Andersen et al., 1991).
a linear relationship between N-fertilizer supply and N concentration in crop residues (Fig. 2).
Modern plant breeding can be used to modify the nutrient concentration in crop residues as well as the composition of the carbon in the materials, e.g. genetic engineer-ing can modify the lignin or polyphenol con-tents. Similarly the nutrient concentration in the residues may be diminished or enhanced by various breeding method. However, nutri-ent managemnutri-ent is probably the most realis-tic tool in this context, but the link between crop residue concentration and crop yields clearly will influence the room for manipula-tions. It is clear however, that a reduced N supply will also reduce the nitrogen concen-tration of the straw and hereby also increase the potential for net immobilisation during straw decomposition (Jenkinson, 1981).
Quantity of residues incorporated
The crop above-ground crop residues in a field may be removed, as was previously done by burning. In some regions a major part of the cereal straw is used in animal pro-duction. More recently, removing the straw for energy production has become popular in some areas as well. Continuous removal of the cereal straw has implications for the or-ganic carbon and nitrogen content of the soil, as well as other biochemical features and the soil aggregation (Power and Doran, 1988). It may have interest to remove certain crop re-sidues, e.g. low C/N ratio residues from grain legumes or sugar beet leaves, which when incorporated in the autumn, may contribute to an increased net mineralisation and risk of N leaching (Jensen, 1996b; Thomsen and Christensen, 1996). Such residues could be used alternatively as animal feed and the nu-trients recycled via the animals.
The effect of increasing the amount of cere-al straw incorporated, however, may decom-position of the straw (Parr and Papendick, 1978). Clearly a high loading rate at N-limiting conditions will cause a prolonged period of decomposition and net immobilisation. At normal rates of straw incorporation it is con-sidered that the soil inorganic N available is sufficient to meet the N demand of the micro-flora for decomposition (Christensen, 1986).
Mixing of residues with different quality
It is often suggested that the mixing of residue of different quality may be a relevant means of controlling the dynamics of crop residue turnover and nutrient release (e.g. Vanlauwe et al., 1997) and that the diversity of residue may have unrealised effects on agro-eco-system function (Wardle et al., 1997). Some studies have shown that combining residues of different quality may cause idiosyncratic response as compared to the single residue turnover of C and N (Wardle et al., 1997). There is several cases in agricultural systems, where residues of different qualities are
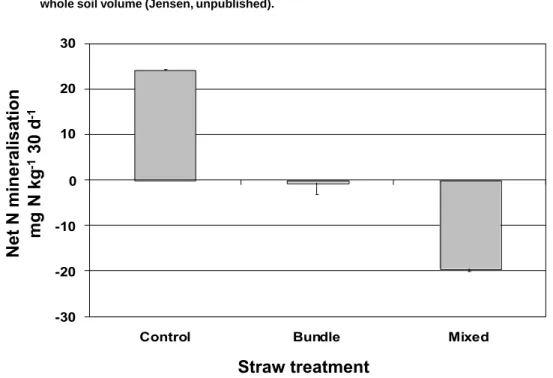
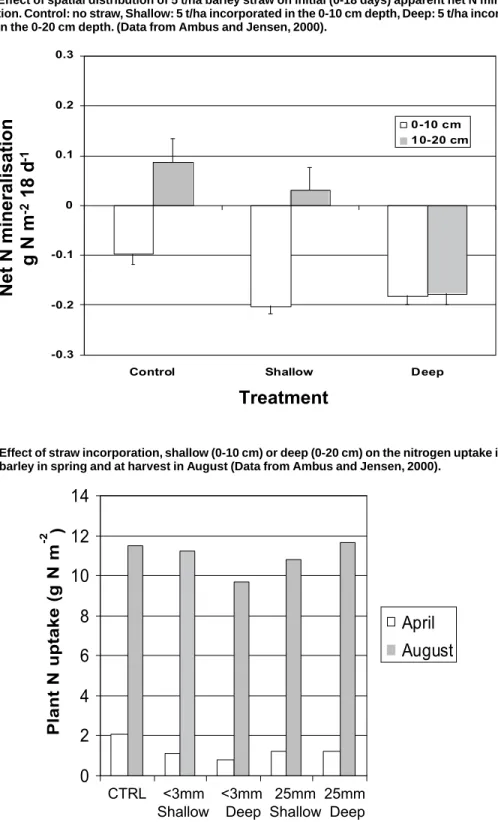
mix-ed: in an grass-clover pastures, when straw of the previous crop and a catch crop grown in the autumn are incorporated together, and in mixed annual crops e.g. pea and barley. Resi-dues from different field may be incorporated together in the same field, e.g. high C/N resi-dues on soil cropped to legumes and vice versa. However, there is a lack of knowledge on the interaction between residues of differ-ent qualities on their turnover. Fig. 3 shows net N mineralisation results of a lab-incuba-tion experiment with a sandy loam soil in which barley straw (C/N: 71), white clover leaves (C/N: 9) and ryegrass shoots (C/N: 25) decomposed either individually or paired for two weeks. The same amount of carbon was added in all residue treatments and the paired residue mixtures consisted of 50% of each residue (Germon, 1997).
The different residue qualities caused sig-nificant differences in net N mineralisation. Barley straw caused net immobilisation, the clover a large net mineralisation, whereas there was no net change in inorganic N in soil supplied with rye grass leaves over the two weeks (Fig. 3). The soil respiration was en-hanced with factors 3.3, 6.2 and 5.9, respec-tively, over the respiration in the non-amend-ed control (data not shown). When residues were combined the net N mineralisation in the straw-clover mixture was significantly (P<0.05) lower than was the ’predicted’ net N mineralisation using the rates from single re-sidues treatments (Fig. 3). Similarly, the respi-ration in the combined straw+clover treat-ment was significantly (P<0.05) greater (38%) than the ’predicted value’ from the decompo-sition of the individual residues (data not shown). Clover leaves were labelled with 15N
and the net N release of clover 15N in
combina-tion with straw was only 40% of what was ’predicted’ from the release of a similar amount of clover alone. With ryegrass 70% of ’predicted’ clover-15N release was found. The
net N mineralisation in the straw+clover mix-tures was lower than ‘predicted’ because the
-20 -10 0 10 20 30 40 Net N mineralisation (mg N kg -1 14 day -1 ) Measured "Predicted" U S C R S+C S+R C+R
Figure 3. Net mineralisation of N soil without [U] residue amendment or incorporation of either barley straw [S], clover leaves [C] or ryegrass leaves [R] decomposing alone or pair wise. Predicted N mineral-isation is the calculated mineralmineral-isation assuming the effect of residues are additive (Germon, 1997).
immobilisation of N in the straw treatment was limited by the availability of N. Thus, the net mineralised clover N was immobilised again during the decomposition of straw. This is supported by the greater than ’predicted’ respiration with the mixture of straw and clo-ver leaves. The basis for manipulating N re-lease from residues by mixing residues of dif-ferent qualities needs further studies since sometimes the turnover of residue mixtures seems to be unpredictable (Wardle et al., 1997).
Physical modification of crop residues
Decreasing the particle size of crop residues, e.g. of one particle of 5x5x5 mm to particles of 1x1x1 mm increases the surface for microbi-al attack from 150 to 750 mm2 and causes a
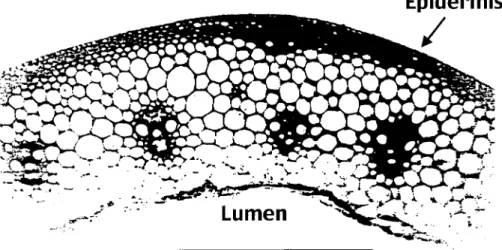
better contact between residue particles and soil. On the outside of mature cereal straw just below epidermis a sheath of lignified cells
protects the inner parenchymatic cells from being colonized quickly by fungi (Fig. 4). When the straw particle size is reduced, fun-gi and bacteria can colonize the residues much faster. Grinding the straw will also re-sult in more organic carbon and nitrogen be-ing soluble. In a percolation experiment with cut (25 mm) and ground (< 1mm) barley straw (C/N:80), the material was leached with cold water. The amount of C and N leached was factors 5.5 and 3.9 greater, respectively, in ground than in cut straw (Table 1). In ground straw half the amount of residue N was leached whereas 11% of the carbon was soluble. However, the increase in leached car-bon was relatively greater than the increase in leached N as a result of the grinding, caus-ing the C/N of leached material to be great-er aftgreat-er grinding (Table 1). Estimating the amount of soluble C in 5 tons of ground bar-ley straw shows that 236 kg would be imme-Residue treatment
Figure 4. Cross-section of mature barley internode showing the lignified cells just below epidermis. The bar represents 0.5 mm.
Table 1. Effect of particle size on the leaching of C and N from barley straw (C/N: 80). 6 gram of straw was leached with 375 ml cold water. (Jensen, Unpublished)
Straw % of element leached C/N leached Leached element from
treatment material 5 ton straw (kg)
C N C N
Cut Straw 2 14 11 40 3.7
25 mm
Ground Straw 11 54 17 236 14
< 1 mm
diately soluble. If the straw is not incorporat-ed, but spread at the soil surface, grinding the straw will cause a much greater proportion of the straw carbon to be quickly available for decomposition after precipitation. Similarly, Ambus and Jensen (1997) observed that leaching the ground barley straw almost halved denitrification in straw-soil suspen-sion.
Models describing the mineralisation and immobilisation of N during the decomposi-tion of crop residues do not include the effect of residue particle size, even though several studies have shown, that it can have a major
effect on the outcome of MIT during early stages of decomposition and in some cases in the longer term. Since the mineralisation-im-mobilisation turnover (MIT) of N in the soil is closely linked to the decomposition it is not surprising to observe that decreasing the particle of low N and lignified residue materi-als increases the net immobilisation of soil inorganic N in the short-term (van Schreven, 1964; Sims and Frederick, 1970; Ambus and Jensen, 1998). Such an effect of decreased particle size can also be observed during the first weeks of decomposition of high N mate-rials such as clover leaves and pea straw
![Figure 3. Net mineralisation of N soil without [U] residue amendment or incorporation of either barley straw [S], clover leaves [C] or ryegrass leaves [R] decomposing alone or pair wise](https://thumb-us.123doks.com/thumbv2/123dok_us/1978764.2793703/28.723.85.641.153.490/figure-mineralisation-residue-amendment-incorporation-barley-ryegrass-decomposing.webp)