u n i ve r s i t y o f co pe n h ag e n
NetSurfP-2.0
improved prediction of protein structural features by integrated deep learning
Klausen, Michael Schantz; Jespersen, Martin Closter; Nielsen, Henrik; Jensen, Kamilla Kjærgaard; Jurtz, Vanessa Isabell; Sønderby, Casper Kaae; Sommer, Morten Otto Alexander; Winther, Ole; Nielsen, Morten; Petersen, Bent; Marcatili, Paolo
Published in:
Proteins: Structure, Function and Bioinformatics DOI:
10.1002/prot.25674
Publication date: 2019
Document version Peer reviewed version
Citation for published version (APA):
Klausen, M. S., Jespersen, M. C., Nielsen, H., Jensen, K. K., Jurtz, V. I., Sønderby, C. K., ... Marcatili, P. (2019). NetSurfP-2.0: improved prediction of protein structural features by integrated deep learning. Proteins: Structure, Function and Bioinformatics, 87(6), 520-527. https://doi.org/10.1002/prot.25674
Research Article
DOI10.1002/prot.25674
NetSurfP-2.0: Improved prediction of protein structural features by
integrated deep learning
Running title: NetSurfP-2.0
Michael Schantz Klausen+1, Martin Closter Jespersen+2, Henrik Nielsen2, Kamilla Kjærgaard Jensen2, Vanessa Isabell Jurtz2, Casper Kaae Sønderby3, Morten Otto Alexander Sommer1, Ole Winther3,4, Morten Nielsen2,5, Bent Petersen2,6,*•, Paolo Marcatili2,*
1: Novo Nordisk Foundation Center for Biosustainability, Technical University of Denmark, Kgs. Lyngby, Denmark
2: Department of Bio and Health Informatics, Technical University of Denmark, Kgs. Lyngby, Denmark 3: The Bioinformatics Centre, Department of Biology, University of Copenhagen, 2200 Copenhagen N, Denmark 4: Department of Applied Mathematics and Computer Science, Technical University of Denmark, Kgs. Lyngby, Denmark
5: Instituto de Investigaciones Biotecnológicas, Universidad Nacional de San Martín, Buenos Aires, Argentina
6: Centre of Excellence for Omics-Driven Computational Biodiscovery (COMBio), Faculty of Applied Sciences, AIMST University, Kedah, Malaysia
*
To whom correspondence should be addressed. Tel: +45 4525 2489; Fax: +45 4593 1585 ; email [email protected]
Correspondence may also be addressed to Bent Petersen. Email: [email protected] + These authors contributed equally to the work
ACKNOWLEDGEMENT: MSK and MOAS acknowledge funding from the Novo Nordisk Foundation.
ABSTRACT
The ability to predict local structural features of a protein from the primary sequence is of paramount importance for unravelling its function in absence of experimental structural information. Two main factors affect the utility of potential prediction tools: their accuracy must enable extraction of reliable structural information on the proteins of interest, and their runtime must be low to keep pace with sequencing data being generated at a constantly increasing speed.
•
Bent Petersen’s current affiliation is: Natural History Museum of Denmark, University of Copenhagen, 2200 Copenhagen N, Denmark
Here, we present NetSurfP-2.0, a novel tool that can predict the most important local structural features with unprecedented accuracy and runtime. NetSurfP-2.0 is sequence-based and uses an architecture composed of convolutional and long short-term memory neural networks trained on solved protein structures. Using a single integrated model, NetSurfP-2.0 predicts solvent accessibility, secondary structure, structural disorder, and backbone dihedral angles for each residue of the input sequences.
We assessed the accuracy of NetSurfP-2.0 on several independent test datasets and found it to consistently produce state-of-the-art predictions for each of its output features. We observe a correlation of 80% between predictions and experimental data for solvent accessibility, and a precision of 85% on secondary structure 3-class predictions. In
addition to improved accuracy, the processing time has been optimized to allow predicting more than 1,000 proteins in less than 2 hours, and complete proteomes in less than 1 day. Keywords: local structure prediction, solvent accessibility, secondary structure, disorder, deep learning
INTRODUCTION
The Anfinsen experiment, showing that the structural characteristics of a protein are encoded in its primary sequence alone, is more than 50 years old (Anfinsen, Haber, Sela, & White, 1961). As a practical application of it, several methods have been developed over the last decades to predict from sequence only several protein structural features,
including solvent accessibility, secondary structure, backbone geometry, and disorder (Cuff, Clamp, Siddiqui, Finlay, & Barton, 1998; Hanson, Yang, Paliwal, & Zhou, 2017;
Heffernan, Yang, Paliwal, & Zhou, 2017; Jones, 1999; McGuffin, Bryson, & Jones, 2000; Rost, 1996). These tools have tremendously impacted biology and chemistry, and some are among the most cited works in the field. They have been extensively used to annotate novel sequences, thus facilitating their characterisation. The accuracy of said methods plays a central role here: the rate of errors in many computationally-generated annotations is a well-known and unresolved problem affecting public databases (Schnoes, Brown, Dodevski, & Babbitt, 2009). Such errors often propagate through databases and sequence annotations, and the availability of high-quality predictions is hence of primary importance to limit their occurrence.
On the other hand, the amount of novel sequences has been steadily increasing over the last years (Kodama, Shumway, Leinonen, & International Nucleotide Sequence Database Collaboration, 2012), and not only experimental methods, but also computational
predictions of structural and functional features have a hard time keeping up with it. This creates a conflict between the need for accurate predictions, and the pace at which we can generate them.
NetSurfP-1.0 (Petersen, Petersen, Andersen, Nielsen, & Lundegaard, 2009) is a tool published in 2009 for prediction of solvent accessibility and secondary structure using a feed-forward neural network architecture. Since then, deep learning techniques have affected the application of machine learning in biology expanding the ability of prediction tools to produce more accurate results on complex datasets (Almagro Armenteros,
V. Jurtz et al., 2017; Min, Lee, & Yoon, 2017; S. Wang, Sun, Li, Zhang, & Xu, 2017). Here, we present NetSurfP-2.0, a new extended version of NetSurfP, that uses a deep neural network approach to accurately predict absolute and relative solvent accessibility,
secondary structure using both 3- and 8-class definitions (Kabsch & Sander, 1983), φ and
ψ dihedral angles, and structural disorder (Linding et al., 2003a), of any given protein from
its primary sequence only. By having an integrated deep model with several outputs, NetSurfP-2.0 can not only significantly reduce the computational time, but also achieve an improved accuracy that could not be reached by having separate models for each feature. In fact, when assessed on various test sets with less than 25% sequence identity to any protein used in the training, its accuracy was consistently on par with or better than that of other state-of-the-art tools (Drozdetskiy, Cole, Procter, & Barton, 2015; Hanson et al., 2017; Heffernan et al., 2017; S. Wang, Li, Liu, & Xu, 2016; S. Wang, Peng, Ma, & Xu, 2016). In particular, we observed a significant increase in the accuracy of solvent accessibility, secondary structure, and disorder over all the other tested methods. NetSurfP-2.0 uses different approaches to make predictions for small and large sets of sequences, thus improving its time efficiency without compromising its accuracy. It has a user-friendly interface allowing non-expert users to obtain and analyse their results via a browser, thanks to its graphical output, or to download them in several common formats for further analysis.
We describe briefly the dataset and method used for training NetSurfP-2.0, and the validations performed.
Structural dataset
A structural dataset consisting of 12,185 crystal structures was obtained from the Protein Data Bank (PDB) (Berman et al., 2000), culled and selected by the PISCES server (G. Wang & Dunbrack, 2005) with 25% sequence similarity clustering threshold and a resolution of 2.5 Å or better. To avoid overfitting, any sequence that had more than 25% identity to any sequences in the test datasets (see “Evaluation” section for details) was removed, as well as peptide chains with less than 20 residues, leaving 10,837 sequences. Finally, we randomly selected 500 sequences (validation set) left out for early stopping and parameter optimization, leaving 10,337 sequences for training.
Structural Features
For all residues in each chain in the training dataset, we calculated its absolute and relative solvent accessibility (ASA and RSA, respectively), 3- and 8-class secondary
structure classification (SS3 and SS8, respectively), and the backbone dihedral angles φ
and ψ using the DSSP software (Kabsch & Sander, 1983). Finally, each residue that was
present in the chain refseq sequence, but not in the solved structure, was defined as disordered. It is important to mention that disordered residues cannot be annotated with any of the other features, since no atomic coordinates are available for these residues.
Protein sequence profiles
NetSurfP-2.0, like its predecessor, exploits sequence profiles of the target protein for its predictions. We used two different ways for generating such profiles. The first exploits the HH-suite software (Remmert, Biegert, Hauser, & Söding, 2011), that runs quickly on
individual sequences, while the second uses the MMseqs2 software (Steinegger & Söding, 2017), that is optimized for searches on large data sets. In both cases, the
profile-generation tools were run with default parameters, except MMseqs2 which used 2 iterations with the `--max-seqs` parameter set to 2,000.
Deep Network architecture
The model was implemented using the Keras library. The input layer of the model consists of the one-hot (sparse) encoded sequences (20 features) plus the full HMM profiles from HH-suite (30 features in total, comprising 20 features for the amino acid profile, 7 features for state transition probabilities, and 3 features for local alignment diversity), giving a total of 50 input features. This input is then connected to two Convolutional Neural Network (CNN) layers, consisting of 32 filters each with size 129 and 257, respectively. The CNN output is concatenated with the initial 50 input features and connected to two bidirectional long short-term memory (LSTM) layers with 1024 nodes (Figure 1, panel A).
Each output (RSA, SS8, SS3, φ, ψ, and disorder) is calculated with a Fully Connected
(FC) layer using the outputs from the final LSTM layer. RSA is encoded as a single output between 0 and 1. ASA output is not directly predicted, but calculated by multiplying RSA
and ASAmax (Ahmad, Gromiha, & Sarai, 2003). SS8, SS3, and disorder, are encoded as 8, 3, or 2 outputs with the target encoded as a sparse vector (target is set to 1, while rest
of the elements are 0). φ and ψ are each encoded as a vector of length 2, where the first
element is the sine of the angle and the second element is the cosine. This encoding reduces the effect of the periodicity of the angles (Lyons et al., 2014), and the predicted angle can be calculated with the arctan2 function.
Training
The training was performed using mini-batches of size 15. The individual learning rate of each neuron was optimized using the Adam function (Kingma & Ba, 2014). Early stopping was performed on the validation set. Since the different target values for each output have different distributions, a weighted sum of different loss functions was used: SS8, SS3 and
disorder use cross entropy loss, while RSA, φ and ψ use mean squared error loss. Such
weights were adjusted so each loss contribution was approximately equal and then fine-tuned for maximum overall performance. When the target value for a feature of a given
residue was missing, e.g. for secondary structure of disordered residues, or φ angles of N
-terminal residues, the loss for that output was set to 0.
Evaluation
The final two models, one trained with the HH-suite and one with MMseqs2 profiles, were tested on 3 independent datasets: the TS115 dataset (115 proteins) (Yang et al., 2016), the CB513 dataset (513 protein regions from 434 proteins) (Cuff & Barton, 1999), and a
dataset consisting of all the free-modeling targets (21 proteins) at the CASP 12 experiment (Abriata et al., 2018). No protein with more than 25% sequence identity to the proteins in these datasets was present in the training. Disorder prediction was not performed on the CB513 dataset since it contains very few disordered regions.
We used different metrics to evaluate each feature: Pearson’s correlation coefficient (PCC) for solvent accessibilities, Q3 and Q8 accuracy for SS3 and SS8 respectively (Kabsch & Sander, 1983), mean absolute error in degrees for φ and ψ angles (MAE), Matthews correlation coefficient (MCC) and False Positive Rate (FPR) for disorder. In each dataset, the performance was calculated both as the average over all the residues in the dataset (per residue) and as the average of the performances per structure, the latter being defined as the average of the metric on all the residue of each given structure. The p-values between the top-scoring method and all the other methods on a given feature in a dataset were calculated using a 2-tailed paired Student’s t-test on the corresponding performances per structure.
DISPROT dataset
We retrieved all the entries in DisProt (Piovesan et al., 2017), a database containing proteins annotated with several experimentally validated disorder types. All proteins with an available solved structure were removed to avoid overlaps with the training set. For each residue of each protein, we compare its experimental disorder annotation to the disorder prediction from NetSurfP-2.0. We classified proteins with more than 75% of their residues being disordered as completely disordered proteins.
RESULTS
We have compared the performance of NetSurfP-2.0 to other state-of-the-art tools with similar functionality: NetSurfP-1.0 (Petersen et al., 2009), Spider3 (Heffernan et al., 2017), SPOT-Disorder (Hanson et al., 2017), RaptorX (S. Wang, Li, et al., 2016; S. Wang, Peng, et al., 2016), and JPred4 (Drozdetskiy et al., 2015). In order to check whether the results of the methods were significantly different, we calculated a p-value for each feature by using a pairwise Student’s t-test on the results of the two methods. Results on the independent test sets CASP12 (Abriata, Tamò, Monastyrskyy, Kryshtafovych, & Dal
Peraro, 2018), TS115 (Yang et al., 2016), and CB513 (Cuff & Barton, 1999) are presented in Table 1, and in an extended version in Supplementary table S1. They match to a very high degree with the results obtained by using a 4-fold cross validation on the training set (Supplementary table S2).
We give here the results for each individual feature, and a benchmark of the time performance of the tool. An example of the ASA and SS3 predictions for the human Orotate phosphoribosyltransferase (OPRTase) domain, displayed on its solved structure (PDB id 2WNS) is illustrated in Figure 2.
Solvent accessibility
The main focus of the original NetSurfP-1.0 and of its updated version is to predict solvent accessibility for individual residues. Both tools predict RSA, and also calculate the
corresponding ASA as described in the Methods section. We have compared the
performance of the old and updated version of our tool, and compared to that of Spider3, a recent tool with a similar architecture that only predicts the ASA, and RaptorX, which performs a 3-class prediction of Buried (RSA<.1), Medium (.1<RSA<.4) and Exposed (.4<RSA) residues. RaptorX 3-class predictions were transformed to numeric predictions by assigning to each class the middle of its RSA interval. We have also calculated
NetSurfP-2.0 accuracy by projecting its predictions to RaptorX 3-class RSA classes (Supplementary Figure S1). The results shown in Table 1 demonstrate a consistently improved performance of NetSurfP-2.0, compared to the other methods, with a PCC of approximately 0.8 on the test datasets TS115 and CB513 and on the validation set. The PCC of NetSurfP-2.0 on the CASP12 dataset is approximately 0.72, inferior to the other data sets but still significantly better than all other methods. It has to be noted that many of the structures in the CASP12 dataset are not obtained through X-ray crystallography, and they contain a number of disordered regions (as defined in the Methods) substantially larger than both the other external dataset and the training data. We see in general (Supplementary table S3) that all the predictions are less accurate in the few residues before and after a disordered region. We will further discuss this later.
Secondary structure
Many tools for secondary structure prediction have been published over the last 20 years, with their reported accuracy improving over time (Yang et al., 2016). In many cases, these tools have been subject of independent validation studies (Cuff & Barton, 1999; Zhang et
al., 2011) to get an independent assessment of their actual capabilities. We have decided to compare our tool with Spider3, RaptorX, and Jpred4, as these are among the most commonly used and accurate tools available. All the aforementioned tools perform 3-class prediction of secondary structure, while only NetSurfP-2.0 and RaptorX also provide an 8-class prediction. The results of the benchmark are given in Table 1. In all cases, NetSurfP-2.0 produce significantly more accurate predictions than all the other tools, with an
average Q3 accuracy of approximately 85%, and a Q8 accuracy between 72% and 75% (Supplementary table S1, Supplementary figure S2). As for solvent accessibility prediction, the results on the CASP12 dataset are less accurate for all tested tools. A difference between the old version of the tool and its successor is that the latter is trained including disordered regions. We have also tested whether this affects the accuracy of the prediction of features other than disorder in the proximity of the disordered regions. This is actually the case for Q3 and Q8, which are significantly higher for our tool when compared to a modified version of it in which the disordered regions have been completely removed from the training sequences (Supplementary table S4). This effect is more pronounced for the datasets that have more disordered regions (CASP12 and TS115) and less so for the CB513 dataset. Even though such residues constitute a very small portion of the total amount, these results suggest that including the disordered regions in general help our model to achieve a better internal representation of the protein sequences.
There is nowadays a general support that disorder plays a fundamental role in the function and dynamics of proteins, and several different types of disorder have been described and annotated. Our tool is focused on protein regions with missing atomic coordinates in their solved structures, corresponding to the REMARK-465 regions in the DisEMBL annotation (Linding et al., 2003b). We have compared our prediction to both RaptorX and SPOT-disorder, a method developed by the same group that developed Spider-3. As customary in cases where the amount of negative data points greatly outnumbers the amount of positive data points (Chicco, 2017), we have decided to use the Matthew’s correlation coefficient (MCC) to compare the tools. In all cases, NetSurfP-2.0 produces the most accurate results, with an average MCC of 0.65 (see Table 1). It has to be noted that this difference, though large, is not statistically significant. This might be partially due to the limited number of proteins that contain disordered regions among all the datasets, and on which the MCC and the corresponding statistical tests could be calculated. On the other hand, if we extend our evaluation of the disorder prediction by including the FPR, we see that our tool produces far less false positives than all the other tools, and in this case the difference is statistically significant.
This improved performance could be due to the specific training method we used, that includes many non-disordered proteins. We will show in the following that this however does not reflect in a general underprediction tendency of the tool, as exemplified in disorder-enriched proteins.
As we mentioned above, we focus on one particular definition of disorder, while many more are available. To check if our tool can produce meaningful predictions on different types of protein disorder (e.g. intrinsically disordered proteins, functional disorder), we conducted a benchmark against the proteins in the DisProt database (Piovesan et al., 2017), a resource containing experimentally annotated disordered regions of different types. The results of this benchmark are reported in Table 2 and demonstrate that our tool performs well also on other types of disorder, and that it can also be used to identify completely disordered proteins, which were not used in its training. NetSurfP-2.0, when compared to the other tools, presents a much lower level of false positives, that is particularly evident in proteins that contain few or no disordered region at all. This,
however, does not affect NetSurfP-2.0 accuracy on proteins that contain many disordered regions or that are intrinsically disordered. By comparing the recall on the TS115, the whole DisProt data set, and the subset of completely disordered proteins, we see that the tool not only performs well also on proteins enriched in disordered regions, but that the low level of false positives noticed before is not trivially linked to a general underprediction effect.
Another way to define disordered regions is by the so called “hot loops” (Linding et al., 2003b), i.e. loop regions that present high temperature factors (B factor) for their Cα
atoms. We tested if our prediction captures this definition by analysing its correlation to the B factor of backbone atoms for the TS115 dataset. To compare B factors from different structures, each B factor was normalised by the average B factor of the protein chain it belongs to. We see a Spearman correlation of 0.43 (Supplementary figure S3), confirming
the ability of our model to produce a meaningful and consistent internal representation of the protein characteristics.
Backbone dihedral angles
To complete the evaluation of our tool, we report its performance on the prediction of the
backbone dihedral angles φ and ψ. We compared the results of NetSurfP-2.0 and Spider3.
In this case, the two tools performed almost identically, with NetSurfP-2.0 producing only marginally better predictions, with no statistically significant difference. Both tools
produced more accurate prediction of the φ angle compared to ψ. This is expected, given the much broader distribution of the ψ angle in the Ramachandran plot compared to the φ
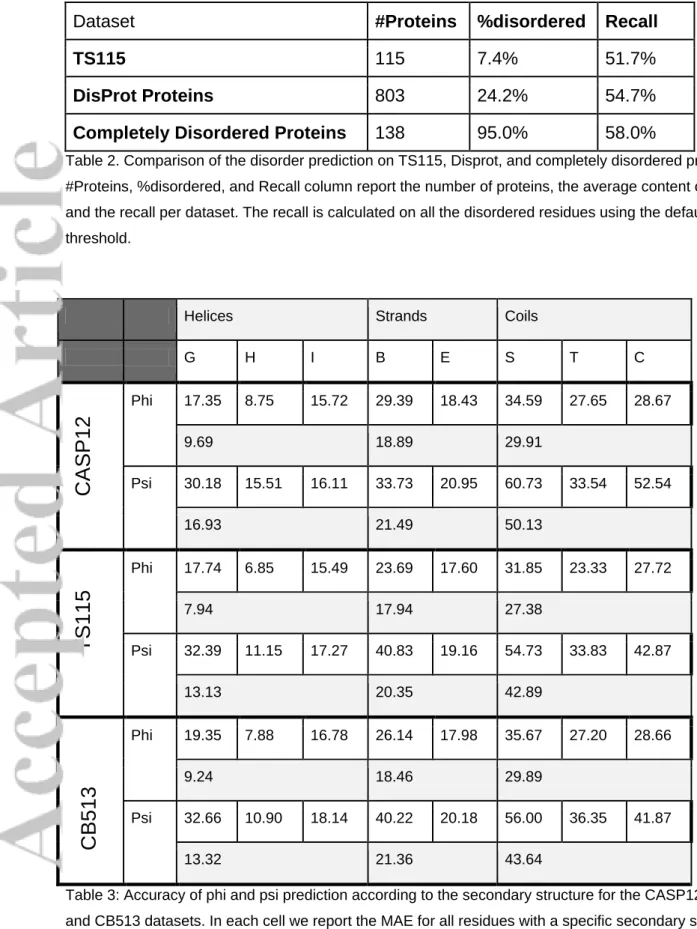
angle, that is almost always confined to values between -180 and -40 degrees. We also observed a very poor prediction accuracy for both angles in the proximity of disordered regions (Supplementary table S3), and, to a lower extent, in loop and coil regions (Table 3, Supplementary figure S4).
Individual vs integrated model
Thanks to the multi-task architecture and training strategy used, it is possible to predict all the features concurrently using a single model. Though this architecture improves the time optimization of our tool, this could potentially be sub-optimal with respect to accuracy. In order to test this, we trained single-output models for RSA, Secondary Structure (3- and 8-class), and disorder. We see (Supplementary Table S4) that the performance of the integrated model is comparable or better than that of the individual models.
It is also interesting to notice that the hyperparameter optimisation described in Methods plays an important role in the training of the integrated model: if no relative weight is
assigned to the different output, we observe a small degradation of the performance of the RSA with respect to both the integrated model and the individual ones.
Time performance
We have shown that NetSurfP-2.0 outperforms all other methods in all the tests.
This is the case for both the NetSurfP-2.0 models trained using different profile generation tools, namely HH-suite and MMseqs2. Moreover, both the HH-suite and MMseqs2 models perform similarly on all datasets tested. However, they have very different running time: the runtime on a single protein sequence for the HH-suite model is approximately 2 minutes, but it scales linearly with the number of sequences. MMseqs2, conversely, is slower for small datasets, but on large datasets it provides a speed-up of up to 50 times and the ability to parallelise on multiple processors (Figure 1, panel B). Given this, NetSurfP-2.0 is implemented to use the HH-suite model for searches of less than 100 sequences, and the MMseqs2 model otherwise, thus offering a good trade-off between computation time and resource demand, without sacrificing the method’s accuracy.
Tool availability
NetSurfP-2.0 is available both as a web-server, and as an independent software (http://www.cbs.dtu.dk/services/NetSurfP-2.0/). The web-server version accepts up to 4,000 sequences or 4,000,000 residues per job.
DISCUSSION
The NetSurfP-2.0 web server provides state-of-the-art sequence-based predictions for solvent accessibility, secondary structure, disorder, and backbone geometry. Its superior performance is likely due to a few different characteristics: its architecture, its training strategy, and its data representation. The core of NetSurfP-2.0 architecture is composed by the two bidirectional LSTM layers. Thanks to their memory, these elements can keep track of the context around a residue better than convolutional elements. In fact, in preliminary analyses, we observed that the CNN layers that precede the LSTMs only provide a minor improvement to the overall prediction accuracy. We have also tested the effect of including a Conditional Random Field (CRF) layer downstream of the LSTM layers to enforce a more robust grammar of the different structural elements, but this did not bring any advantage (data not shown). On the other hand, by training a multi-task weight-sharing integrated model with several structural features, we improve the accuracy of disorder with respect to models trained on individual features. This improvement likely results from a more robust and informative internal state of the system, which is extremely valuable for features, such as disorder, where only a few positives are present on average. This integration was enabled by using improved representations of the structural data. The previous version of NetSurfP, as well as other tools, are trained only on the residues that are observed in the solved structure. In this way, the models are presented with cases that are neither physically nor biologically meaningful, such as residues divided by a disordered
region, that are far apart in primary and tertiary structure but presented to the model as consecutive. In contrast, by using a recent training procedure strategy (V. Jurtz et al., 2017), we can train the model on all residues, including the disordered ones, thus
increasing the accuracy of annotated features in the data and reduce the frustration during training.
The NetSurfP-2.0 framework is extremely flexible and allows to potentially include many more structural features. We have shown that the disorder prediction of our model has a fair correlation with the residues’ B factor. Given this result, we believe that including the latter as an additional output for the system might actually improve the disorder prediction itself. Other possible features to be added are proline cis/trans conformation, metal binding sites, phosphorylation, glycosylation, and many others.
Having an integrated model has an effect on the accuracy of the tool, but most importantly makes it much more time-efficient. On top of that, our software uses two different profile creation strategies in order to achieve an even better efficiency both for small sets of sequences, and for large batches of thousands of proteins. This allows the tool to annotate a single proteome in less than a day, a very important feature in present day biology.
Thanks to its accuracy, its fast computation time, and its easy and intuitive interface, we believe that NetSurfP-2.0 will become a valuable resource that will aid researchers both with and without extensive computational knowledge to analyse and understand protein structure and function.
REFERENCES
Abriata, L. A., Tamò, G. E., Monastyrskyy, B., Kryshtafovych, A., & Dal Peraro, M. (2018). Assessment of hard target modeling in CASP12 reveals an emerging role of
alignment-based contact prediction methods. Proteins: Structure, Function, and Bioinformatics, 86, 97–112. https://doi.org/10.1002/prot.25423
Ahmad, S., Gromiha, M. M., & Sarai, A. (2003). Real value prediction of solvent accessibility from amino acid sequence. Proteins, 50(4), 629–635.
https://doi.org/10.1002/prot.10328
Almagro Armenteros, J. J., Sønderby, C. K., Sønderby, S. K., Nielsen, H., & Winther, O. (2017). DeepLoc: prediction of protein subcellular localization using deep learning.
Bioinformatics, 33(21), 3387–3395. https://doi.org/10.1093/bioinformatics/btx431 Anfinsen, C. B., Haber, E., Sela, M., & White, F. H. (1961). The kinetics of formation of
native ribonuclease during oxidation of the reduced polypeptide chain. Proceedings of the National Academy of Sciences of the United States of America, 47, 1309– 1314.
Berman, H. M., Westbrook, J., Feng, Z., Gilliland, G., Bhat, T. N., Weissig, H., … Bourne, P. E. (2000). The Protein Data Bank. Nucleic Acids Research, 28(1), 235–242. Chicco, D. (2017). Ten quick tips for machine learning in computational biology. BioData
Mining, 10(1). https://doi.org/10.1186/s13040-017-0155-3
Cuff, J. A., & Barton, G. J. (1999). Evaluation and improvement of multiple sequence methods for protein secondary structure prediction. Proteins, 34(4), 508–519.
Cuff, J. A., Clamp, M. E., Siddiqui, A. S., Finlay, M., & Barton, G. J. (1998). JPred: a consensus secondary structure prediction server. Bioinformatics (Oxford, England),
14(10), 892–893.
Drozdetskiy, A., Cole, C., Procter, J., & Barton, G. J. (2015). JPred4: a protein secondary structure prediction server. Nucleic Acids Research, 43(W1), W389-394.
https://doi.org/10.1093/nar/gkv332
Esteva, A., Kuprel, B., Novoa, R. A., Ko, J., Swetter, S. M., Blau, H. M., & Thrun, S. (2017). Dermatologist-level classification of skin cancer with deep neural networks.
Nature, 542(7639), 115–118. https://doi.org/10.1038/nature21056
Hanson, J., Yang, Y., Paliwal, K., & Zhou, Y. (2017). Improving protein disorder prediction by deep bidirectional long short-term memory recurrent neural networks.
Bioinformatics (Oxford, England), 33(5), 685–692. https://doi.org/10.1093/bioinformatics/btw678
Heffernan, R., Yang, Y., Paliwal, K., & Zhou, Y. (2017). Capturing non-local interactions by long short-term memory bidirectional recurrent neural networks for improving
prediction of protein secondary structure, backbone angles, contact numbers and solvent accessibility. Bioinformatics, 33(18), 2842–2849.
https://doi.org/10.1093/bioinformatics/btx218
Jones, D. T. (1999). Protein secondary structure prediction based on position-specific scoring matrices. Journal of Molecular Biology, 292(2), 195–202.
Jurtz, V. I., Johansen, A. R., Nielsen, M., Almagro Armenteros, J. J., Nielsen, H., Sønderby, C. K., … Sønderby, S. K. (2017). An introduction to deep learning on biological sequence data: examples and solutions. Bioinformatics (Oxford, England), 33(22), 3685–3690. https://doi.org/10.1093/bioinformatics/btx531 Jurtz, V., Paul, S., Andreatta, M., Marcatili, P., Peters, B., & Nielsen, M. (2017).
NetMHCpan-4.0: Improved Peptide-MHC Class I Interaction Predictions Integrating Eluted Ligand and Peptide Binding Affinity Data. Journal of Immunology (Baltimore, Md.: 1950), 199(9), 3360–3368. https://doi.org/10.4049/jimmunol.1700893
Kabsch, W., & Sander, C. (1983). Dictionary of protein secondary structure: pattern recognition of hydrogen-bonded and geometrical features. Biopolymers, 22(12), 2577–2637. https://doi.org/10.1002/bip.360221211
Kingma, D. P., & Ba, J. (2014). Adam: A Method for Stochastic Optimization.
ArXiv:1412.6980 [Cs]. Retrieved from http://arxiv.org/abs/1412.6980
Kodama, Y., Shumway, M., Leinonen, R., & International Nucleotide Sequence Database Collaboration. (2012). The Sequence Read Archive: explosive growth of
sequencing data. Nucleic Acids Research, 40(Database issue), D54-56. https://doi.org/10.1093/nar/gkr854
Linding, R., Jensen, L. J., Diella, F., Bork, P., Gibson, T. J., & Russell, R. B. (2003a). Protein Disorder Prediction. Structure, 11(11), 1453–1459.
Linding, R., Jensen, L. J., Diella, F., Bork, P., Gibson, T. J., & Russell, R. B. (2003b). Protein disorder prediction: implications for structural proteomics. Structure (London, England: 1993), 11(11), 1453–1459.
Lyons, J., Dehzangi, A., Heffernan, R., Sharma, A., Paliwal, K., Sattar, A., … Yang, Y.
(2014). Predicting backbone Cα angles and dihedrals from protein sequences by
stacked sparse auto-encoder deep neural network. Journal of Computational Chemistry, 35(28), 2040–2046. https://doi.org/10.1002/jcc.23718
McGuffin, L. J., Bryson, K., & Jones, D. T. (2000). The PSIPRED protein structure prediction server. Bioinformatics (Oxford, England), 16(4), 404–405.
Min, S., Lee, B., & Yoon, S. (2017). Deep learning in bioinformatics. Briefings in Bioinformatics, 18(5), 851–869. https://doi.org/10.1093/bib/bbw068
Petersen, B., Petersen, T., Andersen, P., Nielsen, M., & Lundegaard, C. (2009). A generic method for assignment of reliability scores applied to solvent accessibility
predictions. BMC Structural Biology, 9(1), 51. https://doi.org/10.1186/1472-6807-9-51
Piovesan, D., Tabaro, F., Mičetić, I., Necci, M., Quaglia, F., Oldfield, C. J., … Tosatto, S.
C. E. (2017). DisProt 7.0: a major update of the database of disordered proteins.
Nucleic Acids Research, 45(D1), D219–D227. https://doi.org/10.1093/nar/gkw1056 Remmert, M., Biegert, A., Hauser, A., & Söding, J. (2011). HHblits: lightning-fast iterative
protein sequence searching by HMM-HMM alignment. Nature Methods, 9(2), 173– 175. https://doi.org/10.1038/nmeth.1818
Rost, B. (1996). PHD: predicting one-dimensional protein structure by profile-based neural networks. Methods in Enzymology, 266, 525–539.
Schnoes, A. M., Brown, S. D., Dodevski, I., & Babbitt, P. C. (2009). Annotation error in public databases: misannotation of molecular function in enzyme superfamilies.
PLoS Computational Biology, 5(12), e1000605. https://doi.org/10.1371/journal.pcbi.1000605
Steinegger, M., & Söding, J. (2017). MMseqs2 enables sensitive protein sequence searching for the analysis of massive data sets. Nature Biotechnology, 35(11), 1026–1028. https://doi.org/10.1038/nbt.3988
Wang, G., & Dunbrack, R. L. (2005). PISCES: recent improvements to a PDB sequence culling server. Nucleic Acids Research, 33(Web Server issue), W94-98.
https://doi.org/10.1093/nar/gki402
Wang, S., Li, W., Liu, S., & Xu, J. (2016). RaptorX-Property: a web server for protein structure property prediction. Nucleic Acids Research, 44(W1), W430-435. https://doi.org/10.1093/nar/gkw306
Wang, S., Peng, J., Ma, J., & Xu, J. (2016). Protein Secondary Structure Prediction Using Deep Convolutional Neural Fields. Scientific Reports, 6, 18962.
https://doi.org/10.1038/srep18962
Wang, S., Sun, S., Li, Z., Zhang, R., & Xu, J. (2017). Accurate De Novo Prediction of Protein Contact Map by Ultra-Deep Learning Model. PLOS Computational Biology,
Yang, Y., Gao, J., Wang, J., Heffernan, R., Hanson, J., Paliwal, K., & Zhou, Y. (2016). Sixty-five years of the long march in protein secondary structure prediction: the final stretch? Briefings in Bioinformatics, bbw129. https://doi.org/10.1093/bib/bbw129 Zhang, H., Zhang, T., Chen, K., Kedarisetti, K. D., Mizianty, M. J., Bao, Q., … Kurgan, L.
(2011). Critical assessment of high-throughput standalone methods for secondary structure prediction. Briefings in Bioinformatics, 12(6), 672–688.
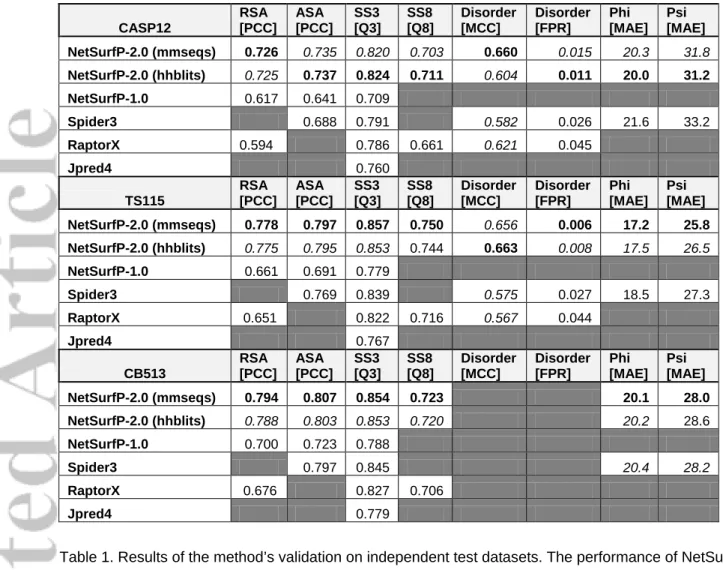
TABLES CASP12 RSA [PCC] ASA [PCC] SS3 [Q3] SS8 [Q8] Disorder [MCC] Disorder [FPR] Phi [MAE] Psi [MAE] NetSurfP-2.0 (mmseqs) 0.726 0.735 0.820 0.703 0.660 0.015 20.3 31.8 NetSurfP-2.0 (hhblits) 0.725 0.737 0.824 0.711 0.604 0.011 20.0 31.2 NetSurfP-1.0 0.617 0.641 0.709 Spider3 0.688 0.791 0.582 0.026 21.6 33.2 RaptorX 0.594 0.786 0.661 0.621 0.045 Jpred4 0.760 TS115 RSA [PCC] ASA [PCC] SS3 [Q3] SS8 [Q8] Disorder [MCC] Disorder [FPR] Phi [MAE] Psi [MAE] NetSurfP-2.0 (mmseqs) 0.778 0.797 0.857 0.750 0.656 0.006 17.2 25.8 NetSurfP-2.0 (hhblits) 0.775 0.795 0.853 0.744 0.663 0.008 17.5 26.5 NetSurfP-1.0 0.661 0.691 0.779 Spider3 0.769 0.839 0.575 0.027 18.5 27.3 RaptorX 0.651 0.822 0.716 0.567 0.044 Jpred4 0.767 CB513 RSA [PCC] ASA [PCC] SS3 [Q3] SS8 [Q8] Disorder [MCC] Disorder [FPR] Phi [MAE] Psi [MAE] NetSurfP-2.0 (mmseqs) 0.794 0.807 0.854 0.723 20.1 28.0 NetSurfP-2.0 (hhblits) 0.788 0.803 0.853 0.720 20.2 28.6 NetSurfP-1.0 0.700 0.723 0.788 Spider3 0.797 0.845 20.4 28.2 RaptorX 0.676 0.827 0.706 Jpred4 0.779
Table 1. Results of the method’s validation on independent test datasets. The performance of NetSurfP-2.0 (using HH-suite and MMSeqs2 profiles), NetSurfP-1.0, Spider3, SPOT-disorder, RaptorX, and JPred4, is displayed for the CASP12, TS115, and CB513 datasets. SPOT-disorder and Spider3 predictions are reported as a single row. The following performance metrics are used: Pearson Correlation Coefficient (PCC), Q3 and Q8 accuracy, Matthew’s Correlation Coefficient (MCC), False Positive Rate (FPR), and mean absolute error (MAE) in degrees. RaptorX RSA prediction classes B (buried), M (medium), and E (exposed), are mapped to the middle of the corresponding interval used to define them, i.e. to 0.05, 0.25, and 0.7, respectively. The different predicted features are reported in the column header, together with the corresponding performance metric. For each feature and each dataset, the best score is reported in bold. Scores in italics are the ones for which no significant difference with respect to the top scoring method is observed (p-value>.05). Greyed-out cells represent predictions that were not performed, either because not part of a method’s output, or because the feature was not present in the corresponding dataset.
Dataset #Proteins %disordered Recall
TS115 115 7.4% 51.7%
DisProt Proteins 803 24.2% 54.7%
Completely Disordered Proteins 138 95.0% 58.0%
Table 2. Comparison of the disorder prediction on TS115, Disprot, and completely disordered proteins. The #Proteins, %disordered, and Recall column report the number of proteins, the average content of disorder, and the recall per dataset. The recall is calculated on all the disordered residues using the default 0.5 threshold.
Helices Strands Coils
G H I B E S T C Phi 17.35 8.75 15.72 29.39 18.43 34.59 27.65 28.67 9.69 18.89 29.91 Psi 30.18 15.51 16.11 33.73 20.95 60.73 33.54 52.54 16.93 21.49 50.13 Phi 17.74 6.85 15.49 23.69 17.60 31.85 23.33 27.72 7.94 17.94 27.38 Psi 32.39 11.15 17.27 40.83 19.16 54.73 33.83 42.87 13.13 20.35 42.89 Phi 19.35 7.88 16.78 26.14 17.98 35.67 27.20 28.66 9.24 18.46 29.89 Psi 32.66 10.90 18.14 40.22 20.18 56.00 36.35 41.87 13.32 21.36 43.64
Table 3: Accuracy of phi and psi prediction according to the secondary structure for the CASP12, TS115,