Interpretable machine learning models for
classifying low back pain status using functional
physiological variables
Liew, Bernard X W; Rugamer, David; De Nunzio, Alessandro Marco; Falla, Deborah
DOI:10.1007/s00586-020-06356-0
License:
Creative Commons: Attribution (CC BY)
Document Version
Publisher's PDF, also known as Version of record
Citation for published version (Harvard):
Liew, BXW, Rugamer, D, De Nunzio, AM & Falla, D 2020, 'Interpretable machine learning models for classifying low back pain status using functional physiological variables', European Spine Journal.
https://doi.org/10.1007/s00586-020-06356-0
Link to publication on Research at Birmingham portal
General rights
Unless a licence is specified above, all rights (including copyright and moral rights) in this document are retained by the authors and/or the copyright holders. The express permission of the copyright holder must be obtained for any use of this material other than for purposes permitted by law.
•Users may freely distribute the URL that is used to identify this publication.
•Users may download and/or print one copy of the publication from the University of Birmingham research portal for the purpose of private study or non-commercial research.
•User may use extracts from the document in line with the concept of ‘fair dealing’ under the Copyright, Designs and Patents Act 1988 (?) •Users may not further distribute the material nor use it for the purposes of commercial gain.
Where a licence is displayed above, please note the terms and conditions of the licence govern your use of this document. When citing, please reference the published version.
Take down policy
While the University of Birmingham exercises care and attention in making items available there are rare occasions when an item has been uploaded in error or has been deemed to be commercially or otherwise sensitive.
If you believe that this is the case for this document, please contact [email protected] providing details and we will remove access to the work immediately and investigate.
https://doi.org/10.1007/s00586-020-06356-0
ORIGINAL ARTICLE
Interpretable machine learning models for classifying low back pain
status using functional physiological variables
Bernard X. W. Liew1 · David Rugamer2,3 · Alessandro Marco De Nunzio4 · Deborah Falla5
Received: 24 September 2019 / Revised: 5 February 2020 / Accepted: 18 February 2020 © The Author(s) 2020
Abstract
Purpose To evaluate the predictive performance of statistical models which distinguishes different low back pain (LBP) sub-types and healthy controls, using as input predictors the time-varying signals of electromyographic and kinematic vari-ables, collected during low-load lifting.
Methods Motion capture with electromyography (EMG) assessment was performed on 49 participants [healthy control (con) = 16, remission LBP (rmLBP) = 16, current LBP (LBP) = 17], whilst performing a low-load lifting task, to extract a total of 40 predictors (kinematic and electromyographic variables). Three statistical models were developed using functional data boosting (FDboost), for binary classification of LBP statuses (model 1: con vs. LBP; model 2: con vs. rmLBP; model 3: rmLBP vs. LBP). After removing collinear predictors (i.e. a correlation of > 0.7 with other predictors) and inclusion of the covariate sex, 31 predictors were included for fitting model 1, 31 predictors for model 2, and 32 predictors for model 3.
Results Seven EMG predictors were selected in model 1 (area under the receiver operator curve [AUC] of 90.4%), nine predictors in model 2 (AUC of 91.2%), and seven predictors in model 3 (AUC of 96.7%). The most influential predictor was the biceps femoris muscle (peak 𝛽 = 0.047) in model 1, the deltoid muscle (peak 𝛽 = 0.052) in model 2, and the iliocostalis muscle (peak 𝛽 = 0.16) in model 3.
Conclusion The ability to transform time-varying physiological differences into clinical differences could be used in future prospective prognostic research to identify the dominant movement impairments that drive the increased risk.
Graphic abstract
These slides can be retrieved under Electronic Supplementary Material.
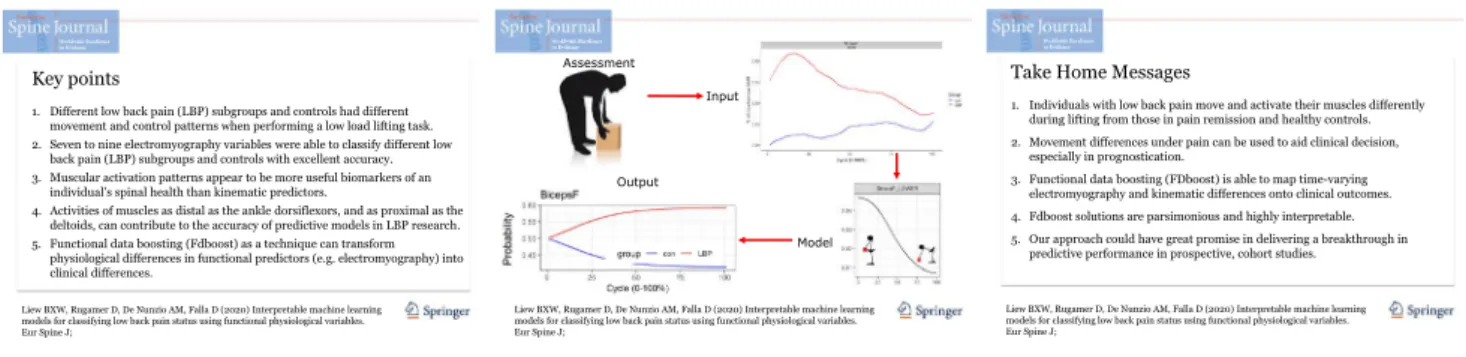
Key points
1. Different low back pain (LBP) subgroups and controls had different movement and control patterns when performing a low load lifting task. 2. Seven to nine electromyography variables were able to classify different low
back pain (LBP) subgroups and controls with excellent accuracy. 3. Muscular activation patterns appear to be more useful biomarkers of an
individual’s spinal health than kinematic predictors.
4. Activities of muscles as distal as the ankle dorsiflexors, and as proximal as the deltoids, can contribute to the accuracy of predictive models in LBP research. 5. Functional data boosting (Fdboost) as a technique can transform
physiological differences in functional predictors (e.g. electromyography) into clinical differences.
Liew BXW, Rugamer D, De Nunzio AM, Falla D (2020) Interpretable machine learning models for classifying low back pain status using functional physiological variables. Eur Spine J;
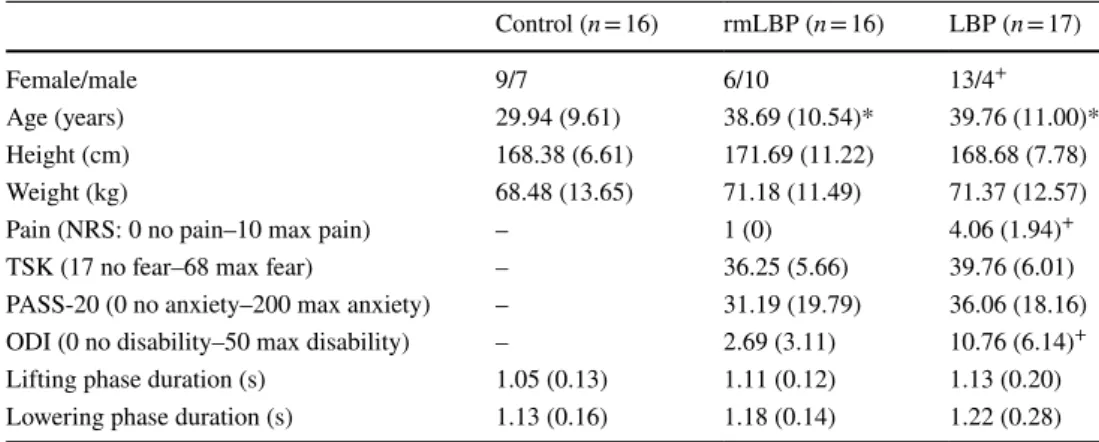
Model Output
Assessment
Input
Liew BXW, Rugamer D, De Nunzio AM, Falla D (2020) Interpretable machine learning models for classifying low back pain status using functional physiological variables. Eur Spine J;
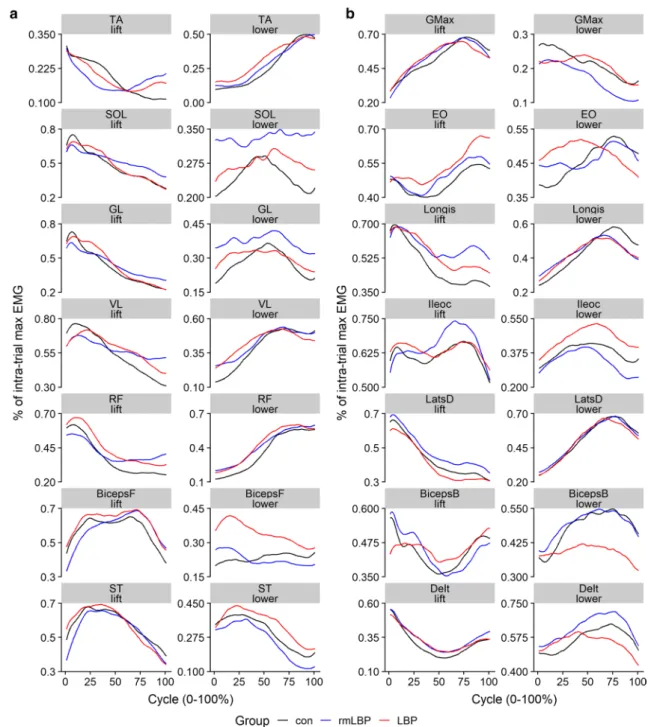
Take Home Messages
1. Individuals with low back pain move and activate their muscles differently during lifting from those in pain remission and healthy controls. 2. Movement differences under pain can be used to aid clinical decision,
especially in prognostication.
3. Functional data boosting (FDboost) is able to map time-varying electromyography and kinematic differences onto clinical outcomes. 4. Fdboost solutions are parsimonious and highly interpretable. 5. Our approach could have great promise in delivering a breakthrough in
predictive performance in prospective, cohort studies.
Liew BXW, Rugamer D, De Nunzio AM, Falla D (2020) Interpretable machine learning models for classifying low back pain status using functional physiological variables. Eur Spine J;
Keywords Motor control · Lifting · Biomechanics · Low back pain · Machine learning · Functional regression
Introduction
Low back pain (LBP) has a global prevalence of close to half a billion [1] and ranks as the number one cause of years lived with disability [1]. LBP incurs a significant socio-economic cost, with £1.6 billion incurred as health-related
Electronic supplementary material The online version of this article (https ://doi.org/10.1007/s0058 6-020-06356 -0) contains supplementary material, which is available to authorized users. * Bernard X. W. Liew
expenditures, and £9.1 billion incurred as loss economic productivity within the UK alone [2]. Being able to pre-dict the clinical course of LBP—i.e. whether it improves, persists, relapses, or worsens—is highly relevant since such knowledge would guide clinical expectations of recovery and would assist clinicians in matching different clinical phenotypes to specific interventions.
Increasingly, researchers are turning towards advance statistical learning techniques to develop accurate predic-tion models for people with LBP using informapredic-tion from high-dimensional, multivariate biological signals [3]. Exist-ing studies have used biological signals such as surface electromyography (sEMG) [4, 5], kinematics [6, 7], brain neuroimaging [3], and spine neuroimages [8] as candidate predictors; feeding into statistical learning techniques such as support vector machine (SVM) [3–6], neural networks [7], and natural language processing [8]. The excellent predictive accuracy of current models developed using a spectrum of biological signals and statistical techniques has demonstrated the potential for such methods to assist clinical decision-making [3–8].
Despite their predictive value, prohibitive barriers exist towards a more generalized integration of advance predictive models into routine clinical practice. First, some biologi-cal signals, such as brain neuroimages [3], are not feasible to be collected as routine in most clinical settings. Second, candidate biological signals should ideally be collected dur-ing activities that are routinely assessed clinically, rather than more complex sporting manoeuvres such as golf [4]. Third, the current statistical techniques that are used do not produce solutions that are easily interpretable. For exam-ple, the quantitative influence of each biological predictor on the response cannot be easily determined using neural networks and SVM. Fourth, the number of features that can be extracted from biological signals can be large, whilst parsimonious models may be more desirable clinically. A parsimonious model is not only more interpretable, but also it reduces the operational burden of subsequent data collection.
Lifting is an ideal task from which biological signals can be extracted to discriminate LBP status, given that it is commonly implicated as a risk factor for future LBP [9], it is a task that LBP individuals may fear performing [10], and it is a task which commonly provokes pain [11]. Com-pared with healthy controls, people with LBP typically lift with greater thoraco-lumbar spinal flexion [12]; more anti-phase lumbar-hip coordination [13]; greater accessory spi-nal movements [14]; greater erector spinae, latissimus dorsi, rectus abdominis, and external oblique activity [15, 16]; and greater trunk flexor–extensor co-activation [15, 17]. Surpris-ingly, no studies have considered the discriminatory value of these kinematic and EMG variables when used within a functional, time-series context. Functional variables may
provide more information on an individual’s movement impairments than scalar variables (e.g. means, peaks), given that the former contains both magnitude and temporal infor-mation. For example, physical impairments such as impaired flexion–relaxation response of the erector spinae have been found early in the trunk flexion phase [18]. This is in addi-tion to the fact that spinal loads are not constant across the lifting and lowering phases [19].
The primary purpose of the present study is to develop and determine the predictive performance of statistical mod-els to distinguish different LBP sub-types and healthy con-trols from each other, using whole-body electromyographic and kinematic variables as predictors collected during a functional lifting task. Three models were developed to dis-tinguish individuals with a current episode of LBP (LBP) from asymptomatic individuals (con); individuals in symp-tom remission (rmLBP) from controls; and individuals with current LBP from those in remission. Herein, we used a state-of-the-art machine learning technique, termed func-tional data boosting (FDboost). Potential benefits of FDboost in the present context are that it can perform variable selec-tion simultaneously with model fitting.
Materials and methods
Design
This single-session study was conducted within the motion capture laboratory of the Centre of Precision Rehabilitation for Spinal Pain, University of Birmingham, UK, between 1 May 2018 and 31 October 2018. The study obtained ethi-cal approval from the Ethics Committee of the University of Birmingham, UK (ERN_17-1717). All participants pro-vided written informed consent prior to participation, and the study adhered to the Declaration of Helsinki.
Participants
Participants between 18 and 55 years old with adequate conversational English language were invited to volunteer. Participants were eligible to be included into one of three groups based on the following criteria:
• Current low back pain (LBP): present episode of LBP lasting > 24 h, with a minimum intensity on the Numeri-cal Rating SNumeri-cale (NRS) score of greater than or equal to 2/10 (0 no pain, 10 being maximal pain) [20].
• Remission low back pain (rmLBP): presently in symptom remission from a LBP episode experienced within the last year, with an NRS score of less than or equal to 1/10
• Controls: no relevant history of LBP that limited their function and/or required treatment from a health profes-sional in the past year.
Participants were excluded if they had previous spinal surgery, spinal fracture, rheumatologic, metabolic, infectious conditions as self-reported, with ability to perform at least 10 full spinal flexion repetitions on screening, pregnancy, and any medical conditions which preclude safe execution of lifting.
Lifting task
Participants performed a repetitive low-load (7% body weight [BW]) [21] lifting task of a basket (30 × 36 × 10 cm) from the ground surface, with the midpoint of the basket’s handle positioned 25 cm forward horizontally from the mid-point of the foot on the ground. A horizontal distance of 25 cm was close to a distance previously used [22], which could reasonably be performed by LBP individuals repeat-edly as evaluated in pilot tests.
Lifting was performed barefooted, with the position of the foot fixed at 30 cm between the bilateral malleoli [23], with participants freely selecting a toe-out angle. Partici-pants were instructed to “lift in a way that is most comfort-able”, such that participants could lift in any bimanually symmetrical style [24]. Participants were also instructed to keep their heels on the ground and to maintain a broadly consistent lifting style throughout the task. A lifting repeti-tion (defined below) where the heels lifted off the ground or participants grossly changed their lifting style (e.g. from a stoop fully extended knees to a squat with fully flexed knees) was rejected, and participants were reminded of the task requirements. Participants performed six sets of five con-secutive repetitions of lifting, with an inter-set rest period of at least 5 min. Lifting was performed at a self-determined pace, with the natural frequency of lifting determined during practice, and subsequently fixed to that frequency using an auditory metronome.
Assessment
Marker trajectories were captured with eight motion cap-ture cameras sampling at 250 Hz (BTS SMART-DX 6000, BTS Bioengineering Corp, Italy). Retroreflective 14-mm markers were placed on the feet bilaterally (first and fifth metatarsophalangeal head, posterior surface mid-calcaneus), pelvis (bilateral anterior and posterior superior iliac spines), bilateral acromion, and posterior surface of the mid-distal radioulnar joints (wrist).
Prior to EMG electrode placements, the skin was shaved, gently abraded, and wiped with alcohol, in accordance with the SENIAM guideline [25]. Fifteen wireless EMG
electrode pairs sampling at 1000 Hz (BTS FreeEMG, BTS Bioengineering Corp, Italy) were placed unilaterally on the biceps brachii (BicepsB), anterior deltoid (AntDelt), latis-simus dorsi (LatsD) (lateral to T9 over the muscle belly) [26], external oblique (EO) (approximately 15 cm lateral to the umbilicus) [26], rectus abdominis (RA) (3 cm lateral to umbilicus) [27], iliocostalis lumborum (Ileoc) (1 cm lateral to the L5 spinous process) [28], longissimus thoracis pars thoracis (Longis) (5 cm lateral to the T9 spinous process) [28], soleus (Sol), lateral gastrocnemius (GL), tibialis ante-rior (TA), vastus lateralis (VL), rectus femoris (RF), sem-itendinosus (ST), biceps femoris (BicepsF), and gluteus maximus (GMax). The side for EMG electrode placements was on the right for controls and on the side of previous/ current pain for the LBP groups.
Data processing
A virtual landmark termed “pelvis” was calculated using the proximal endpoint of the modelled inertial pelvic seg-ment (“pelvis”) using the segseg-ment inertial and geometric properties of Dempster et al. [29] and Hanavan et al. [30], respectively. A virtual coordinate system was created with three virtual landmarks: the origin at the midpoint of bilat-eral calcanei marker projected onto the floor, the midpoint of the bilateral first MTP marker projected onto the floor, and a landmark projected 10 cm vertically above the origin. The vertical and anterior–posterior (AP) linear displacements of the following markers/landmarks were calculated relative to the virtual coordinate system, normalized to the participant’s height, for use as predictors in the statistical model: right wrist (given task symmetry), right acromion, and pelvis. Marker trajectories were filtered with a low-pass, zero-lag, fourth-order, Butterworth filter (6 Hz).
EMG signals were high-pass-filtered with a fast Fourier transform at 40 Hz to remove the electrocardiogram artefact. Subsequently, the signals were rectified and low-pass-filtered with a zero-lag, fourth-order, Butterworth filter (5 Hz) [31]. The maximal EMG amplitude of each muscle per repetition was extracted and averaged within a set to create a normal-izing factor [32]. EMG amplitude of each muscle per lifting set was divided by the normalizing factor. The RA EMG signals were excluded due to movement artefact occurring in individuals who lifted with significant magnitudes of trunk flexion, such that the electrodes were lifted from the body surface.
One lifting repetition was defined from the time when the load left the ground, to a fully upright body posture, and when the load contacted the ground again. Two phases were defined: lifting started when the positive-vertical velocity of the right acromion marker exceeded 10%, and ended when it dropped below 10% of its peak vertical velocity during each set. Lowering began when the negative-vertical velocity of
the right acromion marker exceeded 10%, and ended when it dropped below 10% of its peak vertical velocity during each set. Segmentation of the kinematic and EMG signals was undertaken independently for each lifting and lowering phase and was time-normalized to 101 data points.
Statistical model
Simple linear regression and logistic regression were used for between-group comparisons in the baseline demographic and pain characteristics, for continuous and categorical vari-ables, respectively.
Three scalar-on-function (SoFR) logistic regression models were used for binary classification of LBP statuses (model 1: con vs. LBP; model 2: con vs. rmLBP; model 3: rmLBP vs. LBP). A SoFR model is one where the response variable takes on scalar values, and the covariates take on functional (or scalar) values. Functional regression models are extensions of standard regression models such as gen-eralized additive models. Fourteen EMG and six kinematic (vertical and AP displacements of three markers/landmarks) functional variables were available for each lifting and low-ering phase, making a total of 40 predictors. For each model, EMG and kinematic variables were independently screened for high collinearity, and variables which exhibited a high absolute correlation of > 0.7 with all other EMG and kin-ematic covariates [33], respectively, were excluded. The number of functional predictors retained was 30 for model 1 and 2 and 31 for model 3. All functional variables were demeaned as a pre-processing step, so that different predic-tors had equal potential to be included in the model. For each model, we adjusted for the effects of sex (male vs. female) by including it as a predictor, meaning that the final number of predictors included in model 1 was 31, model 2 was 31, and model 3 was 32.
We used component-wise gradient boosting for model fitting [34]. The algorithm is an iterative procedure which successively adds one covariate to the model, like a sequen-tial forward stepwise regression, with the ability to handle functional covariates, perform variable selection, and allow for penalized estimation. In order to estimate the optimal number of iteration to optimize the negative log-likelihood of the Bernoulli distribution, cross-validation was performed on 25 bootstrap samples of the data, each with a roughly similar ratio of individuals in each group. The area under the receiver operating characteristic curve (AUC) was used to quantify the model’s ability to discriminate the two groups. All analyses were performed using R version 3.5.3, using the “FDboost” package [34], and the codes with results are found in the following repository [35].
Results
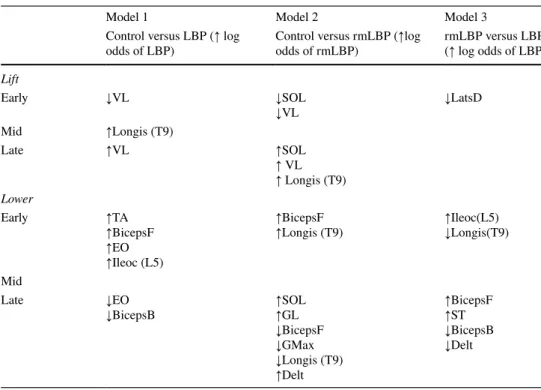
Forty-nine participants participated in the study (con-trol = 16, rmLBP = 16, LBP = 17), the demographic and clinical characteristics of which are shown in Table 1. The group-averaged kinematic and EMG waveforms are reported in Figs. 1 and 2.
The optimal number of iterations was 201 for model 1, 364 for model 2, and 614 for model 3. Based on the optimal iteration number, seven predictors (two lifting and five lowering) were selected in model 1 (con vs. LBP), which achieved an out-of-bag AUC of 90.4%; nine predic-tors (three lifting, six lowering) were selected in model 2 (con vs. rmLBP) which achieved an out-of-bag AUC of 91.2%; and seven predictors (one lifting, six lowering) were selected in model 3 (rmLBP vs. LBP) which achieved an out-of-bag AUC of 96.7%. Table 2 provides a qualita-tive summary of the discriminatory value of the selected
Table 1 Mean (standard deviation) of demographic and pain-related characteristics
NRS Numerical Rating Scale, TSK Tampa Scale for Kinesiophobia, PASS-20 Pain Anxiety Symptoms Scale-20, ODI Oswestry Disability Index
* Significantly different from control + Significantly different from rmLBP
Control (n = 16) rmLBP (n = 16) LBP (n = 17)
Female/male 9/7 6/10 13/4+
Age (years) 29.94 (9.61) 38.69 (10.54)* 39.76 (11.00)*
Height (cm) 168.38 (6.61) 171.69 (11.22) 168.68 (7.78)
Weight (kg) 68.48 (13.65) 71.18 (11.49) 71.37 (12.57)
Pain (NRS: 0 no pain–10 max pain) – 1 (0) 4.06 (1.94)+ TSK (17 no fear–68 max fear) – 36.25 (5.66) 39.76 (6.01) PASS-20 (0 no anxiety–200 max anxiety) – 31.19 (19.79) 36.06 (18.16) ODI (0 no disability–50 max disability) – 2.69 (3.11) 10.76 (6.14)+ Lifting phase duration (s) 1.05 (0.13) 1.11 (0.12) 1.13 (0.20) Lowering phase duration (s) 1.13 (0.16) 1.18 (0.14) 1.22 (0.28)
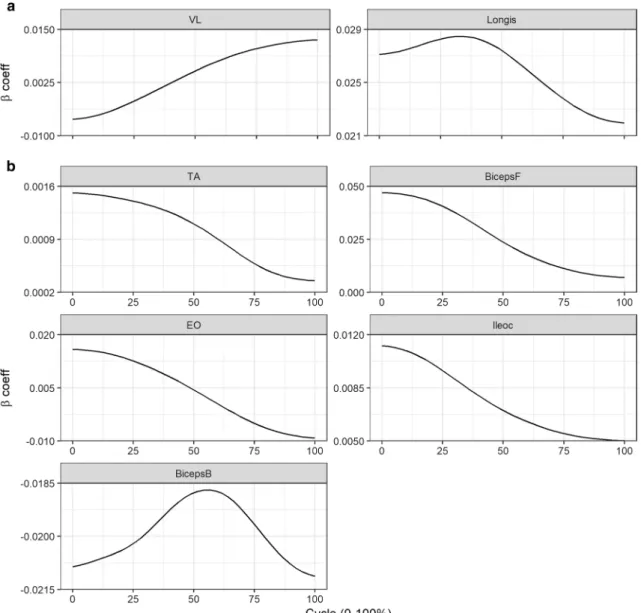
predictors. The time-varying 𝛽-coefficient plots for each predictor in each model can be found in Figs. 3, 4 and 5. The predictor with the largest magnitude of 𝛽 coefficient was the BF muscle with peak 𝛽 of 0.047 at the early phase
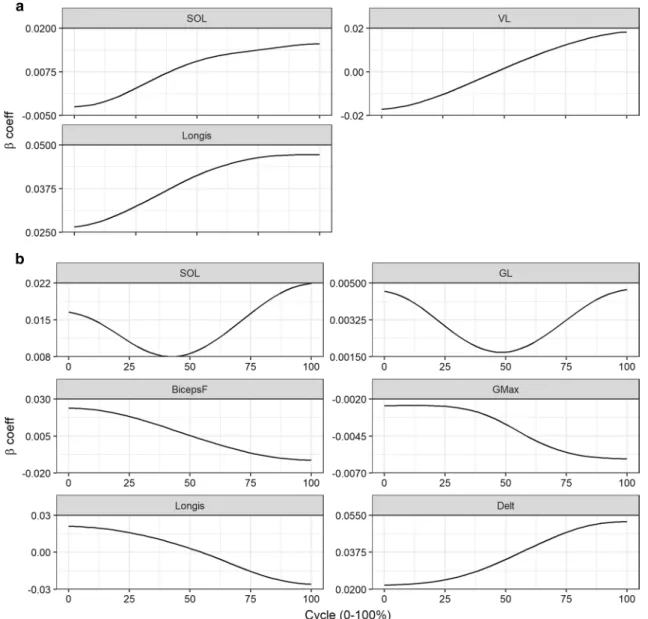
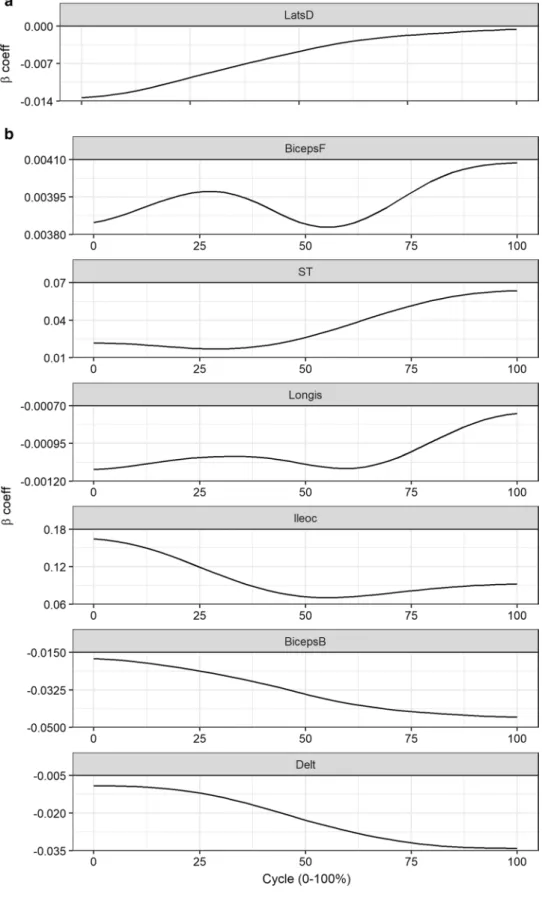
(0% cycle) of lowering in model 1, the deltoid muscle with peak 𝛽 of 0.052 at the late phase (100% cycle) of lowering in model 2, and the Ileoc muscle with peak 𝛽 of 0.16 at the early phase (0% cycle) of lowering in model 3 (Table 2).
Fig. 1 Group mean amplitude normalized (%) linear envelopes of the:
a lower limb muscles, b hip, trunk, and upper limb muscles, during lifting and lowering phases. TA tibialis anterior, SOL soleus, GL gas-trocnemius lateralis, VL vastus lateralis, RF rectus femoris, BicepsF
biceps femoris, ST semitendinosus, GMax gluteus maximus, EO
external oblique, Longis longissimus thoracis pars thoracis, Ileoc ili-ocostalis lumborum, LatsD latissimus dorsi, BicepsB biceps brachii,
Delt deltoids, con control, rmLBP remission low back pain, LBP low back pain
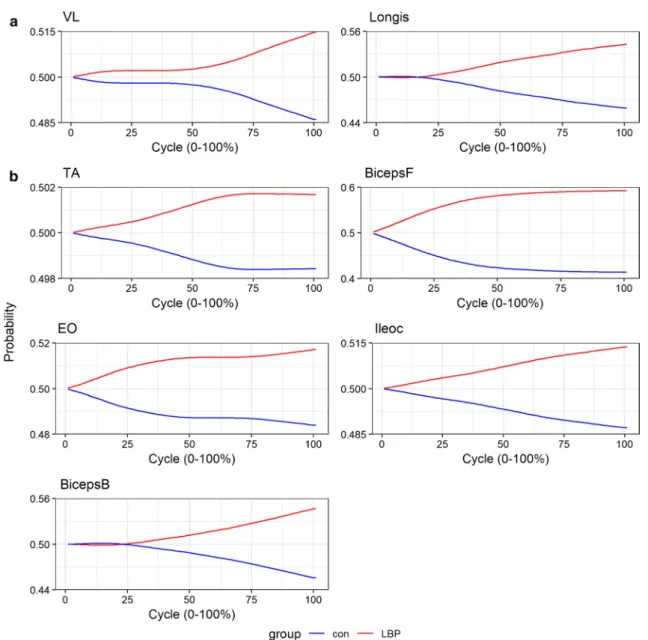
To provide another visualization to interpret the models’ solutions, the group-averaged waveform values were input-ted into the model, and the predicinput-ted cumulative increase in class probabilities was calculated when a change occurred across all time points (0–100% cycle) of the lifting or lower-ing phases (Figs. 6, 7 and 8). As one example, if a 1% unit increase in BF muscle activity were to occur across all time points during lowering, the probability of being in the LBP group increases, which plateaus after 50% of the lowering phase cycle (Fig. 6). In other words, most of the difference between groups for the BF muscle in lowering phase lie in the first half of the task duration.
Discussion
In the present study, functional kinematic and EMG predic-tors in a simple lifting task were used to predict LBP statuses utilizing FDboost. Our models revealed that 7–9 EMG vari-ables collected during lifting and lowering produced excel-lent predictive probabilities. More importantly, our models are highly interpretable, in that a parsimonious number of physiological relationships could be understood to increase the certainty of different LBP sub-types.
The physiological relationships between muscle activa-tion and the predicactiva-tion of LBP were partially supported by existing literature, even though the latter focused on
hypothesis testing rather than prediction. Falla et al. [11] reported greater EMG amplitude of the lumbar erector spi-nae, during sub-maximal lifting and lowering in LBP indi-viduals compared to controls. Haddas et al. [36] reported greater EMG amplitude of the multifidus (L5 level) muscle during the early phase of maximal effort lifting in individu-als with LBP compared to controls. In addition, high-density EMG revealed that LBP individuals recruited more caudal, and controls recruited more cranial regions of the lum-bar erector spinae during a sub-maximal lifting task [11]. Regional differences in activation of the erector spinae at different phases during the lifting task were not reported [11]. The present study showed that greater lumbar extensor activity increased the certainty of being in the LBP group, which concurred with Falla et al. [11]. However, we also found that more activity in the cranial Longis muscle in the early lifting phase and more activity in the caudal Ileoc mus-cle in the early lowering phase increased the certainty of being in the LBP group.
The evidence on whether muscular activity differs between healthy controls and individuals in LBP remis-sion is conflicting in part because of the varying motor tasks investigated. When performing 90° walking turns, there were no differences in EMG amplitude of the deep multifidus, lumbar longissimus, and thoracic longissimus muscles between individuals in rmLBP and controls [37]. Yet, individuals in rmLBP demonstrated greater thoracic
Fig. 2 Group mean linear displacement (m) in the: a vertical and b
anterior–posterior direction of the wrist and shoulder marker, and pel-vis landmark, during lifting and lowering phases. RACR right
acro-mion, RWRST right wrist, con control, rmLBP remission low back pain, LBP low back pain
longissimus activity than controls when sitting in a long lor-dotic posture [38]. Chiou et al. [39] reported no differences in EMG amplitude of the erector spinae muscles (at T12 and L4 levels) during sub-maximal and maximal prone lumbar extensions. A previous study reported greater erector spinae (L1 level) activity but similar activities of the multifidus (L5 level) and EO in individuals in LBP remission during the lifting phase, compared to controls [40]. Given that lifting as a task is commonly implicated as a risk factor for future LBP [9], and that it is a task LBP individuals often have a fear of performing [10], it is suggested that future studies should focus their efforts on collecting predictors from this task.
Pain has been shown to alter the activities of muscles both local and remote to the dominant site of pain, such that their collective response to pain may be seen as a coordinative strategy to ensure consistent task performance despite pain [41–43]. We observed that individuals who used more ham-strings and less upper limb muscles to lower the load had a greater certainty of being in the LBP, relative to the rmLBP group (Table 2). The compensatory muscular strategy
between the lower and upper limbs provides evidence of the importance of quantifying whole-body muscular coor-dination patterns as potential risk factors in LBP research. Interestingly, all studies comparing differences in muscular activity between different LBP sub-types during a lifting task have focused on measuring muscle activity only of the abdominal, trunk extensor, and hip extensor muscles [11,
36, 40, 44]. The present findings uniquely demonstrate that activities of muscles as distal as the ankle dorsiflexors, and as proximal as the deltoids, can contribute to the accuracy of predictive models in LBP research.
Previous studies have reported altered kinematics between individuals with and without LBP at the ankle, knee, and hip joints [45] and even altered inter-segmental coordination between the lumbar–hip and between the hip–knee joints during lifting [13]. However, no differences in trunk, hip, knee, ankle linear and angular displacements, velocities, and accelerations were reported between people with and without LBP during the lifting and lowering phase of a 12 kg box from the floor [44]. Given that Lariviere
Table 2 Qualitative directional effect muscle activation alterations have on predicted log odds of being in the alternative group (LBP for models 1 and 3, rmLBP for model 2)
If β coefficient is positive or negative over the task cycle, only the directional effect with the largest magni-tude for each predictor is reported. If β coefficient has dual signs (positive and negative) over the task cycle, directional effects with the largest magnitude for each sign are reported
Cycle—early: 0–33% cycle; mid: 34–66% cycle; late: 67–100% cycle Direction of effect—↑: increase; ↓ decrease
Groups—LBP low back pain, rmLBP remission low back pain
Muscles—TA tibialis anterior, SOL soleus, GL gastrocnemius lateralis, VL vastus lateralis, RF rectus femo-ris, ST semitendinosus, BicepsF biceps femoris, GMax gluteus maximus, EO external oblique, Ileoc ili-ocostalis lumborum, Longis longissimus thoracis pars thoracis, LatsD latissimus dorsi, Delt deltoids,
BicepsB biceps brachii
Model 1 Model 2 Model 3
Control versus LBP (↑ log
odds of LBP) Control versus rmLBP (odds of rmLBP) ↑log rmLBP versus LBP (↑ log odds of LBP)
Lift Early ↓VL ↓SOL ↓VL ↓LatsD Mid ↑Longis (T9) Late ↑VL ↑SOL ↑ VL ↑ Longis (T9) Lower Early ↑TA ↑BicepsF ↑EO ↑Ileoc (L5) ↑BicepsF
↑Longis (T9) ↑↓Ileoc(L5)Longis(T9) Mid Late ↓EO ↓BicepsB ↑↑SOLGL ↓BicepsF ↓GMax ↓Longis (T9) ↑Delt ↑BicepsF ↑ST ↓BicepsB ↓Delt
et al. [44] reported greater thoracic erector spinae activity during the lifting and lowering phases in people with LBP compared to controls, taken with the present findings, mus-cular activation strategies may be more useful biomarkers of an individual’s spinal health than kinematic predictors. It remains to be investigated whether EMG predictors of LBP status would be selected once inclusion of a thorough set of functional kinematic predictors is considered.
Despite the optimism of the models present, the current study has some limitations. First, this study had a relatively small sample size compared to the number of predictors. The number of participants in the present study was, how-ever, comparable to other similar researches in clinical
biomechanics (n = 41 in [46], n = 44 in [47]). Results from the study will enable future researchers to fit the presently reported model’s learning curve to inverse power law mod-els [48] and to estimate the sample size needed to achieve a desired classification performance. Second, the variables used for model building were collected in a single ses-sion, which although reflected a typical clinical assessment scenario, may not reflect normal movement behaviour in daily living. With more advance wearable sensor technol-ogy emerging which allows remote biomechanics analysis [49], the methods employed presently can be exploited to yield statistical models which have greater ecological valid-ity, and ultimately better personalized predictive accuracy.
Fig. 3 Beta coefficients (log odds) at each 1% cycle of selected pre-dictors in model 1 (con vs. LBP). a Lifting and b lowering predictors.
BicepsB biceps brachii, BicepsF biceps femoris, EO external oblique,
Ileoc iliocostalis lumborum, Longis longissimus thoracis pars thora-cis, TA tibialis anterior, VL vastus lateralis, con control, lbp low back pain
Third, we did not include age as a predictor during model building even though individuals with LBP and rmLBP were significantly older than controls. Even though previous stud-ies have reported age-related differences in movement and control strategies [50, 51], these differences were examined between adult cohorts with ~ 40 years in age gap. Lastly, given the cross-sectional nature of this study, we view the current work through the lens of a “hypothesis generation” framework, where we explored the predictive value of functional kinematic and EMG variables in a LBP setting. Future work would be to build predictive models using func-tional movement variables and subjective reports of pain,
psychological function and physical function, and patient characteristics in a prospective cohort setting.
The ability to transform time-varying physiological dif-ferences into difdif-ferences in clinical outcomes could be used in future research to predict those likely to develop LBP. Whilst this is not the focus of the current work, it certainly provides the foundation to examine this in a longitudinal study. Although it is interesting to use such models to predict who has or doesn’t have LBP, clinically it is certainly more relevant to be able to predict who is likely to develop LBP, persistence, and its relapse and identify the dominant move-ment impairmove-ments that drive the increased risk that would
Fig. 4 Beta coefficients (log odds) at each 1% cycle of selected pre-dictors in model 2 (con vs. rmLBP). a Lifting and b lowering pre-dictors. BicepsF biceps femoris, Delt deltoids, GL gastrocnemius
lateralis, GMax gluteus maximus, Longis longissimus thoracis pars thoracis, SOL soleus, VL vastus lateralis, con control, rmlbp remis-sion low back pain
Fig. 5 Beta coefficients (log odds) at each 1% cycle of selected predictors in model 3 (rmLBP vs. LBP). a Lifting and
b lowering predictors. BicepsB
biceps brachii, BicepsF biceps femoris, Delt deltoids, Ileoc
iliocostalis lumborum, Longis
longissimus thoracis pars thora-cis, LatsD latissimus dorsi, ST
have direct implications for management and preventative strategies. FDboost can also be extended to performing regression analysis, where the outcome is a continuous vari-able (e.g. fear-avoidance levels). Given that explicit reports may not correspond to actual implicit measurements of an individual’s psychophysical status [10], currently, it is not feasible to perform implicit measurements of an individual’s psychophysical status in a clinical environment due to the
lengthy time involved. In such a scenario, a statistical model can be trained in a laboratory environment that predicts implicit psychophysical levels using objectively collected movement variables and measure the pertinent movement variables clinically to predict their likely implicit psycho-physical levels.
Fig. 6 Predicted cumulative probability of being in the LBP group given an input of each group’s (con and LBP) average waveform for each selected predictor in model 1. a Lifting and b lowering predic-tors. Probabilities reflect the additive increase in certainty given the observed difference between groups in EMG amplitude for every 1%
of the movement cycle. BicepsB biceps brachii, BicepsF biceps femo-ris, EO external oblique, Ileoc iliocostalis lumborum, Longis longis-simus thoracis pars thoracis, TA tibialis anterior, VL vastus lateralis,
Conclusions
Our approach of using functional kinematic and EMG vari-ables collected in a simple, yet clinically relevant task such as lifting, in conjunction with FDboost, produced clinically interpretable models that retain good to excellent predictive
capability. If the approach used presently can be extended to include predictors collected using wearable sensors, then our models could have great promise in delivering the breakthrough in predictive performance that can be feasibly implemented in a busy clinical environment.
Fig. 7 Predicted cumulative probability of being in the rmLBP group given an input of each group’s (con and rmLBP) average waveform for each selected predictor in model 2. a Lifting and b lowering pre-dictors. Probabilities reflect the additive increase in certainty given the observed difference between groups in EMG amplitude for every
1% of the movement cycle. BicepsF biceps femoris, Delt deltoids, GL
gastrocnemius lateralis, GMax gluteus maximus, Longis longissimus thoracis pars thoracis, SOL soleus, VL vastus lateralis, con control,
Fig. 8 Predicted cumulative probability of being in the LBP group given an input of each group’s (rmLBP and LBP) aver-age waveform for each selected predictor in model 3. a Lifting and b lowering predictors. Probabilities reflect the additive increase in certainty given the observed difference between groups in EMG amplitude for every 1% of the movement cycle. BicepsB biceps brachii,
BicepsF biceps femoris, Delt
deltoids, Ileoc iliocostalis lumborum, Longis longissimus thoracis pars thoracis, LatsD
latissimus dorsi, ST semitendi-nosus, rmLBP remission low back pain, LBP low back pain
Funding This study was supported by funding from the EUROSPINE Task Force Research pilot study Grant (ID 2018_10).
Compliance with ethical standards
Conflict of interest All authors declare that they have no conflicts of interest.
Ethical approval Ethical approval was obtained from the Human Research Ethics Committee of the University of Birmingham, UK (ERN_17-1717).
Open Access This article is licensed under a Creative Commons Attri-bution 4.0 International License, which permits use, sharing, adapta-tion, distribution and reproduction in any medium or format, as long as you give appropriate credit to the original author(s) and the source, provide a link to the Creative Commons licence, and indicate if changes were made. The images or other third party material in this article are included in the article’s Creative Commons licence, unless indicated otherwise in a credit line to the material. If material is not included in the article’s Creative Commons licence and your intended use is not permitted by statutory regulation or exceeds the permitted use, you will need to obtain permission directly from the copyright holder. To view a copy of this licence, visit http://creat iveco mmons .org/licen ses/by/4.0/.
References
1. Vos T, Abajobir AA, Abate KH, Abbafati C, Abbas KM, Abd-Allah F, Abdulkader RS, Abdulle AM, Abebo TA, Abera SF, Aboyans V (2017) Global, regional, and national incidence, prevalence, and years lived with disability for 328 diseases and injuries for 195 countries, 1990–2016: a systematic anal-ysis for the Global Burden of Disease Study 2016. Lancet 390:1211–1259
2. Maniadakis N, Gray A (2000) The economic burden of back pain in the UK. Pain 84:95–103
3. Lee J, Mawla I, Kim J, Loggia ML, Ortiz A, Jung C et al (2019) Machine learning-based prediction of clinical pain using multi-modal neuroimaging and autonomic metrics. Pain 160:550–560 4. Silva L, Vaz JR, Castro MA, Serranho P, Cabri J,
Pezarat-Cor-reia P (2015) Recurrence quantification analysis and support vector machines for golf handicap and low back pain EMG clas-sification. J Electromyogr Kinesiol 25:637–647
5. Jiang N, Luk KD, Hu Y (2017) A machine learning-based sur-face electromyography topography evaluation for prognostic prediction of functional restoration rehabilitation in chronic low back pain. Spine (Phila Pa 1976) 42:1635–1642
6. Ashouri S, Abedi M, Abdollahi M, Dehghan Manshadi F, Par-nianpour M, Khalaf K (2017) A novel approach to spinal 3-D kinematic assessment using inertial sensors: towards effective quantitative evaluation of low back pain in clinical settings. Comput Biol Med 89:144–149
7. Hu B, Kim C, Ning X, Xu X (2018) Using a deep learning net-work to recognise low back pain in static standing. Ergonomics 61:1374–1381
8. Tan WK, Hassanpour S, Heagerty PJ, Rundell SD, Suri P, Huh-danpaa HT et al (2018) Comparison of natural language process-ing rules-based and machine-learnprocess-ing systems to identify lumbar spine imaging findings related to low back pain. Acad Radiol 25:1422–1432
9. Coenen P, Gouttebarge V, van der Burght AS, van Dieen JH, Frings-Dresen MH, van der Beek AJ et al (2014) The effect of
lifting during work on low back pain: a health impact assessment based on a meta-analysis. Occup Environ Med 71:871–877 10. Caneiro JP, O’Sullivan P, Smith A, Moseley GL, Lipp OV (2017)
Implicit evaluations and physiological threat responses in people with persistent low back pain and fear of bending. Scan J Pain 17:355–366
11. Falla D, Gizzi L, Tschapek M, Erlenwein J, Petzke F (2014) Reduced task-induced variations in the distribution of activity across back muscle regions in individuals with low back pain. PAIN® 155:944–953
12. Hemming R, Sheeran L, van Deursen R, Sparkes V (2018) Non-specific chronic low back pain: differences in spinal kinematics in subgroups during functional tasks. Eur Spine J 27:163–170 13. Pranata A, Perraton L, El-Ansary D, Clark R, Mentiplay B, Fortin
K et al (2018) Trunk and lower limb coordination during lifting in people with and without chronic low back pain. J Biomech 71:257–263
14. Dideriksen JL, Gizzi L, Petzke F, Falla D (2014) Deterministic accessory spinal movement in functional tasks characterizes indi-viduals with low back pain. Clin Neurophysiol 125:1663–1668 15. Marras WS, Davis KG, Ferguson SA, Lucas BR, Gupta P (2001)
Spine loading characteristics of patients with low back pain compared with asymptomatic individuals. Spine (Phila Pa 1976) 26:2566–2574
16. Ferguson SA, Marras WS, Burr DL, Davis KG, Gupta P (2004) Differences in motor recruitment and resulting kinematics between low back pain patients and asymptomatic participants during lifting exertions. Clin Biomech (Bristol, Avon) 19:992–999 17. Hubley-Kozey CL, Vezina MJ (2002) Differentiating temporal
electromyographic waveforms between those with chronic low back pain and healthy controls. Clin Biomech (Bristol, Avon) 17:621–629
18. Murillo C, Martinez-Valdes E, Liew B, Heneghan N, Sanderson A, Rushton A et al (2019) High-density electromyography pro-vides new insights into the flexion relaxation phenomenon in peo-ple with low back pain. In: 11th Congress of the European pain federation EFIC. Valencia, Spain
19. Faber GS, Kingma I, van Dieen JH (2011) Effect of initial hori-zontal object position on peak L5/S1 moments in manual lifting is dependent on task type and familiarity with alternative lifting strategies. Ergonomics 54:72–81
20. Stanton TR, Latimer J, Maher CG, Hancock M (2009) Definitions of recurrence of an episode of low back pain: a systematic review. Spine (Phila Pa 1976) 34:E316–E322
21. Graham RB, Sadler EM, Stevenson JM (2012) Local dynamic stability of trunk movements during the repetitive lifting of loads. Hum Mov Sci 31:592–603
22. Schipplein OD, Reinsel TE, Andersson GB, Lavender SA (1995) The influence of initial horizontal weight placement on the loads at the lumbar spine while lifting. Spine (Phila Pa 1976) 20:1895–1898
23. Zhou J, Dai B, Ning X (2013) The assessment of material han-dling strategies in dealing with sudden loading: influences of foot placement on trunk biomechanics. Ergonomics 56:1569–1576 24. Asgari N, Sanjari MA, Esteki A (2017) Local dynamic stability
of the spine and its coordinated lower joints during repetitive lift-ing: effects of fatigue and chronic low back pain. Hum Mov Sci 54:339–346
25. Hermens HJ, Freriks B, Disselhorst-Klug C, Rau G (2000) Devel-opment of recommendations for SEMG sensors and sensor place-ment procedures. J Electromyogr Kinesiol 10:361–374
26. Vera-Garcia FJ, Moreside JM, McGill SM (2011) Abdominal muscle activation changes if the purpose is to control pelvis motion or thorax motion. J Electromyogr Kinesiol 21:893–903 27. McGill S, Juker D, Kropf P (1996) Appropriately placed surface
lumborum, abdominal wall) in the lumbar spine. J Biomech 29:1503–1507
28. Vera-Garcia FJ, Moreside JM, McGill SM (2010) MVC tech-niques to normalize trunk muscle EMG in healthy women. J Electromyogr Kinesiol 20:10–16
29. Dempster W. Space requirements of the seated operator: Geo-metrical, kinematic, and mechanical aspects of the body with special reference to the limbs. Wright-Patterson Air Force Based, OH1955
30. Hanavan E. A mathematical model of the human body: Behav-ioural sciences laboratory. Write-Patterson Air Force Base, OH1964
31. de Looze MP, Toussaint HM, van Dieen JH, Kemper HC (1993) Joint moments and muscle activity in the lower extremi-ties and lower back in lifting and lowering tasks. J Biomech 26:1067–1076
32. Kieliba P, Tropea P, Pirondini E, Coscia M, Micera S, Artoni F (2018) How are muscle synergies affected by electromyography pre-processing? IEEE Trans Neural Syst Rehabil Eng 26:882–893 33. Hinkle D, Wiersma W, Jurs S (2003) Applied statistics for the
behavioral sciences, 5th edn. Houghton Mifflin, Boston
34. Brockhaus S, Rügamer D, Greven S (2017) Boosting functional regression Models with FDboost
35. Liew B, Rugamer D, De Nunzio A, Falla D (2019) Interpretable machine learning models for classifying low back pain status using functional physiological variables, 2 edn. Mendeley Data. https ://doi.org/10.17632 /stbx7 79nt6 .22019
36. Haddas R, Yang J, Lieberman I (2016) Effects of volitional spine stabilization on lifting task in recurrent low back pain population. Eur Spine J 25:2833–2841
37. Smith JA, Kulig K (2016) Altered multifidus recruitment during walking in young asymptomatic individuals with a history of low back pain. J Orthop Sports Phys Ther 46:365–374
38. Claus AP, Hides JA, Moseley GL, Hodges PW (2018) Different ways to balance the spine in sitting: muscle activity in specific postures differs between individuals with and without a history of back pain in sitting. Clin Biomech (Bristol, Avon) 52:25–32 39. Chiou SY, Jeevathol A, Odedra A, Strutton PH (2015) Voluntary
activation of trunk extensors appears normal in young adults who have recovered from low back pain. Eur J Pain 19:1506–1515 40. Suehiro T, Ishida H, Kobara K, Osaka H, Watanabe S (2018)
Altered trunk muscle recruitment patterns during lifting in indi-viduals in remission from recurrent low back pain. J Electromyogr Kinesiol 39:128–133
41. Hug F, Tucker K (2017) Muscle coordination and the development of musculoskeletal disorders. Exerc Sport Sci Rev 45:201–208 42. Liew B, Del Vecchio A, Falla D 2018 The influence of
mus-culoskeletal pain disorders on muscle synergy. PLoS ONE 13:e0206885
43. Gizzi L, Muceli S, Petzke F, Falla D (2015) experimental muscle pain impairs the synergistic modular control of neck muscles. PLoS ONE 10:e0137844
44. Lariviere C, Gagnon D, Loisel P (2002) A biomechanical com-parison of lifting techniques between subjects with and without chronic low back pain during freestyle lifting and lowering tasks. Clin Biomech (Bristol, Avon) 17:89–98
45. Commissaris DA, Nilsson-Wikmar LB, Van Dieen JH, Hirschfeld H (2002) Joint coordination during whole-body lifting in women with low back pain after pregnancy. Arch Phys Med Rehabil 83:1279–1289
46. Watari R, Osis S, Ferber R (2018) Use of baseline pelvic accelera-tion during running for classifying response to muscle strength-ening treatment in patellofemoral pain: a preliminary study. Clin Biomech (Bristol, Avon) 57:74–80
47. Benson LC, Clermont CA, Osis ST, Kobsar D, Ferber R (2018) Classifying running speed conditions using a single wearable sensor: optimal segmentation and feature extraction methods. J Biomech 71:94–99
48. Figueroa RL, Zeng-Treitler Q, Kandula S, Ngo LH (2012) Pre-dicting sample size required for classification performance. BMC Med Inform Decis Mak 12:8
49. Gurchiek RD, Choquette RH, Beynnon BD, Slauterbeck JR, Tour-ville TW, Toth MJ et al (2019) Open-source remote gait analysis: a post-surgery patient monitoring application. Sci Rep 9:17966 50. Crawford R, Gizzi L, Dieterich A, Ni Mhuiris A, Falla D (2018)
Age-related changes in trunk muscle activity and spinal and lower limb kinematics during gait. PLoS ONE 13:e0206514
51. da Silva RA, Vieira ER, Leonard G, Beaulieu LD, Ngomo S, Now-otny AH et al (2019) Age- and low back pain-related differences in trunk muscle activation during one-legged stance balance task. Gait Posture 69:25–30
Publisher’s Note Springer Nature remains neutral with regard to jurisdictional claims in published maps and institutional affiliations.
Affiliations
Bernard X. W. Liew1 · David Rugamer2,3 · Alessandro Marco De Nunzio4 · Deborah Falla5
1 School of Sport, Rehabilitation and Exercise Sciences, University of Essex, Colchester CO4 3SQ, Essex, UK 2 Department of Statistics, Ludwig-Maximilians-Universität
München, Munich, Germany
3 Chair of Statistics, School of Business and Economics, Humboldt University of Berlin, Berlin, Germany
4 LUNEX International University of Health, Exercise and Sports, 50, Avenue du Parc des Sports, 4671 Differdange, Luxembourg
5 Centre of Precision Rehabilitation for Spinal Pain (CPR Spine), School of Sport, Exercise and Rehabilitation Sciences, University of Birmingham, Edgbaston B152TT, UK