Statistical Methods for Integrated Cancer
Genomic Data Using a Joint Latent Variable
Model
Esther Drill
Submitted in partial fulfillment of the requirements for the degree
of Doctor of Public Health in the Department of Biostatistics at the Mailman School of Public Health
COLUMBIA UNIVERSITY
c
2018
Esther Drill All Rights Reserved
ABSTRACT
Statistical Methods for Integrated Cancer
Genomic Data Using a Joint Latent Variable
Model
Esther Drill
Inspired by the TCGA (The Cancer Genome Atlas), we explore multimodal genomic datasets with integrative methods using a joint latent variable approach. We useiCluster+, an ex-isting clustering method for integrative data, to identify potential subtypes within TCGA sarcoma and mesothelioma tumors, and across a large cohort of 33 different TCGA cancer datasets. For classification, motivated to improve the prediction of platinum resistance in high grade serous ovarian cancer (HGSOC) treatment, we propose novel integrative meth-ods,iClassifyto perform classification using a joint latent variable model. iClassifyprovides effective data integration and classification while handling heterogeneous data types, while providing a natural framework to incorporate covariate risk factors and examine genomic driver by covariate risk factor interaction. Feature selection is performed through a thresh-olding parameter that combines both latent variable and feature coefficients. We demon-strate increased accuracy in classification over methods that assume homogeneous data type, such as linear discriminant analysis and penalized logistic regression, and improved feature selection. We apply iClassify to a TCGA cohort of HGSOC patients with three types of genomic data and platinum response data. This methodology has broad applica-tions beyond predicting treatment outcomes and disease progression in cancer, including predicting prognosis and diagnosis in other diseases with major public health implications.
Table of Contents
1 Introduction 1
1.1 Overview . . . 1
1.2 Introduction to Motivating Studies . . . 2
1.2.1 Molecular subtyping in cancer . . . 3
1.2.2 Classification in cancer: response to platinum chemotherapy . . . 5
1.3 Introduction to Statistical Methods . . . 10
1.3.1 Introduction to Integrative Clustering Methods . . . 10
1.3.2 Introduction to Integrative Classification Methods . . . 13
1.4 Summary of Introduction . . . 19
2 iCluster: Methods and Applications 21 2.1 Methods . . . 21
2.2 Data considerations . . . 23
2.3 Analysis of TCGA Sarcoma cohort . . . 24
2.4 Analysis of TCGA Mesothelioma cohort . . . 30
2.5 Analysis of TCGA Pancancer cohort . . . 37
2.6 Summary of iCluster analyses . . . 48
3 iClassify: Statistical Methodologies 50 3.1 Statistical framework for integrative genomics . . . 50
3.2 Estimation procedure . . . 52
3.3 Feature selection . . . 53
3.4 Prediction of disease status for new subjects . . . 54
3.5 Inclusion of covariates and interaction with genomic drivers . . . 54
4 iClassify: Simulation Studies 57 4.1 Integration of genomic platforms . . . 57
4.1.1 Feature selection . . . 61
4.1.2 Integrative vs. single platform comparison . . . 64
4.2 Simulations with covariate× genomic interaction . . . 65
4.3 Sensitivity Analysis: Simulations with covariate risk factor only . . . 70
5 iClassify: Application 74 5.1 TCGA Ovarian Cancer data set . . . 74
5.2 Imbalanced data considerations . . . 75
5.3 Pre-screening features . . . 77
5.4 Genomic-only Analysis . . . 77
5.4.1 Single platform vs Integrative Analysis . . . 81
5.5 Interaction analysis . . . 82
5.5.1 BRCA germline mutation . . . 82
5.5.2 Residual disease . . . 84
5.6 Summary of analysis . . . 86
6 Discussion and Future Research 87
Bibliography 91
List of Figures
1.1 Molecular mechanisms of cisplatin resistance [Galluzzi et al., 2014]. . . 7
1.2 Strategies for reverting cisplatin resistance [Galluzzi et al., 2012]. . . 8
1.3 The ’triangle” method for integration of genotype, expression, and phenotype data [Gamazon et al., 2013]. . . 14
2.1 iCluster Sarcoma analysis: BIC by cluster number . . . 26
2.2 iCluster Sarcoma analysis . . . 27
2.3 STLMS heatmap . . . 27
2.4 Disease Specific Survival by STLMS iCluster . . . 28
2.5 iCluster Sarcoma analysis . . . 29
2.6 iCluster Mesothelioma heatmap . . . 32
2.7 Epithelioid-only . . . 32 2.8 OS by MPM iClusters . . . 33 2.9 OS by MPM Epithelioid iClusters . . . 33 2.10 Th2 cells by MPM iCluster . . . 35 2.11 Bueno OS Validation . . . 37 2.12 Lopez-Rios OS Validation . . . 37
2.13 iCluster Pancancer analysis: BIC by cluster number . . . 40
2.14 iCluster Pancancer analysis heatmap . . . 41
2.15 Stromal Proportion of Pancancer iClusters . . . 43
2.16 Leukocyte Proportion of Pancancer iClusters . . . 43
2.17 iCluster silhouette width vs. cancer type proportion . . . 44
2.18 iCluster TumorMaps . . . 45
2.19 iCluster pathway analyses . . . 47
3.1 Schematics of the Proposed Integrative Genomic Method, iClassify . . . 51
4.1 Varying γ effects simulation: BIC by threshold . . . 63
4.2 Varying γ effects simulation: feature selection . . . 64
4.3 Latent variables by scenario and interaction effect sign . . . 67
5.1 Genomic-only analysis: comparative feature selection . . . 79
5.2 Genomic-only analysis: β estimation . . . 80
List of Tables
2.1 TCGA sarcoma analysis: types and sample sizes . . . 25
2.2 TCGA sarcoma analysis: features and platforms . . . 25
2.3 TCGA Mesothelioma analysis: histology and sample sizes . . . 30
2.4 TCGA Mesothelioma analysis: features and platforms . . . 31
2.5 All MPM: Multivariate Cox Regression . . . 34
2.6 Epithelioid cases: all-MPM vs Epithelioid-only iClusters . . . 36
2.7 TCGA pancancer analysis: cancer tumor types/categories . . . 38
2.8 TCGA pancancer analysis: features and platforms . . . 39
4.1 Simple scenarios (n= 100): parameter estimation . . . 57
4.2 Simple scenarios (n=100): prediction accuracy . . . 58
4.3 Simple scenarios (n=200): parameter estimation . . . 58
4.4 Simple scenarios (n= 200): prediction accuracy . . . 60
4.5 Three data type scenario (n=200): Estimation and Prediction Accuracy . . 61
4.6 Varying γ effects setup (n=200): Estimation and Prediction Accuracy . . . 61
4.7 Varying γ effects simulation: Hard thresholding and prediction accuracy . . 62
4.8 Varying γ effects simulation: Combined data types vs. single data type . . 65
4.9 Scenario A with covariate/genomic interaction: parameter estimation . . . 66
4.10 Scenario A with covariate/genomic interaction: prediction accuracy . . . . 67
4.11 Scenario D with covariate/genomic interaction: parameter estimation . . . 68
4.12 Scenario D with covariate/genomic interaction: prediction accuracy . . . . 69
4.13 Null interaction scenarios: parameter estimation . . . 70
4.14 Null interaction scenarios: prediction accuracy . . . 70
4.15 Scenario A with covariate risk factor only: parameter estimation . . . 71
4.16 Scenario A with covariate risk factor only: prediction accuracy . . . 71
4.17 Scenario D with covariate risk factor only: parameter estimation . . . 72
4.18 Scenario D with covariate risk factor only: prediction accuracy . . . 72
5.1 Platforms, features and datasets . . . 75
5.2 Clinical characteristics . . . 76
5.3 Genomic-only analysis: iClassify and Lasso classification accuracy . . . 77
5.4 Genomic-only analysis: parameter estimation . . . 80
5.5 Genomic-only analysis: Single platform vs Integrative analysis . . . 81
5.6 Genomic-only subset analysis: n=187 . . . 83
5.7 Classification accuracy: BRCA only and Genomicx BRCA interaction . . . 83
5.8 BRCA interaction analysis: γestimates and 95% bootstrap confidence intervals 84 5.9 Classification accuracy: Residual disease only and Genomicx residual inter-action . . . 85
5.10 Residual interaction analysis: γ estimates and 95% bootstrap confidence intervals . . . 85
Acknowledgments
First and foremost, my most sincere thanks to my dissertation advisors, Dr. Yuanjia Wang and Dr. Ronglai Shen, for their guidance and assistance over the last several years. They have been understanding about my unique path and circumstances, and have been stead-fastly patient, insightful, helpful, and wise.
And a huge and heartfelt thank you to the chair of my dissertation committee, Dr. Shuang Wang, and the other committee members, Dr. Iuliana Ionita-Laza and Dr. Jeanine Genkinger. This dissertation has been greatly improved as a result of their comments, questions and suggestions.
Also, a special thank you to Dr. Katherine Panageas at Memorial Sloan Kettering, who offered me a great job five years ago, and has been consistently supportive of my efforts to finish up my degree.
I couldn’t have finished without the support of those closest to me. For logistical support, huge thanks to my stellar mother-in-law, Sharon Messitte, who was always ready to help me find some time to work. For emotional support, I thank my mother Ruth Ignatoff, ever interested and willing to listen. For support of all kinds, and often on a daily basis, I thank the universe for Dr. Rebecca Drill, truly one of the great sisters to walk the earth.
I am grateful to my inner circle of friends and family (looking at you, Dad!) for their unstinting encouragement and belief in my ability to “get it done” even when I was not so sure.
My deepest gratitude goes to Paul Greenberg, who has had to face the brunt of it all, and never wavered, and always understood. Last and littlest, but not least, a special thanks to my son Luke Greenberg, who has primarily seen this dissertation as an inconvenience and distraction, and in that has forced me to always keep perspective.
June, 2018
CHAPTER 1. INTRODUCTION 1
Chapter 1
Introduction
1.1
Overview
The TCGA (The Cancer Genome Atlas) project has made widely available for the first time multiple modes of genomic data from the same large number of samples. This has spurred the development of integrative methods that attempt to improve the power and efficiency of both clustering and classification methods by integrating data from multiple platforms into a unified analysis. Here, we focus on integrative methods using a joint latent variable approach and apply them to TCGA datasets.
We useiCluster+, an existing clustering method for integrative data using a joint latent variable model, to identify potential subtypes within TCGA sarcoma and mesothelioma tumors, and acrossa large cohort of 33 different TCGA cancer datasets.
For classification, we propose novel integrative methods to leverage data across multi-ple genomic platforms to perform classification using a joint latent variable model. This approach provides effective dimension reduction while handling heterogeneous, diverse data types of different scale and variance structure. It also provides a natural framework to incorporate important clinical or environmental covariates, and importantly to investigate
CHAPTER 1. INTRODUCTION 2
interactions with these covariates. Effective feature selection is performed through a thresh-olding parameter that combines both effects from latent variables and observed feature variables. We term this new methodologyiClassify.
We demonstrate that this method leads to increased accuracy in prediction over methods that assume homogeneous data type. Moreover, we show a marked improvement in feature selection over commonly used methods. We then applyiClassifyto the classification problem of predicting response to platinum chemotherapy in a TCGA ovarian cancer cohort.
We organize the material as follows. In Section 1.2 we provide an overview of the mu-timodal genomic TCGA project, focusing on key questions about cancer subtyping and classification, then review current methodological approaches to integrative genomic analy-sis both in terms of clustering (Section 1.3.2) and classification (Section 1.2.2). In Chapter 2 we present the iCluster method and our results from integrative clustering in three pub-lished TCGA studies on sarcoma, mesothelioma, and a pancancer cohort of 33 cancer types. In Chapter 3, we introduce the methodological framework of iClassify , present and simu-lation studies demonstrating its capabilities in Chapter 4. In Chapter 5 we applyiClassify
to the TCGA ovarian cancer dataset and present results of genomic-only classification and genomic-covariate interaction analysis. We conclude the paper with discussion and future extensions in Chapter 6.
1.2
Introduction to Motivating Studies
The Cancer Genome Atlas is providing researchers with unprecedented richness of genomic data, with each tumor being sequened for mutation data, genotyped for copy number data, and assayed for mRNA, noncoding RNA, and DNA methylation profiling. Integrated analy-ses of these data could yield important contributions to knowledge about cancer mechanisms
CHAPTER 1. INTRODUCTION 3
as well as improve prediction of drug response and overall prognosis. Integrative genomics starts conceptually from the idea that biological mechanisms are comprised of multiple molecular layers, and that understanding each of these layers will inform a more compre-hensive understanding of mechanisms that lead to cancer. In fact, one of the key questions posed by the National Cancer Institute in relation to TCGA data is: “How can investigators effectively integrate data from multiple modes of genomic analysis into a unified view of oncogenic pathways?” ([National Cancer Institute, 2018]).
In particular, we are interested in two objectives using integrative genomic analysis. The first is finding individuals or samples that have similar mechanisms of disease within a particular cancer type, as these “subtypes” of cancer may have differential prognoses or responses to treatment. Moreover, we are interested in whether tumors may have similar mechanisms of disease across cancer types, so that an effective treatment for a subtype in one cancer may actually have relevance for a similar subtype in a different cancer. Additionally, we wish to leverage the integrative genomic information available to be able to perform better classification of tumors for new patients either by outcome or response to treatment.
1.2.1 Molecular subtyping in cancer
Cancer, even within a particular type, is an exceedingly heterogenous disease, with a myriad of driver mutations, chromosomal alterations and key pathway disruptions. Thus, subtyping cancer is widely understood to be essential to an improved and more personalized progno-sis/treatment.
NCI defines a cancer subtype as a “smaller group that a type of cancer can be divided into, based on certain characteristics of the cancer cells.” [National Cancer Institute, 2018]. A molecular subtype is specifically a group of samples that have a similar molecular
mecha-CHAPTER 1. INTRODUCTION 4
nism as the origin of the carcinogenesis [Le Vanet al., 2016]. These molecular mechanisms can be subtype-specific mutations or copy number alterations or expression features which may point to “disease-perturbed networks” [Hood and Friend, 2011] that may provide im-portant new drug targets.
Prior to the genomic era, subtyping had mainly been accomplished by classic immuno-histologic technique. For example, breast cancer was stratified into three subtypes using traditional immunohistochemistry techniques: hormone-receptor-positive, triple negative, and HER2-positive, each of which has it own treatment approach. With the availability of genome-wide expression profiles, researchers used hierarchical clustering to describe addi-tional breast cancer subtypes, including luminal A, luminal B, lumnal C, HER2-enriched, basal-like, claudin-low, and normal breast-like [Gluecket al., 2013]. There are now genomic assays meant to categorize breast cancer tumors into one of these subtypes, and in so doing provide better recurrence risk and prognosis estimates.
Other examples of successful, replicated subtyping performed by clustering of gene ex-pression profiles are in Diffuse large B-cell lymphoma (DLBCL) with “oxidative phosphory-lation,” “B- cell receptor/proliferation,” and “host response” subtypes [Montiet al., 2005]; and glioblastoma with proneural, neural, classical and mesenchymal subtypes [Verhaak et al., 2010].
As the multiple genomic data platforms of TCGA have become available, one of the major challenges in cancer research has been to use these integrative data to provide fuller insight into identifying clinically meaningful cancer subtypes, in the continued hopes of finding new stratified, effective treatments. Many of the clustering approaches commonly used are only capable of dealing with single data types at a time and results are often integrated manually. However, post hoc integration of results from individual genomic data
CHAPTER 1. INTRODUCTION 5
sets will likely not be able to capture multiple relationships that exist between different levels of the data, and thus may fail to realize the potential inherent in the multi-modal data.
It is in this context that we became involved in the TCGA studies of sarcoma and mesothelioma tumors. While sarcoma has many histologically diverse malignancies, the question of subtypes within these diverse sarcoma types had never been systematically looked at. And in mesothelioma, we were interested in whether there were molecular sub-types that would be histology-independent.
Additionally, an intermediate analysis of 12 TCGA cancer types and 3,527 tumors from 2014 had presented some results that suggested that molecular subtypes might provide an alternative to current organ- and tissue-histology-based classification, and had estimated that “at least one in ten cancer patients might be classified (and perhaps treated) dif-ferently using such a molecular taxonomy, rather than the current histopathology-based classification” [Hoadleyet al., 2014]. The question of interest in this larger pan-cancer clus-ter analysis of all 33 tumor types in TCGA was whether we would find further “convergent integrated molecular subypes.”
Addressing these questions
1.2.2 Classification in cancer: response to platinum chemotherapy
In a natural followup to molecular subtyping based on integrative data, The Center for Cancer Genomics (CCG), which is the successor to TCGA, is interested in finding classifiers through integrative genomic classification that can facilitate prediction of newly-discovered clinically meaningful subtypes.
CHAPTER 1. INTRODUCTION 6
challenge of integrative genomic classification: How can we use the multi-modes of genomic data available in TCGA to find models that effectively predict outcomes or response?
In this area, we were motivated by one problem in particular: current investigations into platinum resistance in high grade serous ovarian cancer (HGSOC), the most agressive subtype of ovarian cancer which makes up most of the advanced stage cases of epithelial ovarian cancer. HGSOC has the highest mortality rate among all gynecological cancers and its 5-year survival rate of 35-40% has shown little improvement for decades [Kamieniak et al., 2015].
This is likely due to the fact that resistance to standard-of-care platinum chemotherapy eventually emerges in 70% of patients, who will go on to develop recurrent cancer. Platinum resistance is formally defined as a tumor progression within six months after completion of first-line platinum therapy. Despite the high percentage of platinum-resistant patients, the treatment remains the standard of care [Matsuo et al., 2010]. Being able to predict those patients who are at high risk for platinum resistance could have important consequences for treatment, including an increased monitoring protocol as well as a complete change in treatment approach [Gonzalez Bosquetet al., 2016].
1.2.2.1 Molecular mechanisms
Platinum resistance is known to be multifactorial, relying on the “activation of multiple, non-redundant molecular or cell circuitries”. In a couple of papers, [Galluzzi et al., 2012] and [Galluzziet al., 2012] classify these molecular mechanisms into four types: (1) pre-target resistance, which interferes with the binding of cisplatin to DNA; (2) on-target resistance, which disrupts DNA-cisplatin binding; (3) post-target resistance, which perturbs Cisplatin-initiated signaling pathways mean to lead to cancer cell death; and (4) off-target resistance,
CHAPTER 1. INTRODUCTION 7
Figure 1.1: Molecular mechanisms of cisplatin resistance [Galluzziet al., 2014].
with no obvious links to mechanisms of cisplatin-mediated damage. The authors synthesize genomic and functional studies done in the last decade that have contributed to this knowl-edge and summarize findings that detail specific genes and pathways in each mechanism type in Figures 1.1 and 1.2.
Our substantial increase in understanding, however, has so far not led to an ability to be able to identify ovarian tumors that are likely to be platinum-resistant, although there is a growing body of work attempting to do just that. In a recent systematic review of prediction of resistance to chemotherapy in ovarian cancer, [Lloydet al., 2015] concluded that “A clin-ically applicable gene signature capable of predicting patient response to chemotherapy has not yet been identified”. Of the 1298 genes that were identified by 32 prognostic/predictive models reviewed, 1214 (94%) were found by only one study. And the gene most frequently selected was only selected by 4 of the models. The vast majority of these studies have
CHAPTER 1. INTRODUCTION 8
Figure 1.2: Strategies for reverting cisplatin resistance [Galluzziet al., 2012].
looked at one genomic platform at a time, in most cases gene expression.
Because these efforts have not produced persuasive and replicable models, and because of the multifactorial nature of platinum resistance, there has been increasing interest in using additional and multiple genomic modalities. To this point, the Ovarian Cancer Action (OCA) 2015 meeting designated “Understanding drug response” as one of seven key areas for future research, and the emphasis was on moving to an “integrated view” that brings together all genomics data on individual samples [Bowtellet al., 2015].
1.2.2.2 Important covariates
Additionally, there are some well known covariates that are associated with platinum resis-tance and HGSOC prognosis. For insresis-tance, residual disease is known to be one of the most influential factors in HGSOC prognosis. In the TCGA dataset of HGSOC tumors surgically resected before treatment with platinum chemotherapy, [Tuckeret al., 2014] reported that survival was significantly better for patients with no residual disease compared to those who had any residual disease at all (including <10 mm, which previously had been considered
CHAPTER 1. INTRODUCTION 9
to be optimal).
Recently, there has been increasing interest in and accumulating evidence for the idea that the tumor microenvironment has a large role to play in platinum resistance, particularly characteristics of the extracellular matrix that may preferentially support cancer stem cells or residual disease cells [Chienet al., 2013].
There is also evidence that certain genetic mutations play a role in platinum resistance. For instance, TP53 mutations have been reported in the literature to be associated with platinum resistance in some studies but not in others ([Agarwal and Kaye, 2003]).
The evidence for BRCA mutations is much more consistent. Mutations in BRCA1 and BRCA2 (breast cancer susceptibility gene types 1 and 2) are known to significantly increase the chances of a person developing ovarian cancer. (BRCA1 confers a 39-40% and BRCA2 an 11-18% lifetime risk.) Because of BRCA’s role in the DNA repair pathway, however, tumors with BRCA mutations have proven to be more sensitive to platinum drugs than tumors with wildtype BRCA. This leads to consistently better prognosis for patients with BRCA1/2-mutated ovarian cancer compared with non-carriers, if they receive platinum-based therapy ([Mylavarapu et al., 2018], [Swisheret al., 2008]).
Interestingly, this sensitivity can be modulated by other genomic events/factors. For example, [Norquist et al., 2011] reported that 46.2% of platinum resistant tumors have secondary mutations that restored the function of BRCA1/2 as compared with 5.3% that are sensitive to platinum. Thus, researchers believe that secondary mutations in BRCA1/2 may be overriding the BRCA1/2 tumors’ sensitivity to platinum, and perhaps there are other genomic factors as well that could be modulating the BRCA1/2 tumors’ response to platinum therapy.
CHAPTER 1. INTRODUCTION 10
genotype, a model that could make a genomic features x BRCA1/2 genotype possible would certainly be of interest.
We propose our joint latent variable method iClassify to address the problem of pre-dicting platinum response in high-grade serous ovarian cancer, and will use it to perform fully integrative genomic analyses that incorporate mRNA and miRNA expression, and methylation data, as well as interactions with clinically relevant mutations and residual disease.
1.3
Introduction to Statistical Methods
The TCGA (The Cancer Genome Atlas) project has made widely available for the first time multiple modes of genomic data from the same large number of samples. This has motivated the development of methods that attempt to improve the power of estimation and prediction of genomic effects on cancer outcomes by integrating data from these multiple platforms into a unified analysis. Methods development for this kind of approach fall roughly within a couple of categories that try to address two basic challenges: 1) how to reduce dimensionality of datasets where the number of variables is much greater than the number of samples (p n, ”the curse of high dimensionality”) and 2) how to sensibly integrate such diverse data types.
1.3.1 Introduction to Integrative Clustering Methods
Clustering high-throughput multimodal genomic data is a challenge that has recently arisen as The Cancer Genome Atlas has accrued its rich, multiplatform cancer cohorts.
Early efforts to subtype TCGA cancer sets fell under the category of “clustering of clus-tering,” where results of single platform clustering were then provided as input to a
second-CHAPTER 1. INTRODUCTION 11
level cluster analysis. The cluster-of-cluster assignments (COCA) method ([Hoadleyet al., 2014]) takes binary vectors of cluster assignments from each single platform as input and then performs Consensus clustering on those vectors. This allows for data to be combined without the challenge of non-trivial normalization. It also gives each single platform an influence on the final result proportional to how many clusters that platform produced. In this way, the number of features in a single platform does not carry undue weight. Another early method was SuperCluster ([Hoadley et al., 2014]), an algorithm that took a similar approach to derive overall subtypes based on cluster memberships of single platform data types, but treats cluster assignments as nominal rather than binary, and assumes an equal contribution for each data type.
These methods can work well if most or all single platform clustering yields concordant results, but is less powerful otherwise. Also, assuming equal or near-equal contribution from all data types may not reflect true mechanisms of disease. More to the point, both of these methods perform integration of cluster membership values rather than at the data level, thereby losing valuable and essential information.
Pathway clustering is another common approach to integrative data subtyping. PARADIGM ([Vaske et al., 2010]) is a pathway approach that has been used to cluster TCGA samples in a number of studies using copy number and mRNA expression data along with pathway interaction data found in public databases. The method infers integrated pathway levels (IPLs) for each gene that reflects a genes activity in a tumor sample relative to the median activity across all tumors, then runs consensus clustering on the most varying features. Other related approaches focus on integrating data into specific biological pathways, e.g. gene expression regulation ([Teoet al., 2015], [Chenget al., 2015]) or drug pathways ([Liet al., 2015a]).
CHAPTER 1. INTRODUCTION 12
These approaches can be very effective at answering the specific research questions they are designed for, but are inherently limited in a global sense by the focus on specific data types and networks. Also, as these methods depend, in large part, on prior biological knowl-edge, so can miss out on discovery of new mechanisms or previously unknown relationships. Methods development for integrative clustering, spurred on by TCGA, has been a very active area for the last decade. There have been a number of“horizontal analyses” ([Tseng
et al., 2015]) approaches which focus on variable to variable relationships within and across data types . Examples of this are correlation network analysis ([Adourian et al., 2008], [Li et al., 2015b]), correlation motifs ([Ji et al., 2015]) and multiple canonical correlation analysis ([Witten et al., 2009]). Again, these methods are developed for specific questions and inherently do not focus on global modes of variation.
Another active area for clustering methods development has been in vertical integra-tive analyses, which focus on generalized dimensionality reduction ([Tseng et al., 2015]). Common and early dimension reduction approaches such as singular value decomposition (SVD; [Alteret al., 2000]; [Holteret al., 2000] and non-negative matrix factorization (NMF; Brunet2004) work well for a single data type but do not accommodate multiple heteroge-nous data types. More recent developments specifically for multimodal data sets include Bayesian methods with penalization [Liuet al., 2015], decomposition of variation ([Locket al., 2013]), and joint factor analysis ([Li and Jung, 2017], [Shenet al., 2009]).
iCluster+ is specifically a joint latent variable model-based approach to integrative clus-tering with several advantages. In this formulation, the common set of latent variables are proposed to represent distinct driving factors of disease. Multiple genomic data types with different scale and variance structure can be incorporated into a single model. Biological relationships among platforms do not need to be specified. This acknowledges the
incom-CHAPTER 1. INTRODUCTION 13
plete nature of our understanding of genomic relationships, at the same time allowing for the discovery of novel pathways or drivers. A penalized likelihood method still allows for feature selection.
1.3.2 Introduction to Integrative Classification Methods
Methods for integrative classification are not as well developed as those for integrative clustering, and there is a real need for new approaches in this area.
The idea that looking at more than one type of genomic data for classification at once is more powerful is borne out by studies that have looked into the question. For example, [Fuchs et al., 2013] found that in most cases, classifiers based on a combination of mRNA and miRNA data yield equivalent or greater accuracy than classifiers based on just one type of data. [Daemenet al., 2009] similarly found that prediction of all outcomes improved when more than one type of genome-wide data set is used.
Sequential/filtering techniques consider different platforms one after the other, reducing the dimensionality of the feature space to those that have known relationships among at least two data types. For example, [Mankoo et al., 2011] filtered out features that did not meet certain correlation criteria based on mRNA regulation in serous ovarian tumors, then used the greatly reduced set of features to predict survival.
This is the same logic used in studies of other complex diseases that seek to incorporate transcriptomic information into analyses to increase the power to uncover mechanisms of disease, spurred on by the demonstration by [Nicolae et al., 2010] that single nucleotide polymorphisms (SNPs) discovered through GWAS are more likely than frequency-matched SNPs to be expression quantitative trait loci (eQTLs). In simple cases, eQTL studies have provided lists of single nucleotide variants that contribute to gene expression variation
CHAPTER 1. INTRODUCTION 14
Figure 1.3: The ’triangle” method for integration of genotype, expression, and phenotype data [Gamazon et al., 2013].
(eSNPs) that can then be compared to significant disease-specific GWAS-associated SNPs [Cooksonet al., 2009]. This approach has proved successful in several studies, and is now routinely used to select candidate genes for exploring disease mechanisms [Montgomery and Dermitzakis, 2011]. For example, [Dubois et al., 2010] highlighted 20 of the 38 associated celiac disease risk loci that are also correlated with expression variation in a nearby gene, and Anttila et al [Anttila et al., 2010] used correlation of migraine-associated genotypes from GWAS with gene expression data to point to a potential regulatory mechanism.
More formally, genotype and gene expression data on the same samples can be integrated with phenotype in a ”triangle” approach [Gamazon et al., 2013], illustrated in Figure 1.3:
1. Identify a set of genes whose differential expression is associated with the phenotype with an arbitrarily chosen p-value,p < pexpression−phenotype.
2. Identify SNPs (eQTLs) that are associated with the selected gene in the previous step at an arbitrarily chosen p-value,p < pexpression−SN P.
CHAPTER 1. INTRODUCTION 15
arbitrarily chosen p-value,p < pSN P−phenotype.
Gamazon et al show that estimating the significance of these SNP-phenotype associations with a simple FDR leads to false positive results because the null distribution of p-values in this case is not uniform, and propose simulating a null distribution of p-values by:
1. Permuting phenotype labels Yi, for each simulation i, while retaining the correlation structure of gene expression
2. For each permuted phenotype list, deriving a set of differentially expressed genes, gi, that exceedsp < pexpression−phenotype
3. For each genegij, retrieving set of eQTLs,Sijk from the SCAN database that exceeds
p < pexpression−SN P
4. Derive subset of Sijk that exceed p < pSN P−phenotype. These p-values are thus the null distribution.
Using the above null distribution of p-values, they follow the approach of [Storey and Tibshirani, 2003] to estimate an accurate FDR.
This method can incorporate other types of ”omics” datasets (such as methylation, microRNA, and protein abundance, among others), and is theoretically not limited to using only two types of data at a time. The primary advantage of this approach is that each step of filtering accomplishes dimensionality reduction, which reduces the number of tests, potentially improving power. The performance of the method, however, is very dependent on the filtering thresholds chosen, although the overall p-value should remain relatively consistent regardless of thresholds. Practically speaking, including more than two data types becomes methodologically complicated and computing an overall p-value could quickly
CHAPTER 1. INTRODUCTION 16
become computationally unfeasible. Moreover, software is available for the case of only two data types.
The main drawback with these sequential or filtering methods is that they are based on an assumption of strong linear correlation between the same features in different data types, an assumption that could be violated either by weak correlation across two or more data types, or by nonlinear associations.
Other integration techniques focus on ways to analyze the different types of data simul-taneously or within the same framework.
1.3.2.1 Concatenation/matrix factorization
The simplest form of this approach is to concatenate the separate matrices for each data type into one large matrix. Methods for dimensionality reduction could then include penalized likelihood, some kind of matrix decomposition e.g. principal components analysis (PCA) or singular value decomposition (SVD), or a combination of both.
[Barretina et al., 2012] combined multiple types of genomic data from the Cancer Cell Line Encyclopedia (gene expression, gene copy number, gene mutation values, and others) together into one large matrix of genomic features: X ∈ N,p, where N is the number of cell lines, and pis the number of predictive features. They then predicted continuous drug response with an elastic net regression algorithm [Zou and Hastie, 2005; Friedman et al., 2010] which combines L1 and L2 regularized regression penalty terms in order to, on the one hand, find a parsimonious model selecting the most influential features (withL1), and on the other, to account for and include corelated features (withL2).
Combining different modes of data (e.g. continuous and binary), however, raises issues of scale and normalization that are not trivial, while including all genomic types in one
CHAPTER 1. INTRODUCTION 17
matrix puts equal weight on all data types which may not reflect the true disease mecha-nisms. Further, this kind of approach does not have a framework to sensibly incorporate environmental variables.
Decomposition of a concatenated matrix brings up similar issues. Performing decom-position requires an assumption that all data types share a common variance, which is not borne out in practice with different modes of genomic data. [Shen et al., 2013] show that SVD on a concatenated matrix does not achieve effective integration both with simulated and real data.
Kernel methods map data into a feature space by a kernel function, which defines gen-eralized similarity relationships between pairs of features by computing the inner product. Classification is then done on the kernel most often using a Support Vector Machine (SVM). While methods were originally developed for homogeneous data, extensions for analyz-ing different data types simultaneously have been explored. [Pavlidiset al., 2002] integrated two types of data for gene function classification using three approaches: concatenation of the data into one matrix (early integration), summing of the separately computed kernel matrices (intermediate integration), and summing of the discriminant values resulting from separate SVMs for each data type (late integration). The intermediate integration provided the best-performing classification. However, the authors also found that SVM with inte-grated data performs worse than SVM on a single data type in cases where one data type provides significantly more information than the other.
A disadvantage of this method is that kernel representations of effects of genomic markers are not directly interpretable, though methods for feature selection do exist. In terms of our purpose, if sparse environmental variables were incorporated into this framework, they could be easily overwhelmed by the high dimensional genomic data. And, in general,
CHAPTER 1. INTRODUCTION 18
computational burden becomes an issues as more data types are included.
[Li, 2013] proposes a two-stage formal integrated model for clinical outcome incorporat-ing transcript expression and genotype data based on the idea that genetic variation affects gene regulation which affects disease probability.
Let Yi = 0,1 be disease status for the ith subject, let Zik = 0,1,2 be the number of minor alleles at thekth SNP for k= 1, ..., K, letXij be the expression of thejth transcript forj= 1, ..., p, and let Wil = 1, ..., q be environmental covariates.
Disease risk is modeled as a function of gene expression and covariates, with gene ex-pression modeled as a function of genetic variation and the same covariates:
outcome model: logit P(Yi = 1|Xi, Zik, Wi) =αint0 +Xiτα0+Wiτξ0 transcript model: Xiτα0 =βint0 +Zikβ0+Wiτν0+i, i∼N(0, σ2)
An approach similar to this that integrates multiple genomic data types has been devel-oped by [Jennings et al., 2013], known as iBAG (integrative Bayesian analysis of genomics data). In iBag, the outcome model is known as the clinical model, and the transcript model is known as the mechanistic model. In the mechanistic model, the gene’s expression gets partitioned into factors explained by methylation, copy number variation and other causes using principal-component-based regression. These principal components are then included in the clinical model, which they propose can find the gene expression related to the clinical outcome as well as the components that affect gene expression. (Sparsity is induced with Bayesian shrinkage.)
The main drawback here is that the appropriateness of the mechanistic model is de-pendent on understanding the biological relationships between data types. If the biologi-cal relationships are not well understood, or end up being more complex than the model
CHAPTER 1. INTRODUCTION 19
would indicate, the information that exists in the data will not be extracted. For example, [VanderKraatset al., 2013] make the point that only modest correlations have been found between differential methylation at gene promoters and gene expression and hypothesize that this is because existing analysis methods oversimplify the representation of the data. Additionally, the method is not well-suited to incorporate binary or categorical genetic data that is also important to disease etiology. There also does not appear to be publicly available software to explore this approach.
A joint latent variable approach to classification, such as the one underlyingiCluster+, thus offers advantages that the preceding methods do not. Namely, while accomplishing effective dimensionality reduction through latent variables, it: 1) accommodates different data types at the model level, 2) provides feature selection that takes feature effects and data type effects into account, and 3) is not reliant on prior biological knowledge or assump-tions. We propose to build a classification method, iClassify, using this approach that will further accommodate clinical and environmental covariates and allow for genomic-covariate interaction terms.
1.4
Summary of Introduction
In this dissertation, we apply a joint latent variable approach to multimodal genomic data to gain insight into cancer studies.
For subtyping integrative data, we use the already existing method, iCluster+, an in-tegrative clustering method using a joint latent variable approach, to three TCGA data sets. iCluster+ is a generalized vertical integrative clustering method that formulates la-tent variables as distinct drivers of disease and accommodates heterogeneity of genomic data type. It offers penalized feature selection that allows identification of features that
CHAPTER 1. INTRODUCTION 20
directly contribute to clustering solutions.
Building on iCluster+’s model formulation, iClassify integrates different genomic plat-forms at the data level and uses a joint latent variable model for the purposes of prediction and classification. It additionally allows for covariate terms and genomic-covariate interac-tion.
The development of this method can provide a refined prediction tool for patient out-comes with systematic applications to large-scale sequencing studies, such as the TCGA ovarian cancer data set we investigate here. Moreover, this methodology has broad appli-cations beyond predicting treatment outcomes and disease progression in cancer, including predicting prognosis and diagnosis in other diseases with major public health implications. For example, prediction of conversion to Alzheimer’s disease in subjects with mild cognitive impairment and future diagnosis of post-traumatic stress disorder in patients exposed to violence are two areas of potential future investigation.
CHAPTER 2. ICLUSTER: METHODS AND APPLICATIONS 21
Chapter 2
iCluster: Methods and
Applications
2.1
Methods
As we have noted, iCluster+ takes a joint latent variable model approach to multimodal genomic data, jointly modeling all genomic features with a common set of unobserved la-tent variables that we propose represents distinct driving factors of cancer, e.g. molecular etiology and genetic pathways. These latent variables can be thought to collectively capture the major biological variations observed across cancer genomes. [Mo et al., 2013]. To iden-tify genomic features that contribute most to the biological variation and thus to proposed clustering solutions, anL1 penalized likelihood approach is used to induce sparsity.
We will provide a more detailed formulation of iCluster+ and then apply this method to three different TCGA studies.
Following [Mo et al., 2013],let xijt, i = 1,· · · , n, j = 1,· · · , pt, t = 1,· · · , m denote the genomic variables associated with thejth genomic feature in theith subject of thetth data type. A genomic feature can be a variable such as mutation status, gene expression level or
CHAPTER 2. ICLUSTER: METHODS AND APPLICATIONS 22
methylation level, depending on the data type. Letzi = (zi1,· · ·, zik)0 be a column vector consisting ofk unobserved latent variables.
We assume zi are continuous variables that represent continuous spectrums of driver activation and follow a standard multivariate normal distribution N(0,Ik). The genomic variables xijt(j = 1,· · · , pt, t = 1,· · ·, m) are connected to the latent process via a para-metric joint model in which different genomic variables are correlated throughzi. Consider To model, if xijt is a continuous variable (e.g. mRNA value), we assume it follows a normal distribution and consider the standard linear regression:
Xijt=αjt+βjtzi+ijt, ijt∼N(0, σjt2), (2.1) where the error terms are uncorrelated andσ2
jt is the residual variance not accounted for by the common associations represented byzis. αjt is an intercept term; andβjt is a length-k row vector of coefficients that determine the weights genomic variable j contributes to the latent variables.
Or if xijt is a binary variable (e.g., mutation status), we consider standard logistic regression:
logit{Pr(Xijt= 1|zi)}=αjt+βjtzi,
where Pr(Xijt= 1|zi) is the probability of genejmutated in tumorigiven the value of the latent factor zi.
The model also accommodates other genomic data types, such as multicategory (e.g. copy number loss, normal, gain) and poisson (e.g. sequencing count data) variables.
CHAPTER 2. ICLUSTER: METHODS AND APPLICATIONS 23 as this summation: `(xijt,zi;αjt,βjt) = n X i=1 m X t=1 pt X j=1
logf(xijt|zi, αjt,βjt) + logf(zi) ,
To obtain a sparse model that allows identification of the genomic variables that con-tribute to the model, the following penalized likelihood estimation is performed with the lasso (L1) penalty: max αjk,βjt `(Xijt, Zi;αjt,βjt)− X jt λtkβjtk1
where kβjtk1 = kβj1tk+· · ·+βjkt is the L1-norm (lasso) penalty and λts are sparsity-inducing tuning parameters with different values for each data type. Heterogeneity of the different data types is thus accommodated through the different sparsity tuning parameters. If the entire vectorβjt is zero, then the genomic variable j in data type tis removed from the model. The values of λt are determined by using the Bayesian information criteria (BIC).
For estimation, a modified Monte Carlo Newton-Raphson algorithm is used. Asziis not observed, its joint posterior distribution using a random walk Metropolis-Hasting algorithm:
z(r+1)i |Xijt∝f(Zi(r)) Y j,t f(xijt|αjt,βjt,z (r) i )
Parameter updates are then calculated by their sample averages over repeated draws. Once latent variables zi are estimated, K-means clustering divide the n samples into
k+ 1 clusters using the k latent variables. Ifk is unknown, it is selected from a range of
k’s using the BIC.
2.2
Data considerations
Mulitple genomic platforms are used in iCluster+ analyses. In our TCGA analyses so far, we have used full sets and subsets of SCNA copy number data, DNA methylation,
CHAPTER 2. ICLUSTER: METHODS AND APPLICATIONS 24
and mRNA, miRNA, and ncRNA expression as input. Data are pre-processed using the following procedures: For mRNA, ncRNA and mature-strand miRNA sequence data, poorly expressed genes are excluded based on median-normalized counts, and variance filtering leads to a list of reduced features for clustering. Expression features are log2 transformed, normalized, and scaled before using them as input to iCluster+.
For methylation data, the median absolute deviation was employed to select the top 4000 most variable CpG sites after beta-mixture quantile normalization [Pidsleyet al., 2013]. We removed methylation probes with >20% or more missing data and those corresponding to SNP and autosomal chromosomes. We normalized, and scaled before using them as input toiCluster+.
For copy number data, Circular Binary Segmented (CBS) segmented data based on Affymetrix SNP Array 6.0 was used. We further reduced these data to a matrix of sam-ples by non-redundant regions by adapting a method described in [Van De Wiel and Van Wieringen, 2007]. Our algorithm forms genomic regions along a chromosome defined by consecutive positions with a maximum Euclidean distance (based on copy number log-ratio segmented values) between any adjacent two probes smaller than a parameter , which determines the number of non-redundant region. Each region is then represented by its medoid signature.
2.3
Analysis of TCGA Sarcoma cohort
Adult soft tissue sarcomas are malignancies of the connective tissue, including fat, muscles, cartilage, nerves, blood vessels, and deep skin tissues. While they comprise ≈1% of adult solid tumors, they account for a disproportionate share of young adult (ages 20-39) can-cer mortality due to the highly aggressive nature of many sarcomas. They are generally
CHAPTER 2. ICLUSTER: METHODS AND APPLICATIONS 25
classified by the soft (mesenchymal) tissue they resemble most.
The number of sample and sarcoma types in the TCGA cohort are detailed in Table 2.1. Platforms and number of features selected after pre-processing are in Table 2.2. The stated goal of the TCGA study was to “understand the genomic diversity of oncogenic drivers, to refine clinical risk stratification, and to identify potential therapeutic targets.” We present here relevant results related to ouriCluster+ analyses of sarcoma tumors.
Table 2.1: TCGA sarcoma analysis: types and sample sizes
Cancer type Abbreviation Characteristics No. Samples Dedifferentiated liposarcoma DDLPS Undifferentiated 50 Leiomyosarcoma LMS Smooth muscle differentiation 80
53 soft tissue (STLMS) and 27 uterine (ULMS)
Undifferentiated pleomorphic sarcoma UPS Undifferentiated 44 Myxofibrosarcoma MFS Fibroblastic differentiation 17 Malignant peripheral nerve sheath tumor MPNST Peripheral nerves 5 Synovial sarcoma SS Simple-karyotype 10
Table 2.2: TCGA sarcoma analysis: features and platforms
Genomic platform No. of features DNA copy number 1097 DNA methylation 1000 mRNA expression 1107 miRNA expression 171
Cross-sarcoma clustering We first performed clustering across all 206 samples and tried a range of cluster solutions from k=1 to 7. The plot of BIC by number of clusters showed a clear minimum at k=4, the 5 cluster solution (See Figure 2.1).
iCluster+ results were largely influenced by histology. SS was the most distinct sarcoma across all platforms, assigning all SS tumors into cluster C4, whose discriminatory features included high expression of FGFR3 (p = 7e-20) and miR-183 (p = 2e-25), methylation
CHAPTER 2. ICLUSTER: METHODS AND APPLICATIONS 26
Figure 2.1: iCluster+ Sarcoma analysis: BIC by cluster number
of the PDE4A promoter (p = 1e-06) and partial or complete loss of chromosome 3p in 5 cases (45%). Full tables of differential features can be found in Supplementary materials of the full Sarcoma paper [Cancer Genome Atlas Network, 2017]. Unique patterns of DNA methylation, miRNA expression, and gene expression recapitulate single platform clustering for SS, and are consistent with an SS18-SSX fusion protein that is proposed to disrupt epigenetic regulation [Svejstrup, 2013].
iCluster C1 was dominated by LMS, 64 of 65 cases (98%), and was distinguished from other sarcomas largely by genes linked to myogenic differentiation, including high expression of MYLK, MYH11, ACTG2, miR-143, and miR-145 (all p ¡ 5e-39), low mRNA expression
CHAPTER 2. ICLUSTER: METHODS AND APPLICATIONS 27
CHAPTER 2. ICLUSTER: METHODS AND APPLICATIONS 28
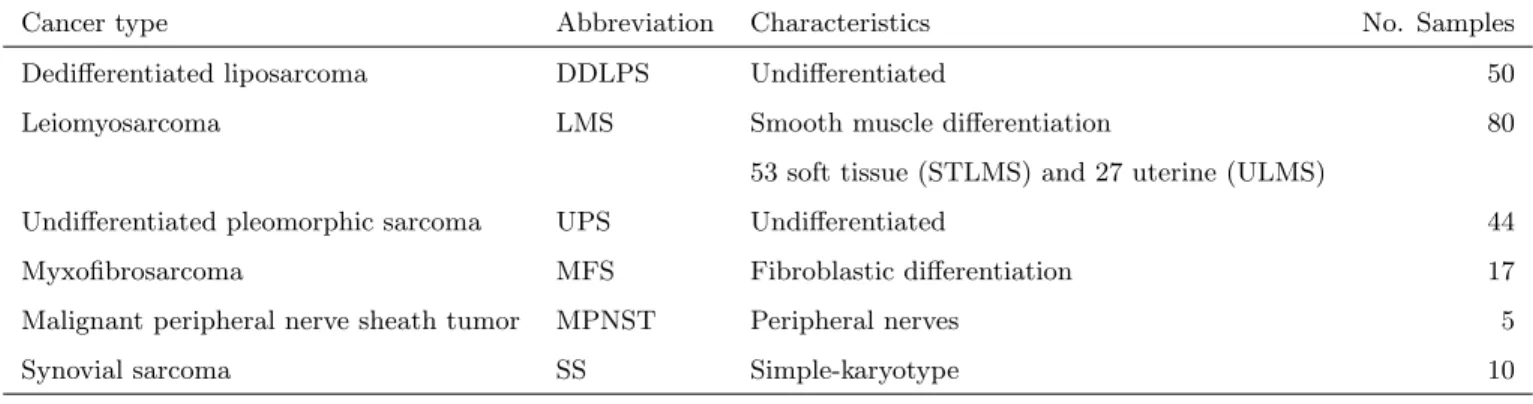
Figure 2.4: Disease Specific Survival by STLMS iCluster
of inflammatory response genes, and low leukocyte fraction by methylation analysis. An association with grade was also noted, with iCluster C1 and C2 containing 11 of the 14 low-grade sarcomas (FNCLCC grade 1) compared to 3 in C3 and none in C4-5 (p = 0.011). However, this effect may be driven by iCluster separation by histologic type, as 12 of the 14 low-grade sarcomas were LMS, which was enriched in C1.
DDLPS was mainly broken up into iCluster C2 (44%) and C3 (54%), while UPS was mostly divided between C3 (36%) and C5 (59%). The five MPNST tumors were spread out over 3 iClusters.
Within-LMS clustering
We then performed clustering specifically on LMS, which has been reported to have 3 mRNA expression subtypes, i.e., a mostly uterine type and two mostly soft tissue types with very different prognoses [Guo et al., 2015]. The all-LMS clustering had a minimum BIC at the 2-cluster solution, and resulted in one cluster highly associated with ULMS and the other with STLMS. To see whether we could replicate the two soft tissue types with
CHAPTER 2. ICLUSTER: METHODS AND APPLICATIONS 29
Figure 2.5: iCluster+ Sarcoma analysis
different prognoses, we performed an STLMS-only clustering. Again the minimum BIC was at the2-cluster solution.
Indeed, our two clusters were consistent with reports from [Guo et al., 2015] and we were able to contribute additional knowledge about inter-STLMS subtypes. STLMS C1 had worse recurrence-free survival (RFS; p = 0.0002) and DSS (p = 0.008; Figure 2.4). Compared with C2, C1 was hypermethylated (Figure 2.3) and showed higher expression of IGF1R and factors involved in cell-cycle control (CCNE2), DNA replication (MCM2), and DNA repair (FANCI) (all with adjusted p≤0.03). C1 also showed more frequent mutations of RB1 (p = 0.04) and amplification of 17p11.2-p12 (q = 0.022), a known alteration in LMS that notably includes MYOCD, encoding myocardin, a transcription factor involved
CHAPTER 2. ICLUSTER: METHODS AND APPLICATIONS 30
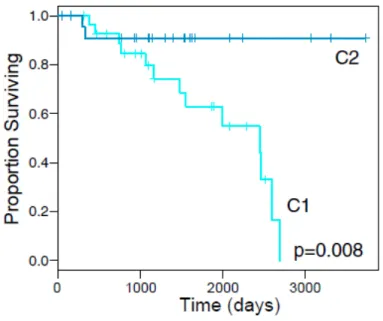
in smooth muscle differentiation. The hypomethylated STLMS C2 displayed prominent signatures of inflammatory cells, including NK cells (p = 0.004) and mast cells (p = 0.044). The STLMS C1 cluster showed similarities with ULMS, including enrichment for PTEN deletion, mutation, or downregulation and for amplification or overexpression of AKT path-way members. Taken together, 46/55 (84%) of ULMS and STLMS iCluster C1 tumors contained alterations in the AKT pathway compared to 11/25 (44%) of STLMS iCluster C2 (p = 1e-04). Given recurrent deletion/mutation of PTEN along with frequent amplifica-tion and upregulaamplifica-tion of IGF1R, AKT, RICTOR, and MTOR (Figure 2.5) and high AKT pathway scores by RPPA, aberrant PI3K-AKT-MTOR signaling may be crucial in LMS as a whole. Our collaborators suggest that while the effect of MTOR inhibitors such as everolimus and temsirolimus have been diminished by indirect upregulation of AKT, per-haps newer TORC1/TORC2 inhibitors and dual PI3K/ MTOR inhibitors may overcome this limitation and offer more effective therapy for LMS patients.
For other results and findings to emerge from the TCGA sarcoma study, see our report in Cell [Cancer Genome Atlas Network, 2017].
2.4
Analysis of TCGA Mesothelioma cohort
Table 2.3: TCGA Mesothelioma analysis: histology and sample sizes
Histology No. Samples Epithelioid 52 Biphasic 13 Sarcomatoid 3 Not otherwise specified 6
Malignant pleural mesothelioma (MPM) is a cancer of the mesothelial cells lining the pleural cavity. It was rare until the widespread use of asbestos in the mid-20th century
CHAPTER 2. ICLUSTER: METHODS AND APPLICATIONS 31
Table 2.4: TCGA Mesothelioma analysis: features and platforms
Genomic platform No. of features DNA copy number 1740 DNA methylation 4000 mRNA expression 4036 miRNA expression 304 lncRNA expression 1015
[Sekido, 2013]. Although reduction and strict regulation of asbestos use may be leading to a leveling off in new cases in Western countries, its long latency, together with continued use of asbestos in non-Western countries, ensures that MPM remains a global problem [Leong
et al., 2015]. MPM is almost universally lethal, with only modest survival improvements in the past decade [Yap et al., 2017], suggesting that standard treatment is reaching a ther-apeutic plateau. Elucidating oncogenic genomic alterations in MPM is therefore essential for therapeutic progress.
To expand our understanding of the molecular landscape and biological subtypes of MPM, and provide insights that could lead to novel therapies, TCGA has conducted a com-prehensive, multi-platform, genomic study of 74 MPM samples. Here, we provideiCluster+ analysis of these 74 samples (with histology detailed in Table 2.3) and report prognostically relevant subsets of MPM with novel potential therapeutic targets. In this analysis, we used 5 data types, detailed in Table 2.4.
While the current classification of MPM into epithelioid, sarcomatoid and biphasic his-tologies is prognostically useful, there remains variability in clinical features and patient outcomes within histological subtypes. Previous analyses ([Buenoet al., 2016], [De Reynies
et al., 2014]) based on mRNA expression alone have defined unsupervised clusters that largely recapitulate these histologic classes. To find out whether multi-platform
molecu-CHAPTER 2. ICLUSTER: METHODS AND APPLICATIONS 32
CHAPTER 2. ICLUSTER: METHODS AND APPLICATIONS 33
Figure 2.8: OS by MPM iClusters Figure 2.9: OS by MPM Epithelioid iClusters
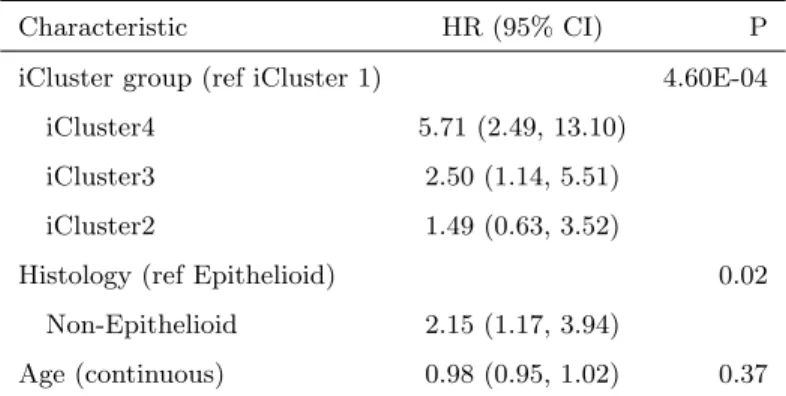
lar profiling might provide additional resolution to define prognostic subsets of MPM, we used iCluster+ to perform integrative clustering across multiple platforms. We identified four distinct integrated subtypes of MPM. Survival was significantly different across the 4 clusters (P¡0.001, Figure 2.8), and this survival difference remained significant (P=0.01) after adjusting for histology (epithelioid vs. non-epithelioid, Table 2.5) and age. iClus-ter 1 patients had the best prognosis, were likely to have undergone pneumonectomy, and were enriched for epithelioid histology. Molecularly, these tumors had low SCNA, relatively few CDKN2A homozygous deletions (11%), and a high level of methylation (Figure 2.6). All but one (95%) had BAP1 alterations: 26% had homozygous deletions and 53% had heterozygous loss with mutations.
The poor prognosis cluster (Cluster 4; red) had a high score for epithelial-mesenchymal transition (EMT) based on gene mRNA expression (P¡0.001) which was distinguished by high mRNA expression of VIM, PECAM1 and TGFB1, and low miR-200 family mRNA
CHAPTER 2. ICLUSTER: METHODS AND APPLICATIONS 34
Table 2.5: All MPM: Multivariate Cox Regression
Characteristic HR (95% CI) P iCluster group (ref iCluster 1) 4.60E-04
iCluster4 5.71 (2.49, 13.10) iCluster3 2.50 (1.14, 5.51) iCluster2 1.49 (0.63, 3.52)
Histology (ref Epithelioid) 0.02 Non-Epithelioid 2.15 (1.17, 3.94)
Age (continuous) 0.98 (0.95, 1.02) 0.37
expression. These tumors also displayed MSLN promoter methylation and consequent low mRNA expression of mesothelin, a marker of differentiated mesothelial cells, as noted pre-viously in sarcomatoid MPM and the sarcomatoid components of biphasic MPM [Dacic
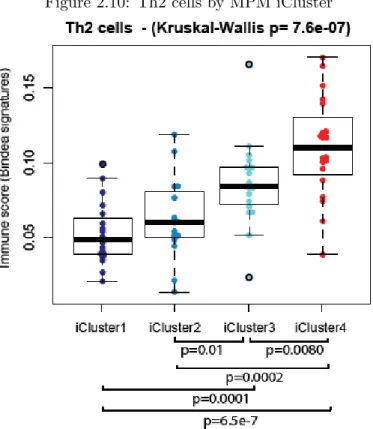
et al., 2008], [Tan et al., 2010]. Overall, this poor prognosis cluster also showed enrich-ment of LATS2 mutations (30% compared to 4% in the rest of the cohort) and CDKN2A homozygous deletion (66%). Moreover, this cluster showed higher AURKA mRNA ex-pression, higher leukocyte fraction (based on methylation), and elevated mRNA expression of E2F targets, G2M checkpoints, and DNA damage response genes. PI3K-mTOR and RAS/MAPK signaling were upregulated, based on both mRNA and protein mRNA expres-sion. Additionally, several miRNAs were differentially expressed between the good and poor prognostic clusters, including miR-193a-3p, which has been proposed as a potential tumor suppressor [Williamset al., 2015]. Finally, a comparison of immune gene mRNA expression signatures [Bindeaet al., 2013] across the four clusters revealed a significantly higher score for the Th2 cell signature in the poor prognosis cluster 4 compared to the other clusters (Figure 2.10). Coincidentally, it has been reported that Th2 cytokines secreted by immune cells upon exposure to asbestos may promote MPM [Maket al., 2016]).
CHAPTER 2. ICLUSTER: METHODS AND APPLICATIONS 35
Figure 2.10: Th2 cells by MPM iCluster
was a strong concordance in subtype assignments between the two algorithms, especially for the best (Cluster 1) and worst (Cluster 4) prognosis clusters, indicating that integration of molecular data can identify distinct subgroups of MPM, independent of the specific statistical methodology.
While biphasic and sarcomatoid MPM are more aggressive, there remains a need for improved risk stratification of epithelioid MPM, for which clinical outcomes are more het-erogeneous [Gill et al., 2012]. Therefore, we performed aniCluster+ analysis restricted to epithelioid MPM. The results for the 4-cluster epithelioid-only solution were highly similar to the 4-cluster all-MPM solution (Table 2.6), with only 7 of the 52 epithelioid samples reassigned to other clusters. This stability indicates that the features driving the all-MPM clustering are largely independent of histology. The epithelioid-only clusters share many of
CHAPTER 2. ICLUSTER: METHODS AND APPLICATIONS 36
the features defining the corresponding clusters in the all-MPM solution (2.7). The survival analysis also paralleled the all-MPM solution, with cluster 1 having the best outcomes and cluster 4 having the worst (2.9). Upregulation of AURKA mRNA expression in the poor prognosis epithelioid-only cluster 4 corroborated the results from the all-MPM analysis.
Table 2.6: Epithelioid cases: all-MPM vs Epithelioid-only iClusters
Epithelioid-only iCluster 1 2 3 4 Epithelioid 1 14 0 1 3 cases from 2 0 13 0 0 All-MPM (n=74) 3 0 0 9 3 iCluster 4 0 0 0 9
Finally, we sought to independently validate the clinical correlations of clusters identified in the TCGA epithelioid cases using mRNA expression profiles from two published studies: 211 MPM analyzed by RNA-sequencing [Buenoet al., 2016] and 52 MPM samples analyzed by mRNA expression microarrays [L´opez-R´ıos et al., 2006]. Specifically, we assigned each mRNA expression profile to one of the integrative clusters based on the rules derived from the TCGA mRNA dataset. For the larger validation cohort (henceforth referred to as Bueno), we restricted our analysis to epithelioid samples and used the epithelioid-only gene signature to cluster samples. We found that the epithelioid-only samples assigned to iCluster 1 (good prognosis) had significantly better survival , even after adjusting for age (Figure 2.11). In the smaller cohort (referred to as Lopez-Rios), patient numbers were too small to split by histology. However, this analysis provided independent validation of the survival differences for the four all-MPM clusters (Figure 2.12). Taken together, these results suggest that the prognostically relevant molecular profiles defined by our analysis
CHAPTER 2. ICLUSTER: METHODS AND APPLICATIONS 37
Figure 2.11: Bueno OS Validation Figure 2.12: Lopez-Rios OS Validation
are robust and reproducible, and could be potentially used to improve risk stratification of patients with epithelioid MPM.
This manuscript is currently under review at Cell Cancer.
2.5
Analysis of TCGA Pancancer cohort
As discussed in Section 1.3.2, the question of interest for this pan-cancer TCGA 33 cancer type clustering analysis was whether our results would expand on those of the first pan-cancer TCGA study of 12 pan-cancer types [Hoadley et al., 2014] and find more molecular subtypes that would provide an alternative to the traditional organ and tissue-histology-based classification, or whether the majority of the molecular subtypes we would find would mirror the traditional ones.
CHAPTER 2. ICLUSTER: METHODS AND APPLICATIONS 38
Table 2.7: TCGA pancancer analysis: cancer tumor types/categories
Cancer type Abbreviation No. Samples Adrenocortical carcinoma ACC 76
Bladder urothelial carcinoma BLCA 399 Breast invasive carcinoma BRCA 1031 Cervical squamous cell carcinoma CESC 291 Cholangiocarcinoma CHOL 36 Colon adenocarcinoma COAD 405 Lymphoid neoplasmdiffuse large B cell lymphoma DLBC 47 Esophageal carcinoma ESCA 171 Glioblastoma multiforme GBM 128 Head and neck squamous cell carcinoma HNSC 506 Kidney chromophobe KICH 65 Kidney renal clear cell carcinoma KIRC 488 Kidney renal papillary cell carcinoma KIRP 283 Acute myeloid leukemia LAML 160 Brain lower-grade glioma LGG 507 Liver hepatocellular carcinoma LIHC 357 Lung adenocarcinoma LUAD 490 Lung squamous cell carcinoma LUSC 460 Mesothelioma MESO 87 Ovarian serous cystadenocarcinoma OV 294 Pancreatic adenocarcinoma PAAD 176 Pheochromocytoma and paraganglioma PCPG 161 Prostate adenocarcinoma PRAD 484 Rectum adenocarcinoma READ 148
Sarcoma SARC 249
Skin cutaneous melanoma SKCM 446 Stomach adenocarcinoma STAD 407 Testicular germcell tumors TGCT 149 Thyroid carcinoma THCA 494
Thymoma THYM 119
Uterine corpus endometrial carcinoma UCEC 510 Uterine carcinosarcoma UCS 55 Uveal melanoma UVM 80
CHAPTER 2. ICLUSTER: METHODS AND APPLICATIONS 39
Table 2.8: TCGA pancancer analysis: features and platforms
Genomic platform No. of features DNA copy number 3105 DNA methylation 3139 mRNA expression 3217 miRNA expression 382
types with complete data for four genomic platforms: mRNA, DNA methylation, miRNA and copy number alterations. See Table 2.7 for a breakdown of cancer types and Table 2.8 for the platforms and number of features that were input into theiCluster+ algorithm.
We looked at a range of cluster solutions from k= 1 to 40 (number of clusters = k+1), and did not see a clear BIC minimum for any of the solutions (see Figure 2.13). There is a subtle flattening out of the curve at k=27, which pointed towards the 28-cluster solution, and further manual examination confirmed this choice. We quantified the relative contribution of each platform to the overall clustering by summing the platform-specific feature weights on the 27 iCluster latent variables. CNVs contributed 47%, mRNA and miRNA 42% and methylation 11%. Figure 2.14 shows heatmap of all features organized by iCluster, including 190 protein RPPA features that were missing in 2,808 samples (including all LAML samples) but are included in the heatmap for illustrative purposes.
Our iCluster+ solution gave a two-pronged answer to the research question. While it emphasized the dominant role of cell-of-origin patterns, with the majority of clusters being comprised of a dominant cancer type, there were also clusters that brought together samples that had molecular similarities among histologically or anatomically related cancer types, for instance pan-kidney, pan-gastrointestinal, and pan-squamous clusters. And there were a few clusters that took members from a number of unrelated cancer types as well. As stated in the text,“Our analysis showed both divergences from and convergences with the
CHAPTER 2. ICLUSTER: METHODS AND APPLICATIONS 40
Figure 2.13: iCluster+ Pancancer analysis: BIC by cluster number
routinely used clinical tumor classification system.” The following highlights some of the interesting findings from our analysis, as reported in Cell [Hoadley et al., 2018].
For 16 of the tumor types, over 80% of the samples grouped together in the same iCluster. Eight iClusters were characterized by a single tumor type (C24:LAML, C11:LGG [IDH1 mut], C6:OV, C8:UCEC, C12:THCA, C16:PRAD, C26:LIHC,C14:LUAD). Others contained tumors from similar or related cells or tissues:C28:pan-kidney (KIRC, KIRP), C15:SKCM/UVM-melanoma of the skin (SKCM) and eye (UVM), C23:GBM/LGG (IDH1wt), and C5:CNS/endocrine (PCPG). C9 (KICH, ACC) was comprised mainly of two tumor types that had high levels of hypodiploidism. Six tumor types had more diverse iCluster
CHAPTER 2. ICLUSTER: METHODS AND APPLICATIONS 41
Figure 2.14: iCluster+ Pancancer analysis heatmap
membership,with less than 50% of tumors represented in a given iCluster (BLCA, UCS, HNSC, ESCA, STAD, and CHOL).
The pan-GI cohort separated into three iClusters (C1, C4, and C18), primarily driven by differences in DNA methylation profiles. C1:STAD (Epstein-Barr virus [EBV]-CIMP) consisted of hypermethylated EBV-associated tumors, and C18:pan-GI (MSI) consisted mostly of microsatellite instability (MSI) tumors of STAD and COAD. C4:pan-GI (CRC) was predominantly COAD and READ with chromosomal instability (CIN) and a distinct
CHAPTER 2. ICLUSTER: METHODS AND APPLICATIONS 42
aneuploidy profile (Figure 2.14). The pan-squamous cohort formed three iClusters (C10, C25, and C27). The majority of LUSC fell into C10:pan-SCC, and nearly all CESC fell into C27:pan-SCC (human papillomavirus [HPV]). Even though all squamous iClusters were characterized by chromosome 3q amplification, unique features defined C10:pan-SCC (9p deletion) and C25:pan-SCC (Chr11 amp) (Figure 2.14).
Among mixed tumor type iClusters, three were defined by copy-number alterations. C7:mixed was characterized by chr9 deletion, C2:BRCA (HER2 amp) mainly consisted of ERBB2-amplified tumors (BRCA, BLCA, and STAD), and C13:mixed (Chr8 del) contained highly aneuploid tumors, including a mixture of BRCA-Basal, UCEC (CN-high subtype), UCS, and BLCA. C3 and C20 were defined by their non-tumor-cell components including immune and stromal features.
We explored the non-tumor components of the iClusters in more detail. We estimated the stromal fraction as 1 minus tumor purity and the leukocyte fraction based on DNA methylation. Of the mixed tumor types, C20 had the highest median stromal fraction fol-lowed C3 (Figure 2.15). Each of these iClusters also displayed elevated leukocyte fractions (Figure 2.16). To estimate how much of the stromal fraction was due to immune cell infil-tration, we investigated the stromal fraction versus the leukocyte fraction. In C3, more of the stromal fraction was defined by leukocytes than in C20. C3 contained predominately mesenchymal cancers, which we labeled C3:mesenchymal (immune). C20 tumors were pre-dominately mixed epithelial cancers, which we labeled C20:mixed (stromal/immune).
To characterize composition and relative homogeneity of each iCluster, we computed the dominant-cancer-type proportion within each iCluster and plotted it against the mean iCluster silhouette width, a measure of within-group homogeneity (Figure 2.17). The sil-houette widths ranged from -0.05 to 0.59, with the highest silsil-houette widths belonging
CHAPTER 2. ICLUSTER: METHODS AND APPLICATIONS 43
Figure 2.15: Stromal Proportion of Pancancer iClusters
![Figure 1.3: The ’triangle” method for integration of genotype, expression, and phenotype data [Gamazon et al., 2013].](https://thumb-us.123doks.com/thumbv2/123dok_us/8990307.2796926/24.918.284.693.235.467/figure-triangle-method-integration-genotype-expression-phenotype-gamazon.webp)