This is a post-print of the paper accepted for publication in Annals of Operations Research
Measuring efficiency of innovation using combined Data
Envelopment Analysis and Structural Equation
Modeling: empirical study in EU regions
K. Kalapoutia, K. Petridisb,1,C. Malesiosc and P.K. Deyd
a
Department of Economics Aristotle University of Thessaloniki, Thessaloniki, Greece b
Information Systems & e-Business Lab, Department of Applied Informatics, University of Macedonia,156 Egnatia Str., 54006, Thessaloniki, Greece
c
Department of Agricultural Development, Democritus University of Thrace, Pantazidou 193, Orestiada, Greece
d
Aston Business School, Aston University, Aston Triangle, Birmingham B4 7ET, UK
Abstract
The main aim of this paper is to investigate the impact of patent applications, development level, employment level and degree of technological diversity on innovation efficiency. Innovation efficiency is derived by relating innovation inputs and innovation outputs. Expenditures in Research and Development and Human Capital stand for innovation inputs. Technological knowledge diffusion that comes from spatial and technological neighborhood stands for innovation output. We derive innovation efficiency using Data Envelopment Analysis for 192 European regions for a 12-year period (1995–2006). We also examine the impact of patents production, development and employment level and the level of technological diversity on innovation efficiency using Structural Equation Modeling. This paper contributes a method of innovation efficiency estimation in terms of regional knowledge spillovers and causal relationship of efficiency measurement criteria. The study reveals that the regions presenting high innovation activities through patents production have higher innovation efficiency. Additionally, our findings show that the regions characterized by high levels of employment achieve innovation sources exploitation efficiently. Moreover, we find that the level of regional development has both a direct and indirect effect on innovation efficiency. More accurately, transition and less developed regions in terms of per capita GDP present high levels of efficiency if they innovate in specific and limited technological fields. On the other hand, the more developed regions can achieve high innovation efficiency if they follow a more decentralized innovation policy.
Keywords: Technological diversity, R&D, Patents, Data Envelopment Analysis, Structural Equation Modeling.
1
Corresponding author, Konstantinos Petridis, e-mail: [email protected], tel: +30 2310 891 728,
2
1. Introduction
The last thirty years European Union has applied several technological policies in order to increase innovation production across the regions. A issue of significant importance, however, is whether European regions can reach high levels of innovative efficiency.
The concept of technical efficiency was initially introduced by Farrell (1957).
Applying this concept from firm to regional level, Fritsch and Slavtchev (2010) define that ‘‘a region is technically efficient if it is able to produce a possible maximum of innovative output from a given amount of innovative input’’ (p. 91). Thus, our understanding of the efficiency of regional innovation system (RIS) follows the latter definition.
Researchers have rarely examined the efficiency of innovation activity— especially in terms of regional knowledge spillovers—by using aggregate data through DEA. Specifically, most of the papers do not examine knowledge transfer among a whole regional innovation system and usually confined to US data. Thus, several papers mainly focus on the effectiveness of universities research output transfer based on survey data (Thursby and Thursby 2002b; Berbegal-Mirabent et al. 2013; Anderson et al. 2007) where the creation of start up companies, licensing income, and patents production usually stand for outputs (Siegel et al. 2003; Thursby and Kemp 2002a; Chapple et al. 2005). Additionally, few papers use DEA to examine the effects of domestic R&D and international spillovers but their measurement is mainly based on trade and not patenting activity (Kim and Lee 2004).
Most relationships between innovation inputs and outputs are tested through regression models by the related literacy (Bottazi and Peri 2003; Guellec and Pottelsberghe de la Potterie 2004; Tappeiner et al. 2008, etc.). Regarding the efficiency measurement of knowledge transfer at regional level through regression models few papers are written. Identically, Fritsch and Slavtchev (2010) constructed an efficiency measure by relating regional R&D input and output and they investigated the way that regional specialization and other additional factors (high R&D intensity of the local private sector and knowledge from local public research institutions) impact on efficiency. Kalapouti and Varsakelis (2015), following an econometric analysis, constructed an efficiency measure by relating not only the conventional knowledge inputs (expenditures in R&D and Human Resources) but also
3
factors that determine knowledge diffusion within and between regions with the knowledge output.
In this study, we have constructed an efficiency measure following a Data Envelopment Analysis (DEA) by using as inputs R&D expenditure (R&D) and Human Capital (HC) and as outputs variables that measure the knowledge transferred between regions because of geographical proximity (Jaffe 1989; Bottazi and Peri 2003) and because of technological proximity (Jaffe 1986; Maurseth and Verspagen 2002; Bottazi and Peri 2003). Our main target is to investigate if EU regions can take advantage of their innovative inputs and leverage them in a manner that they can absorb and simulate the knowledge diffused from their geographical and technological neighbors. Specifically, our research concerns 192 EU NUTS- 2 regions and covers a 12 years period (1995-2006). This study puts into further scrutiny the regional capacity to leverage innovative inputs by controlling for the impact of a) patent applications that regions produce, b) regional employment level c) regional development level and d) the degree of diversity of innovative activity which takes place within regions on the efficiency measurement. We also investigate how the latter predictor variables interact with one another by following Structural equation modeling (SEM) analysis.
We argue that the contribution of this study is threefold. First, even though agglomeration economies have been used in research to associate innovative activity with various regional economic phenomena, such as growth (Romer 1990; Griliches 1984), employment level (Buerger et al. 2012) and the degree of technological diversity (Greunz 2004; Van Oort 2002), their impact on regional efficiency level has not been thoroughly examined. Second, we demonstrate how efficiency level of regional knowledge spillovers can be estimated through application of DEA methods. Third, it is shown that efficiency level of innovative activity can be predicted by various variables (patents production, development and employment level and degree of technological diversity) that take place at regional level through SEM analysis where causal relationships between variables—in contrast to typical regression analysis techniques—can be either directly observed or latent or a mixture of both of these. According to knowledge of authors of this paper, the combination of DEA and SEM modeling has not been implemented in such way before, especially in the specific field of research, thus the paper besides the empirical research contributions
4
can serve as an illustrative example of combining the latter methodologies for efficiency measurement and estimation through suitable causal factors.
The rest of the paper is organized as follows: The theoretical background is presented in Sect. 2 and the methodology is described in Sect. 3. A profiling analysis of the data is presented in Sect. 4 while results regarding efficiency are presented in Sect. 5. The factors that affect efficiency are presented in Sect. 6 while the results of the second stage are demonstrated in Sect. 7. Conclusions are drawn in Sect. 8.
2. Theoretical background
In recent years innovative activity of agglomeration economies has been mainly analyzed at regional level. Thus, many studies have underlined the important role of regional innovation system as interactions between knowledgeable agents to increase the learning capabilities of a region (Autio 1998; Doloreux 2002) and several essential determinants of economic performance are dominant (Storper 1997; Porter 2003; Uyarra 2010).
Grilliches (1979, 1990) in his seminal work analyzed the role of expenditures in Research and Development (R&D) as basic input of innovation and new knowledge creation while Romer (1986, 1990) emphasized the substantial role of human capital in knowledge diffusion. Guellec and Van Pottlesberghe de la Potterie (2004), estimated the contribution of several sources of knowledge (public and private R&D) in productivity growth. Tappeiner, et al. (2008) found that three basic inputs (R&D, human and social capital) exert an economically substantial impact on the level of regional innovation. However, the literature argues that the production of innovation is not only a result of inputs mentioned before, but also a result of knowledge diffused by other agents (businesses, cities, regions). Thus, absorptive capacity is crucial since it proves the ability of an agent to identify, assimilate and exploit knowledge from the environment (Cohen and Levinthal 1989; Criscuolo and Narula 2002).
Therefore, we may conclude that there are some special features which characterize the ability of agents (e.g. regions) to enforce the knowledge spillovers either within them (intra- regional spillovers) or between them (inter- regional spillovers). The composition of innovative activity that a region applies determines its intra- knowledge spillovers and has been the subject of a heated debate in the economics literature. Two theoretical tracks have been developed around this debate
5
to explain whether diversity or specialization of economic activity stimulates better technological change and subsequent innovation and economic growth. The first track is based on the Marshall’s (1890) analysis and the second follows the Jacob’s (1969) analysis. According to Marshall, agents specialized in similar technological fields achieve stronger knowledge spillovers and subsequently higher new knowledge production. Jacobs (1969), on the other hand, argues that knowledge spillovers are increased between agents of different but complementary industries.
Although there is a plenty of empirical literature sources testing these theoretical tracks, it is unclear whether specialization or diversity promotes more innovative activity. For the US the majority of the findings support diversity (Glaeser et al. 1992; Feldman 1999a; Feldman and Audretch 1999b). However, in small cities, specialization promotes knowledge diffusion between industries which belong to the same sector (Henderson 1997).
At the European Union’s level, Paci and Usai (2000) and Moreno et al. (2006) found a positive relationship between industry specialization and regional innovative output. On the other hand, Greunz (2004), for several European regions found that new knowledge creation is positively influenced by diversity. Similar results were also found for regions in Netherlands (Ouwersloot and Rietveld 2000; Van Oort 2002). Fritsch and Slavtchev (2010) studying German regions, found an optimum level of industrial diversity beyond which an increase in diversity may have a negative impact on innovative efficiency.
Apart from each region’s innovation infrastructure which influences intra-regional knowledge spillovers, special factors facilitate the knowledge transfer between regions (interregional knowledge spillovers). Two of these factors deal with geographical and technological proximity between the knowledgeable regions since significant part of the literature found that knowledge spillovers are strongly affected by both of them.
At the European regional level, knowledge spillovers based on patenting activity are enhanced from geographical proximity (Maurseth and Verspagen 2002; Bottazi and Peri 2003; Tappeiner et al. 2008) as the capacity of regions to compete is linked to specific local competitive advantages and enhanced by the geographic proximity that is crucial to diffuse and strengthen them (Uyarra 2010). A plenty of literature sources regarding the USA (Jaffe 1989; Feldman and Florida 1994; Feldman
6
1999a; Acs et al. 1994; Anselin et al. 1997) come to reconfirm the positive relationship between spatial proximity and innovation productivity.
However, geographical proximity alone is not sufficient to enhance knowledge spillovers across regions as the regional capacity to absorb and exploit the knowledge coming from outside allows knowledge spillovers developing beyond regions’ surrounding areas. The concept of absorptive capacity (Cohen and Levinthal 1990) and technological proximity (Jaffe 1988) at firm level, can be easily applied at regional level (Caragliu and Nijkamp 2012). Thus, empirical literature underlines the substantial role of technological proximity as spatial proximity is not enough for absorbing knowledge if regions do not innovate in similar technologically fields. Following a similar methodology to Jaffe (1988) at regional level, Maurseth and Verspagen (2002) found that the patents of pairs of 112 European regions that innovate in similar technologically fields are more frequently cross cited than other pairs. Greunz’s (2003) results show that when technological proximity is weighted by a geographical decay factor, the technological knowledge spillovers increase. Moreno et al. (2005) show clearly that innovative activity across 175 European regions is getting enforced with the simultaneous existence of technological and geographical proximity.
Summarizing, based on the related literature, the role of diversity innovation degree and of spatial and technological neighborhood in regional knowledge transfer is essential at this paper’s analysis in the context of innovation efficiency.
3. Methodology
The two stage methodology steps followed in the current study are presented in this section. In the first stage, the production process is described and inputs and outputs are used to extract the efficiency score based on which countries are ranked, through DEA. In the next stage (second stage analysis) the effect of external factors on the efficiency scores is investigated, through SEM. The methodologies used in this analysis are described analytically below.
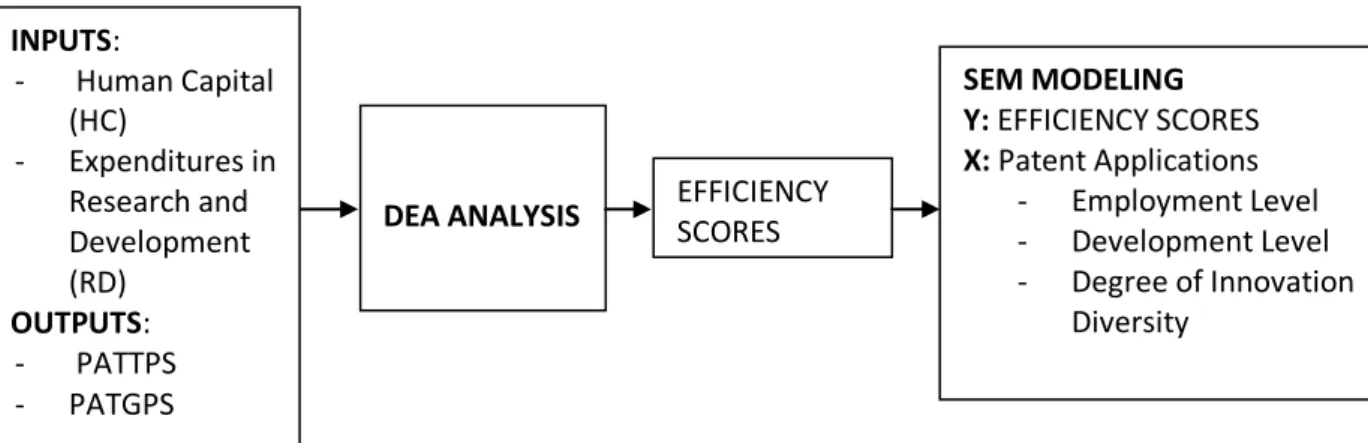
The following flowchart presents in summary the methodological steps of our analysis (Figure 1).
7
Figure 1 Step-by-step description of methods of the current study
3.1. Data Envelopment Analysis
A main claim in the present paper is that the final level of efficiency as was measured by the Data Envelopment Analysis (DEA) is significantly influenced from various predictors that are not directly related to R&D efficiency of patents. Nevertheless, few studies have put these claims to the test as far as patent efficiency is concerned. In order to assess the efficiency of each region based on the patents and other characteristics, an underlying production function is assumed.
Data Envelopment Analysis is a benchmarking technique that assesses the efficiency of a unit in comparison to other homogeneous units. These units are called Decision Making Units (hereafter DMUs). Based on the assumption that each DMU consumes inputs ( ) to produce outputs ( ), then in order to assess efficiency, the following linear programming (LP) model is formulated: (1) INPUTS: - Human Capital (HC) - Expenditures in Research and Development (RD) OUTPUTS: - PATTPS - PATGPS
DEA ANALYSIS EFFICIENCY SCORES
SEM MODELING Y: EFFICIENCY SCORES X: Patent Applications - Employment Level - Development Level - Degree of Innovation Diversity
8
In LP model (1), variable measures the efficiency of each DMU and yields a score in the range of . A DMU is efficient if and inefficient for ( denotes the optimal solution). Model (1) is considered as a Variable Returns to Scale (VRS), however, removing constraint , then the corresponding DEA model (1), is a Constant Returns to Scale (CRS). Constant returns to scale technology assumes that a reduction in the inputs will lead to a proportional increase in outputs but under VRS technology is assumed that there is no proportionality between inputs and outputs. The DEA models have been solved using Benchmark package (Bogetoft and Otto 2010) in R Studio (Studio R, 2012).
As DEA is a benchmarking technique, then additional information on the projected values can be derived. In the case where a DMU is not efficient, then a re-adjustment must be done in inputs and outputs so that this DMU will become part of the frontier of efficient DMUs.
(2)
9
In LP formulation (2), the slack variables ( , ) are associated with inputs and outputs corresponding and provide a magnitude of reduction or increase correspondingly in order for an inefficient DMU to become efficient. A DMU is fully efficient if and . For inefficient units, the projected values (for inputs and outputs) are given by the following formulas: for inputs and .
The model adjusted to the data used in this analysis is formulated as follows:
(2)
3.2 Structural Equation Modeling (SEM)
Structural equation models (SEM) (Bollen 1989) is a system where causal relationships are modeled between variables. The distinguishing feature is that variables here – in contrast to typical regression analysis techniques – can be either directly observed or latent or a mixture of both of these.
Fitting a SEM model with maximum likelihood assumes multivariate normal data and a reasonable sample size (e.g. N>=200 measurements). However, with non-normal data, for instance to apply structural equation modeling with ordinal variables, there exist alternative methods such as the method of Weighted Least Squares (WLS) (Jöreskog 1994).
As regards assessing the fit of a SEM model, there exist a large variety of goodness-of-fit measures that are mostly functions of the model’s chi-square. Typical
10
examples of such indices are the GFI (goodness-of-fit index) and the AGFI (adjusted goodness-of-fit index) devised by Jöreskog and Sörbom (1989), with AGFI adjusting the GFI for the complexity of the fitted model. Another popular measure is the Root Mean Square Error of Approximation (RMSEA). If the fit of the model is good, GFI and AGFI should approach one, whereas RMSEA should be small (typically less than 0.05).
In the current analysis, we employ the efficiency variable as derived from the first-stage analysis utilizing DEA, and subsequently fit a Structural Equation Model linking efficiency with various potential predictors to examine associations between the latter with efficiency and between each other. We fit the SEM model by utilizing the IBM SPSS AMOS software (Arbuckle 2006).
4. Data
In each production process, the inputs and outputs of each unit under assessment should be provided in order to extract the efficiency of each unit. In this production process it is assumed that each region is the unit under assessment. Our database consists of 192 NUTS- 2 European regions which produce and exchange knowledge for 12 years (1995-2006) and we have estimated the average values of some measures which constitute the dependent variable of our model. The appropriate data have been extracted by Eurostat2.
In particular, there are 192 regions ( to be assessed based on the fact that, consume inputs to produce outputs. The inputs considered here, are Human Capital (HC) and R&D expenditure (R&D) while the outputs are the PATTPS and PATGPS. The vector of inputs consists of the number of researchers in science and technology and the expenditures in research and development. We use annual data on Human Resources in Science and Technology (HC) as percentage of total population as a proxy of the first input and the total intramural R&D expenditure (R&D) measured as euro per inhabitant as a proxy of the second input. Inter-regional knowledge spillovers are used to measure the outputs and they captured by PATGPS and PATTPS variables3. PATGPS measures the knowledge transferred between regions because of geographical proximity and PATTPS measures the knowledge transferred between regions because of technological proximity.
2
Data were retrieved from http://ec.europa.eu/eurostat.
3Following Kalapouti and Varsakeli’s (2015) methodology we construct
11
Patents have been extensively used as a proxy for measuring innovative output—and therefore as proxy of new knowledge creation—as they are a reliable and direct indicator of “innovation” (Acs et al. 2002) and “a good approximation to ideal data on “economically profitable ideas which one would like to have for testing theories on innovation” (Botazzi and Peri 2003, p. 692).
In this paper we refer to patents according to application date measured per million of inhabitants. Patent applications are filed at the European Patent Office- (EPO) and they are classified according to International Patent Classification (IPC). Regional spatial proximity, which has been extensively used in literature, is measured by a quadratic matrix GP for the 192 regions. Each element GPjk of the GP represents the geographical proximity between regions j and k. It takes the value 1 for two neighboring regions and 0 otherwise. Next, the product of multiplication of the GP matrix with the vector of patents P gives the vector of the global knowledge for region j weighted by the geographical proximity. PATGPSj indicates whether the region j is contiguous to strong innovative regions (PATGPSj takes high values) or to weak innovative regions (PATGPSj takes low values).
The concept of technological proximity at firm level has been extensively used by Jaffe (1986, 1988) based on the concept of technological distance and patents classification. We adopt Jaffe’s (1988) concept at cross regional level analysis to capture the impact of technological proximity on inter- regional spillovers using the patent applications to EPO, disaggregated into the 121 technological fields of the IPC:
where
and is the number of patents of technological field i in
region j and is the number of patents of technological field i in region k. Since the number of technological fields is N, there are two vectors: and and the angular separation between and leads to the quadratic matrix TP. The element TPjk of TP is a positive correlation index which takes values in [0, 1]. If TPjk tends to 0, the regions j and k contact research in different technological fields. On the other hand, if TPjk tends to 1, the regions j and k conduct research in similar technological fields. Finally, if TPjk =1, the regions j and k conduct research in exactly the same fields.
12
In order to capture inter- regional spillovers due to technological proximity, we multiply TP with the vector of patents P, the global stock of knowledge. The result is the vector PATTPS, whose elements could be regarded as each region’s global knowledge weighted by technological proximity. A PATTPSj =0 is an indication of low absorptive capacity since the region conducts research completely different from those regions which produce high volume of knowledge. A high PATTPSj is an indication that the region j is technologically contiguous to strongly innovative regions and, therefore, the region j will absorb more knowledge from the public domain.
It is of high concern to investigate if regions can take advantage of their innovative inputs and leverage them in a manner that they can absorb and simulate the knowledge diffused from their geographical and technological neighbors.
The descriptive statistics of the production process are demonstrated in Table 1 while the dispersion of the observations for inputs and outputs is given in Figures 1 and 2.
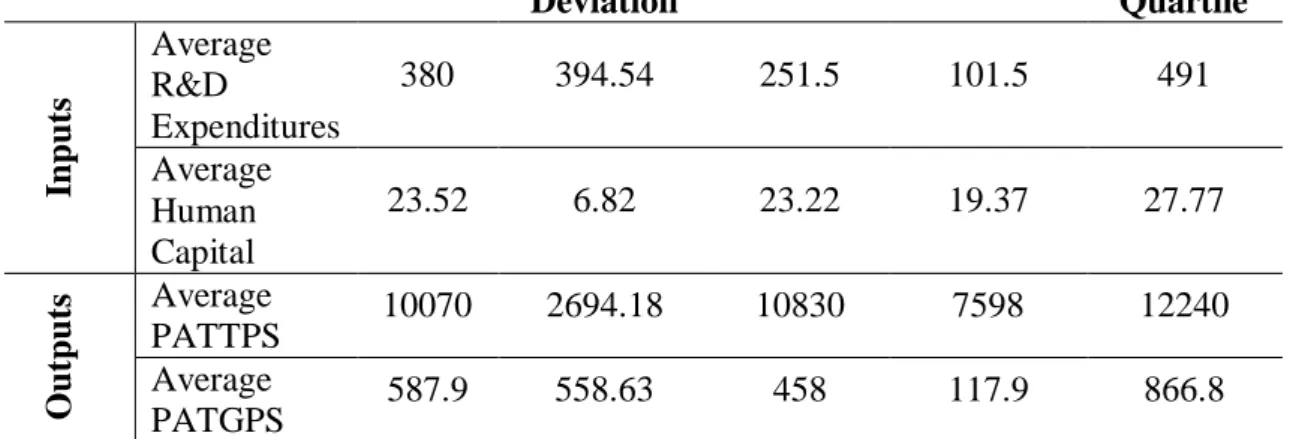
Table 1: Summary statistics of the inputs and outputs used for Data Envelopment Analysis.
Mean Standard Deviation Median 1 st Quartile 3 rd Quartile In p u ts Average R&D Expenditures 380 394.54 251.5 101.5 491 Average Human Capital 23.52 6.82 23.22 19.37 27.77 Ou tp u ts Average PATTPS 10070 2694.18 10830 7598 12240 Average PATGPS 587.9 558.63 458 117.9 866.8
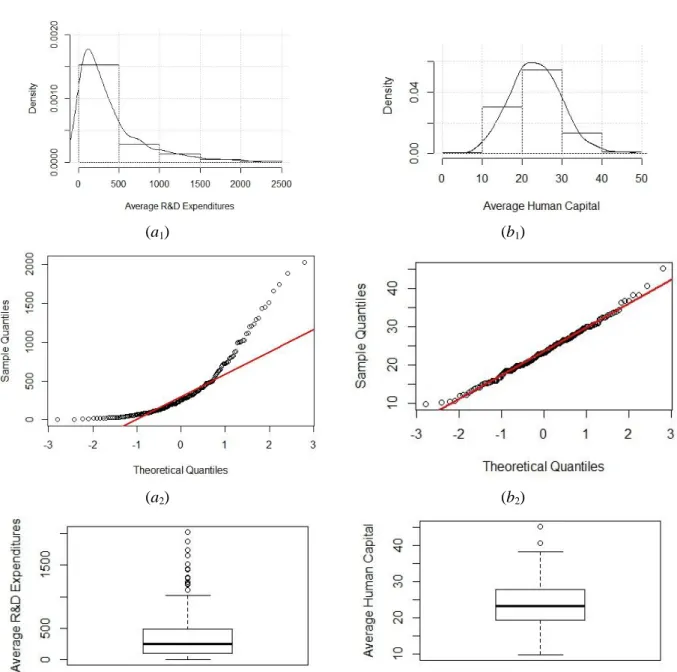
In Figure 2 a graphical statistical summary of input variables RD and HC is demonstrated. From Figure 1 a1 and a2 it is observed that the distribution of average
expenditures on R&D is not symmetrical. On the contrary, average human capital input variable is symmetrical and normally distributed as visually inspected from Figure 3 b1, and b2; both histogram and quartile plot indicate normality in data
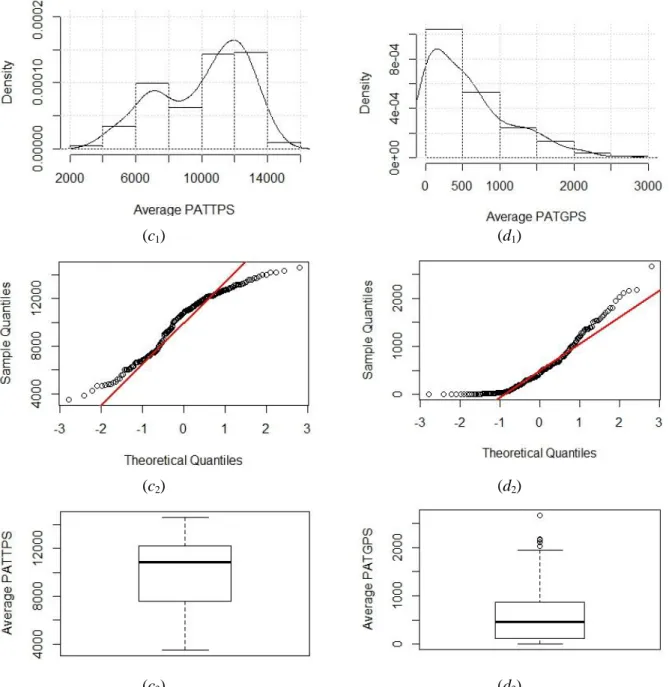
distribution. Regarding the outputs as presented in Figure 3, there is no symmetrical distribution on the average PATTPS and average PATGPS output variables. More
13
specifically, concerning the average PATTPS the largest concentration of values is found between 10000 and 14000 (Figure 2, c1) while the largest concentration of
values for average PATGPS output variable is observed in the interval [0, 500].
(a1) (b1)
(a2) (b2)
(a3) (b3)
Figure 2: Graphical illustration of input variables: a1) histogram of average expenditures on Research & Development,b1) histogram of average Human Capital, a2) quartile plot of average expenditures on Research &
Development,b2) quartile plot of average Human Capital,a3) boxplot of average expenditures on Research & Development,b3) boxplot of average Human Capital
14
(c1) (d1)
(c2) (d2)
(c3) (d3)
Figure 3: Graphical illustration of output variables: c1) histogram of average PATTPS,d1) histogram of average PATGPS, c2) quartile plot of average PATTPS,d2) quartile plot of average PATGPS,c3) boxplot of average
PATTPS,d3) boxplot of average PATGPS
5. First-Stage Analysis Results
5.1 Efficiency analysis-Data Envelopment Analysis (DEA) Results 5.1.1 Aggregated analysis
One of the main characteristics of DEA is that a single score is extracted based on the inputs and outputs that are assumed. Solving LP model (1) a VRS technology is assumed while removing constraint , then CRS technology is assumed.
15
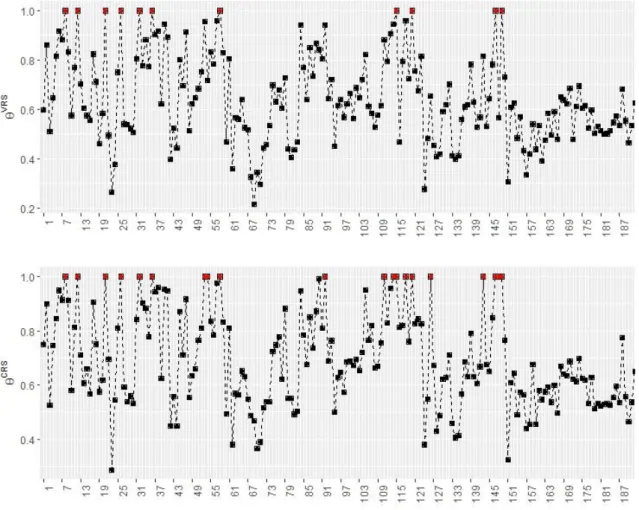
The efficiency scores for each technology assumed are shown in Figure 4. It can be seen that under CRS technology, there are more efficient units (viz. θCRS=1) than under VRS technology. More specifically, there are 20 efficient DMUs under CRS technology while only 11 under VRS. This indicates that VRS technology provides more discrimination power providing better analysis for the specific set of inputs and outputs.
Figure 4: Line plots of efficiency under VRS technology (θVRS) and CRS (θCRS).
Under CRS technology the following efficient units (DMUs), corresponding to research regions producing patents, were identified: 1 Austria, 1 Belgium, 1 Bulgaria, 1 Czech republic, 5 Germany, 1 France, 2 Hungary, 3 Italy, 1 Latvia, 2 Poland, 1 Portugal, and 1 Romania. The names of the institutes with the corresponding data are provided in Appendix (Table A1).
Under VRS technology the following efficient units (DMUs), corresponding to research regions producing patents, were identified: 1 Austria, 1 Belgium, 1 Bulgaria, 1 Czech republic, 3 Germany, 2 Italy, 1 Portugal and 1 Romania. The
16
names of the institutes with the corresponding data are provided in Appendix (Table A2). At this point it is essential to mention that the presence of high efficiency levels (in both technologies) in some regions that belong to less developed countries (e.g. Bulgaria, Romania, etc) can be explained by some special circumstances which are subsequently described (sections 7 and 8). Therefore, we can conclude that these types of countries can take advantage of knowledge transferred by their technological and spatial neighborhood under specific conditions although they do not present high level of innovative inputs.
The aforementioned efficiency analysis, as illustrated in Figure 5, concerns all the countries. However, based on Figure 4, it can be seen that there is a segregation of the countries based on the average number of patents. There is a finite line that divides countries based on their potential to produce patents; the countries that belong to the first group are located geographically in Northern Europe. These countries are Germany, Finland, Sweden, Luxemburg, Austria, Netherlands, Belgium, France, and the UK. Under the dashed line (Figure 4) which indicates less than 50 patents on average level, there are Eastern and Southern European countries. Therefore, a separate DEA analysis on the two groups should be made that would lead to sensible comparisons between countries.
17
5.1.2. Analysis for Groups 1 and 2
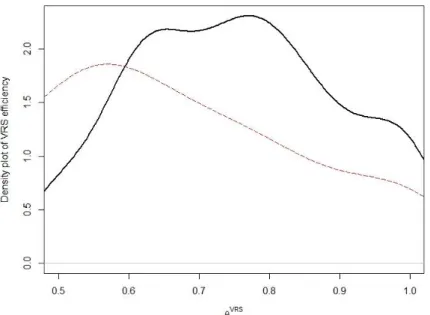
Here the analysis for each group (namely Group 1 and 2) is presented. Northern Europe countries belong to Group 1 and efficiency scores are compared against the efficiency scores of Group 2 (Easter and Southern European countries). From the aforementioned segregation of countries into two groups, according to Figure 4, 121 research regions (DMUs) belong to Group 1 while 70 DMUs belong to Group 2. From Figure 5, it can be seen that the efficiency scores from Group 1 are higher in comparison to the same efficiency scores of Group 2. More specifically, it must be noted that under VRS technology, 10 DMUs were efficient (namely ) from Group 1, whereas 7 DMUs were efficient from Group 2. The density as illustrated in Figure 6 confirms the results.
Figure 6: Density function of efficiency scores under VRS technologies for Group 1 (black line) and Group 2 (red line).
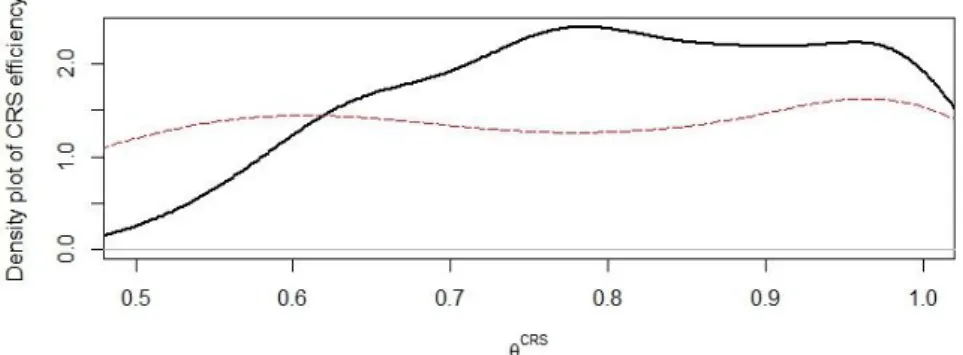
Regarding the efficiency analysis under CRS technology, the results for Groups 1 and 2 are shown in Figure 7. Again, the efficiency scores from Group 1 outperform the corresponding scores from Group 2. From Figure 7, it can be seen that in the interval 0.9 until 1, the solid black line (Group 1) is higher that the corresponding red line (Group 2).
18
Figure 7: Density function of efficiency scores under CRS technologies for Group 1 (black line) and Group 2 (red line).
6. Second-Stage Analysis Results
6.1 General Description of the factors expected to affect innovative efficiency (Predictor Variables)
Measuring the efficiency of technology transfer is a special issue that concerns not only specific spin off companies (Perez and Sanchez, 2003) or universities (Anderson et al. 2007, Thursby and Kemp, 2002), but also the whole system of regional stakeholders who play an active role in technology transfer process.
Fritsch and Slavtchev (2010) constructed an efficiency measure by relating regional R&D input and output. More specifically, efficiency in 93 German regions was measured by the output elasticity of private sector R&D employment which was estimated by means of robust negative-binomial regression technique. They investigated the way that regional specialization and other additional factors (high R&D intensity of the local private sector and knowledge from local public research institutions) impact on efficiency. They found that both these factors influence efficiency but their impact is different for regions at different efficiency levels.
Kalapouti and Varsakelis (2015) constructed an efficiency measure for 210 European regions by relating not only the conventional knowledge inputs (expenditures in R&D and Human Resources) but also factors that determines knowledge diffusion within and between regions with the knowledge output. Panel data analysis proved that fixed effects were valid and therefore the regional idiosyncratic constants of their Knowledge Production Function had been used as a proxy of Total Factor Productivity or a leveraging capacity-efficiency (LCE) term. They prove that there are regions which although produce many patent applications they do not efficiently leverage their innovative inputs. They also show that there are
19
regions which are able to efficiently leverage their innovative inputs despite the fact that they are not ranked to the top regions in terms of innovative activity.
This study puts into further scrutiny the regional capacity to leverage innovative inputs as we will empirically test the role of regional economic performance, the European regions’ level of development and the degree of diversity of innovative activity which takes place within regions vis-à-vis other predictors on patent efficiency. Thus, our analysis helps in offering further clues on an ongoing under examined theoretical issue.
Therefore, in the present study we shall examine the influence of a) patent applications and b) employment level, which both compose regional economic performance, c) a dummy variable of region, which captures regions’ development level, and d) NEI, which measures the diversity of regional innovative activity, on the efficiency measurement. We are also interested on how the various predictor variables interact with one another. Since our research covers a twelve years period (1995-2006) we have estimated the average values of these variables which influence the dependent variable of our model.
a) Patent Applications
Studies that use patent statistics as technology indicator consists a major part of the relative literature observing mainly the relationship between technological change, as measured by patent statistics, and economic development (Schmookler 1966, 1972; Griliches 1984).Since endogenous growth theory links innovation and growth,
technological change has been regarded as a major source of long-run productivity growth (Romer 1990; Grossman and Helpman 1991), with innovation no longer being treated as an exogenous process.
Therefore, differences in innovation capacity and potential become, from an ‘endogenous growth’ perspective, one of the basic explanations for persistent differences in wealth and economic performance (Rodríguez-Pose and Crescenzi, 2008). The use of patents indicator has been extensively analyzed in the previous section. The data of patent applications have been extracted from Eurostat.
b) Employment level
The level of employment is a basic identical index which reveals the level of economic performance where each region presents. Various studies (Freeman et al. 1982; Freeman and Soete 1987; Freeman and Soete 1994; Vivarelli and Pianta 2000; Edquist et al. 2001) underline the positive relationship between innovation
20
productivity and employment since innovations contribute to the development of either entire new goods or main differentiation of mature goods.
Greenan and Guellec (2000), using data from French manufacturing sectors over the period 1986-90, found out a positive relationship between innovation and employment at the firm’s level (both product and process innovation). Yet, at the sectoral level, their results confirmed the idea that only product innovation create additional jobs, while process innovation generate jobs within the innovative firm but at the expense of the competitors, leading to an overall negative effect at the sectoral level. Hall et al. (2008) found a positive effect on employment of product innovation and no evidence of employment displacement due to process innovation using a panel of Italian manufacturing firms over the period 1995-2003. Buerger et al. (2012) found that an increase in patents is associated with subsequent growth of employment in German regions over the period 1999–2005.
It is obvious that the relative literature has mainly investigated the effect that innovation has on employment level. Thus, since little knowledge is available about the effect of employment level on innovative activity and particularly on innovative efficiency, this paper tries to shed light to this direction. Data for regional level of employment are also available by Eurostat for the period of twelve years and therefore we calculate the average level of employment for every single region. Employment is measured in thousands of people from 15 to 64 years old.
As both Patents and the level of Employment are identical variables measuring the economic performance of European regions, they constitute a variable called Regional Effects.
c) Region
A dummy variable has been constructed and depicts the development level of each region in terms of per capita GDP4. Traditionally, per capita GDP measures the development level in a given area (city, region, country) and it has been connected with innovative activity by researchers (Griliches 1984; Romer 1990; Furman et al. 2002) since innovative activity leads to productivity growth and therefore to development.
Specifically, for the most developed regions dummy variable takes the value 1, for the transition regions dummy variable takes the value 2 and 3 for the less
4
21
developed regions. According to European Commission (2014), these regions (mainly the transition and less developed regions) are eligible for structural funds which go to research and development and aim to increase innovative activity. Therefore, we are interested to investigate which of these regions can absorb more efficiently these funds. In other words, we will investigate if the level of development in European regions plays an important role to regional leveraging capacity.
d) NEI
With the current study we investigate if the degree of innovative diversity in a region affects its capacity to efficiently manage its innovative inputs. To put it differently, we test if a region which produces patent applications in many technological fields can manage efficiently its innovative inputs. So, does diversity in innovative activity enforce regions to accept and diffuse knowledge from and to their spatial and technological neighbors?
Entropy index is an adequate measure for the diversity of regional economic activity because it takes into consideration the share and the variety of the regional sectoral activity (Audretsch et al., 2010). Variety, according to Audretsch et al. (2010), refers to “richness”, that is the sectors that are present in the specific region and the distribution of those different sectors within the regional economic activity. Raw data reveal that not all sectors are present in the innovative activity of every region. Therefore, as Frenken (2004) pointed out, entropy index, due to its decomposition property, considered an appropriate measure of regional industrial diversification. In this paper, we use the Shannon’s entropy index as a measure of the technological diversity5. We calculate the Normalized Shannon’s Entropy Index (NEI) (Kumar, et al. 1986):
where is the patents share of the technological field i in the total innovation activity of region j. N is the number of technological fields, i= 1, 2,…, 121, j is the number of regions, j=1, 2, … , 192. The NEI takes values from 0 to 1. If NEIj=0 the region produces innovations in one field only. If NEIj=1, the regionally produced innovations are equally distributed across the 121 technological fields. Therefore, an
22
increase of it means that the innovation activity becomes more diversified. NEI is calculated for the twelve years period and we use the average NEI for each region.
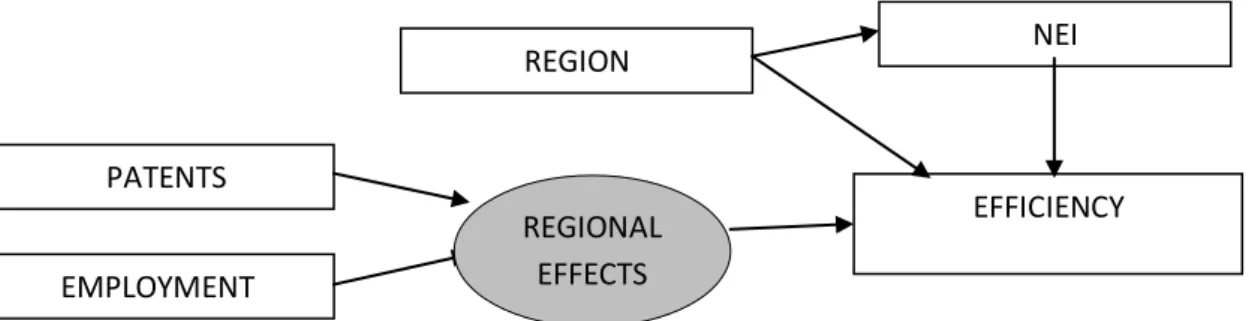
The conceptual model for our analysis is shown in the following graph (Figure 8).
Figure 8: Conceptual theoretical model (the shaded circle represents the latent construct created by the variables of patents and employment level – rectangles represent the observed items of the SEM analysis model).
According to the hypothetical associations depicted in the previous graph, the PATENTS and level of EMPLOYMENT are forming a more general construct of REGIONAL EFFECTS.
We then explore the connection between the EFFICIENCY level with this latent variable of REGIONAL EFFECTS and then we introduce the REGION and NEI variables in order to explore whether there is a direct connection between them and the level of EFFICIENCY. Finally, we also test whether the variable of REGION is indirectly affecting the EFFICIENCY through the variable of NEI.
7. Structural Equation Model (SEM): Model fit and results
In order to test our research hypothesis we implement a SEM analysis with latent and observed structures using the IBM SPSS AMOS software (Arbuckle, 2006). In particular, the fit of the SEM model depicting effects of the various independent variables on level of EFFICIENCY is presented by the following path diagram (Figure 9). PATENTS EMPLOYMENT EFFICIENCY NEI REGION REGIONAL EFFECTS
23
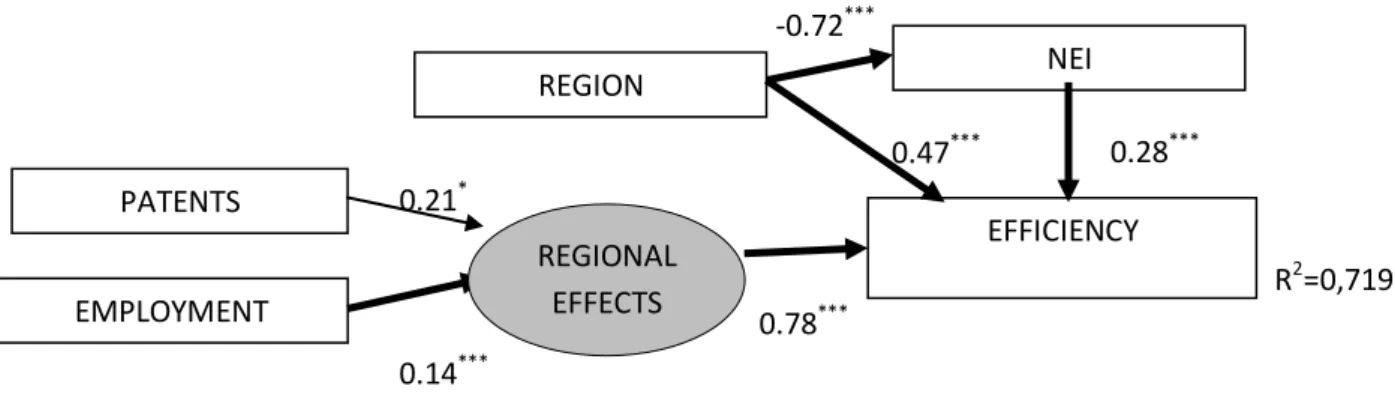
Figure 9: Standardized regression weights of the fitted empirical SEM model.
***: p< 0.01; **: p<0.05; *: p<0.1; R2: Nagelkerke’s R square
In this graph, the single-headed arrows are used to imply a direction of assumed causal influence while the numerical values next to each arrow correspond to the standardised factor loadings (β’s) of each item on the corresponding latent/observed variable while the statistical significance of each loading is also indicated by the corresponding asterisks. Finally, we also report the Nagelkerke’s R2 for the “EFFICIENCY’’ variable.
From the results of the analysis we observe that the level of EFFICIENCY is connected positively with the NEI variable (β = 0.28, p-value<0.001), the REGION (β=0.47, p-value<0.001) and with the latent variable of REGIONAL EFFECTS (β=
0.78, p-value<0.001). The latter results imply that the European regions that tend to achieve high levels of “NEI”, “REGION” and “REGIONAL EFFECTS” they also present a higher level of EFFICIENCY.
It is interesting also to note that for the “REGION” item besides the significant direct effect on the “EFFICIENCY”, it also has a significant indirect effect on this variable, through the “NEI” variable (β = -0.72, p-value<0.001). The negative sign of this coefficient indicates that the less developed regions (“REGION” variable takes increased values) are characterized by a more concentrated innovative policy which means that they innovate in specific and limited technological fields.
Regarding the connection of “REGIONAL EFFECTS” variables with the latent construct of “REGIONAL EFFECTS”, PATENTS is positively correlated with this latent construct (β = 0.21, p-value<0.1). The positive relation is also presented with the level of EMPLOYMENT. In particular, EMPLOYMENT is positively correlated
PATENTS EMPLOYMENT EFFICIENCY NEI REGION REGIONAL EFFECTS 0.21* R2=0,719 0.28*** 0.47*** 0.78*** 0.14*** -0.72***
24
with “REGIONAL EFFECTS” (β = 0.14, p-value<0.001). In Table 2 we report the predictor variables effects’ on efficiency, both direct and indirect.
Table 2: Effects’ analysis on efficiency levels (based on the standardized path coefficients)
‘NEI’, ‘REGION’ and ‘REGIONAL EFFECTS’ predictors
Latent/observed variables Effects Direct Effect (DE) Indirect Effect (INDE) Total Effect (=DE+INDE) NEI 0.283 --- 0.283 REGION 0.474 -0.046 0.428 REGIONAL EFFECTS 0.78 --- 0.78 Squared multiple correlation (R2) 0.719
The squared multiple correlation R2 multiple correlations index for the model is 0.719 while the fit statistics available by the AMOS software reveal a good fit of the model to the data (RMSEA: 0.05, GFI: 0.851). As is shown by the value of the R2, the fitted model explains a large proportion of the level of EFFICIENCY variance (71.9%).
Generally, the results of SEM analysis reveal that NEI, REGION and REGIONAL EFFECTS are all influential factors concerning the formation of the EFFICIENCY levels; however it is observed that this influence is not the same among all EFFICIENCY parameters.
8. Discussion & Conclusions
During the last two decades in the EU, an extensive funding in research and innovation has taken place (Cohesion Policy 2007-2013, Horizons 2020) with the ultimate goal of enhancing innovative activity and the European Research Area (ERA) Integration. Region has been extensively used as a territorial unit of innovative activity by many researchers who extensively analyzed patenting activity and regional knowledge transfer determinants. As policy makers expect to achieve the highest possible returns of funding in research and innovation, we investigate the way that some basic factors can influence the regional innovative efficiency.
To attain this, we have constructed the dependent variable of our model (“EFFICIENCY”) by utilizing DEA, where expenditures in research and development (R&D) and Human Capital (HC) constitute its inputs and knowledge spillovers due to
25
spatial and technological proximity (PATGPS and PATTPS respectively) constitute its output. Our research question concerns the capacity of regions to manage their innovative inputs in order to accept and absorb more efficiently the technological knowledge that comes from their spatial and technological neighbours. Using SEM, as a second stage analysis, we investigate in which way various factors can influence innovative efficiency. Therefore we test if regions with high a) innovative activity, b) employment level, c) development level and d) technological diversity present high innovative efficiency.
The results indicate that regions which present high innovative activity through patents production they also present high innovative efficiency. This means that as regions produce knowledge via patent applications they not only contribute to their innovative activity but also create the structures to decode and exploit the knowledge spillovers from their neighbours in geographical and technological space (inter- regional knowledge spillovers). Therefore, these regions the more they innovate the more they develop the capacity and skills to leverage and absorb more efficiently inter- regional knowledge spillovers as knowledge transfer is most likely to be exploited first in those regions whose innovative environment is most conducive to the development of new-to-the-world technology.
On the other hand, the results show that regions characterized by high levels of employment achieve to manage efficiently their innovative sources as a larger part of employees are devoted to sectors of research and development. Besides, as the technology transfer process demands trained and skilled personnel and adequate resources (Rogers et al. 2001), a greater number of employees in a region increase the opportunity of its innovative agents to find suitable partners from its spatial and technological neighborhood in order to cooperate and exchange knowledge.
Therefore, when regions dispose both high level of patents production and employment, which compose the regional effect, efficiently manage their innovative sources. These regions can follow the technological changes, employees can be adjusted to new conditions, as the high skilled workers are getting increased, and therefore they are able to produce more innovative products.
Furthermore, we observe that the level of regional development influences innovative efficiency. More accurately, the dummy variable of “REGION” has a positive direct effect on the “EFFICIENCY” which means that transition and less developed regions (“REGION” variable takes increased values) in terms of per capita
26
GDP present high levels of efficiency. This finding reveals an interesting option of transition and less developed regions as, although they do not present very high level of development (and usually very high innovative activity), they are able to manage their innovative sources efficiently. This statement does not imply that developed regions are not able to manage their innovative inputs, but that transition regions can achieve better efficiency levels without a high waste of their - usually limited- innovative sources. However, this indication has to be associated with the impact of low NEI index on transition and less developed regions and with the impact of high NEI index on more developed regions as our estimations prove that REGION has a significant and negative indirect effect on EFFICIENCY, through the NEI variable. This finding may be explained as following:
The more developed regions can achieve high innovative efficiency if they follow a more decentralized innovative policy. These regions present also high levels of patents production and of employment. Therefore, if they choose to distribute their innovative activity and their innovative inputs in a wide range of technological fields they will achieve a high efficiency level. On the other hand, if the transition and less developed regions follow a more concentrated innovative policy they can reach higher levels of innovative efficiency. As they present a moderate patents production and a relatively low level of employment, they have to select specific technological fields to innovate and not to disperse their capabilities in many technological fields. This position gleaned from our estimations, supported also from the context of Regional Smart Specialization which forms one of the main pillars of the reformed EU Cohesion Policy and highlights the need for regions to identify and select their own potential sources of innovation and economic growth. In that respect, regions should proceed to self-assessment of their knowledge assets, capabilities and competences and the knowledge agents between whom knowledge is exchanged (Mccann and Ortega-Argile´s 2013, p. 10).
One of the basic principles of Regional Smart Specialization is the specialized diversification. Since, each region is characterized by specific structure, it is able to take advantage of its domains where specific technologies are dominant and to promote diversity of activities in these existing technological fields. Therefore, we can argue that regions which apply specialized diversification across related technologies can achieve growth (Mccann and Ortega-Argile´s 2013). Besides, ‘‘self-discovery’’ (Hausmann and Rodrik 2003) is critical for regions’ success. The smart
27
specialization suggests that the policy recommendations at regional level may be very different across different places, depending on the region’s technological profile, industrial structure and geography. The S3 platform aims to assist regions and the EU Member States in developing, implementing and reviewing regional smart specialization strategies, and help regions identify high-value added activities which offer the best chances of strengthening their competitiveness (Commission of Europe 2010).
In the light of our results, the ‘‘one size fits all’’ technological policy is not the appropriate for European regions if they aim to take advantage of knowledge that comes from their spatial and technological neighborhood. If regions develop the mechanisms to efficiently decode and exploit the technological achievements that take place in several sectors, then EU funding devoted to innovation will be proved fruitful for the recipient regions. Therefore, as each European region presents its unique technological profile, EU should apply a ‘‘tailor made’’ technological policy to increase each region’s level of efficiency.
28
Appendix
Table A1 Fully efficient DMUs under CRS technology.
Regions average RD average HC average PATTPS average PATGPS AVERAGE PATENTS
AT330: Tirol (Austria) DMU08 581.925 19.70833 11069.2 1501.315 129.1744
BE220: Prov.Limburg(Belgium) DMU12 231.4 22.9 11330.47 1793.637 78.81083 BG300:Severna iiztochna: (Bulgaria) DMU21 3.38 17.625 4635.338 6.40425 0.778167 CZ040: Severozápad (Czech Republic) DMU26 17.83333 16.53333 5211.362 732.2093 2.06575
DE120: Karlsruhe (Germany) DMU32 1020.62 30.03636 13967.55 2668.258 426.5713
DE220: Niederbayern
(Germany) DMU36 85.05 23.01818 12386.36 1211.976 153.2252
DEA100: Düsseldorf
(Germany) DMU53 406 25.38182 13174.88 1794.804 256.9131
DEA200: Köln (Germany) DMU54 823.84 29.17273 14616.49 1204.894 289.5086
DEB100: Koblenz (Germany) DMU58 131.02 25.7 12755.17 1535.592 153.2205
FR420: Alsace (France) DMU92 321.25 24.5 13546.41 1542.691 146.0978
HU230:
Dél-Dunántúl(Hungary) DMU111 20.5875 14.83 7167.35 14.47442 3.505417
HU330: Dél-Alföld(Hungary) DMU114 33.375 13.69 8208.527 41.45417 5.714833
ITC100: Piemonte (Italy) DMU115 380.8889 15.89167 13068.63 642.9922 112.8396
ITC400: Lombardia (Italy) DMU118 304.5667 18.35833 14324.75 604.9917 136.9808
ITF300: Campania (Italy) DMU120 129.9889 12.7 12133.52 62.95392 9.356417
LV00: Latvia DMU126 17.49167 21.75556 7067.748 9.18275 2.630417
PL300: RegionWschodni
(Poland) DMU143 12.7 15.32222 6242.075 9.022 0.828417
PT110: Norte (Portugal) DMU147 46.01111 10.14167 8407.392 24.85133 4.001917
PT1600: Centro(Portugal)) DMU148 70.01667 9.75 4905.98 18.95142 4.344667
RO200: Macroregiunea doi
29
Table A2 Fully efficient DMUs under VRS technology.
Regions average RD average HC average PATTPS average PATGPS AVERAGE PATENTS
AT330: Tirol (Austria) DMU08 581.925 19.70833 11069.2 1501.315 129.1744
BE220: Prov.Limburg(Belgium) DMU12 231.4 22.9 11330.47 1793.637 78.81083
BG300: Severna iiztochna (Bulgaria) DMU21 3.38 17.625 4635.338 6.40425 0.778167 CZ040: Severozápad (Czech Republic) DMU26 17.83333 16.53333 5211.362 732.2093 2.06575 DE120: Karlsruhe (Germany) DMU32 1020.62 30.03636 13967.55 2668.258 426.5713 DE220: Niederbayern (Germany) DMU36 85.05 23.01818 12386.36 1211.976 153.2252
DEB100: Koblenz (Germany) DMU58 131.02 25.7 12755.17 1535.592 153.2205
ITC100: Piemonte (Italy) DMU115 380.8889 15.89167 13068.63 642.9922 112.8396
ITF300: Campania (Italy) DMU120 129.9889 12.7 12133.52 62.95392 9.356417
PT110: Norte (Portugal) DMU147 46.01111 10.14167 8407.392 24.85133 4.001917 RO200: Macroregiunea doi (Romania) DMU149 3.833333 10.41111 4783.689 2.238917 0.235083
30
References
Acs, Z., Anselin, L., and Varga, A. (2002). Patents and innovation counts as measures of regional production of new knowledge. Research Policy, 31(7), 1069-1085.
Acs, Z., Audretsch, D., & Feldman, M. (1994). R&D spillovers and recipient firm size. The Review of Economics and Statistics, 76 (2), 336-340.
Anderson, T., Daim, T., and Lavoie, F. (2007). Measuring the efficiency of university technology transfer. Technovation, 27 (5), 306- 318.
Anselin, L.,Varga, A. and Acs, Z. (1997). Local geographic spillovers between university research and high technology innovations. Journal of Urban Economics, 42 (3), 422-448.
Arbuckle, J.L. (2006).Amos 7.0 User’s Guide. Chicago, IL: SPSS.
Autio, E. (1998). Evaluation of RTD in regional systems of innovation. European Planning Studies, 6(2), 131-140.
Audretsch, D., Dohse, D., and Niebuhr, A. (2010). Cultural diversity and entrepreneurship: A regional analysis for Germany. Annals of Regional Science, 45 (1), 55-85.
Berbegal-Mirabent, J., Lafuente, E., and Solé, F. (2013). The pursuit of knowledge transfer activities: An efficiency analysis of Spanish universities. Journal of Business Research, 66 (10), 2051 – 2059.
Bollen, K.A. (1989). Structural equations with latent variables. New York: Wiley-Interscience.
Bottazi, L., and Peri, G. (2003). Innovation and spillovers in regions: Evidence from European patent data. European Economic Review, 47(4), 687-710.
Buerger, M., Broekel, T. and Coad, A. (2012). Regional Dynamics of Innovation: Investigating the Co-evolution of Patents, Research and Development (R&D), and Employment. Regional Studies, 46 (5), 565–582, 2012
Caragliu, A., and Nijkamp, P. (2012). The impact of regional absorptive capacity on spatial knowledge spillovers: The Cohen and Levinthal model revisited. Applied Economics, 44(11), 1363-1374.
Chapple, W., Lockett, A., Siegel, D., and Wright, M. (2005). Assessing the relative performance of university technology transfer offices in the U.K.: Parametric and non-parametric evidence. Research Policy, 34(3), 369–384.
Cohen, W., and Levinthal, A. (1989). Innovation and Learning: The two faces of R&D. The Economic Journal, 99 (397), 569-596.
31
Cohen, W., and Levinthal, A. (1990). Absorptive capacity: A new perspective on learning and innovation. Administrative Science Quarterly, 35(1), 128-132.
Commission of Europe (2010). Regional Policy contributing to smart growth in Europe
2020.http://ec.europa.eu/regional_policy/sources/docoffic/official/communic/smart_g
rowth/comm2010_553_en.pdf#page=5&zoom=auto,-17,492.
Commission of Europe (2014). Six report on economic, social and territorial cohesion.
http://ec.europa.eu/regional_policy/sources/docoffic/official/reports/cohesion6/6cr_en .pdf
Criscuolo, P., Narula, R. (2002). A novel approach to national technological accumulation and absorptive capacity: Aggregating Cohen and Levinthal. Working paper, University of Oslo.
Doloreux, D. (2002). What we should know about regional systems of innovation. Technology in Society, 24(3), 243–263.
Edquist, C., Hommen, L. and McKelvey, M. (2001). Innovation and Employment: Product Versus Process Innovation, Cheltenham, Elgar.
Farrell, M. (1957). The measurement of productive efficiency. Journal of the Royal Statistical Society, 120(3), 253-290.
Feldman, M. (1999). The new economics of innovation, spillovers and agglomeration: A review of empirical studies knowledge complementarity and innovation. Economics of Innovation and New Technology, 8 (2), 5-25.
Feldman, M. and Audretch, D. (1999). Innovation in cities: Science-based diversity, specialization and localized competition. European Economic Review, 43 (2), 409-429.
Feldman, M. and Florida, R. (1994). The geographic sources of innovation: Technological infrastructure and product innovation in the United States. Annals of the Association of American Geographers, 84 (2), 210-229.
Freeman, C., Clark, J. and Soete, L. (1982). Unemployment and Technical Innovation, London Pinter.
Freeman, C. and Soete, L. (eds) (1987). Technical Change and Full Employment, Oxford, Basil Blackwell.
Freeman, C. and Soete, L. (1994). Work for All or Mass Unemployment? Computerised Technical Change into the Twenty-first Century, London-New York, Pinter.
32
Frenken, K. (2004). Entropy statistics and information theory. In H. Hanush and A.Pyka (eds.), The Elgar Companion to Neo-Schumpeterian economics. Cheltenham: Edward Elgar.
Fritsch, M. and Slavtchev, V. (2010). How does industry specialization affect the efficiency of regional innovation systems? The Annals of Regional Sciences, 45(1), 87–108.
Furman, J., Porter, M., and Stern, S. (2002). The determinants of national innovative capacity. Research Policy, 31 (6), 899-933.
Glaeser, E., Kallal, H., Scheinkman, J., & Shleifer, A. (1992). Growth in cities. The Journal of Political Economy, 100(6), 1126–1152.
Greenan, N. and Guellec, D. 2000. Technological Innovation and Employment Reallocation. Labour, 14 (4), 547-590.
Greunz, L. (2003). Geographically and technologically mediated knowledge spillovers between European regions. The Annals of Regional Science, 37(4), 657– 680.
Greunz, L. (2004). Industrial structure and innovation-evidence from European regions. Journal of Evolutionary Economics, 14(5), 563–592.
Griliches, Z. (1979). Issues in assessing the contribution of research and development to productivity growth. Bell Journal of Economics, 10(1), 92–116.
Griliches, Z. (1984). R&D, Patents and Productivity.London and Chicago: University of Chicago Press.
Griliches, Z. (1990). Patent statistics as economic indicators: A survey. Journal of Economic Literature, 28(4), 1661–1797.
Grossman, G. and Helpman, E. (1991). Innovation and growth in the global economy. MIT Press, Cambridge, MA.
Guellec, D., and Pottelsberghe de la Potterie, B. (2004). From R&D to productivity growth: Do the institutional settings and the source of founds of R&D matter? Oxford Bulletin of Economics and Statistics, 66(3), 0305–9049.
Hall, B., Lotti, F. and Mairesse, J. (2008). Employment, innovation, and productivity: evidence from Italian microdata. Industrial and Corporate Change, 17(4), 813-839. Hausmann, R., andRodrik, D. (2003). Economic development as self-discovery. Journal of Development Economics, 72(2), 603–633.
Henderson, V. (1997). Medium size cities. Regional Science and Urban Economics, 27(6), 583–612.
33
Jacobs, J. (1969). The economy of cities. New York: Vintage.
Jaffe, A. (1986). Technological opportunity and spillovers of R&D: Evidence from firm’s patents, profits and market value. The American Economic Review, 76(5), 984–999.
Jaffe, A. (1988). Demand and supply influences in R&D intensity and productivity growth. The Review of Economics and Statistics, 70(3), 431–437.
Jaffe, A. (1989). Real effects of academic research. The American Economic Review, 79(5), 957–970.
Jöreskog, K.G. (1994). On the Estimation of Polychoric Correlations and their Asymptotic Covariance Matrix. Psychomatrika, 59, 381-389.
Jöreskog, K.G. and Sörbom, D. (1989).Lisrel 7: A guide to the program and applications. Chicago: SPSS.
Kalapouti, K., and Varsakelis, N. (2015). Intra and Inter: regional knowledge spillovers in European Union.The Journal of Technology Transfer, 40 (5), 760-781. Kim, J., and Lee, H. (2004). Embodied and disembodied international spillovers of R&D in OECD manufacturing industries. Technovation, 24 (4), 359 – 368.
Kumar, U., Kumar, V., and Kapur, J. N. (1986). Normalized measures of entropy. International Journal ofGeneral Systems, 12(1), 55–69.
Marshall, A. (1890). Principles of economics. London: Macmillan.
Maurseth, P., and Verspagen, B. (2002). Knowledge spillovers in Europe: A patent citations analysis. The Scandinavian Journal of Economics, 104(4), 531–545.
Mccann, P., Ortega-Argile´s, R. (2013). Smart specialization, regional growth and applications to European Union Cohesion Policy. Regional Studies. doi:10.1080/00343404.2013.799769.
Moreno, R., Paci, R., andUsai, S. (2005). Spatial spillovers and innovation activity in European regions. Environment and Planning A, 37(10), 1793–1812.
Moreno, R., Paci, R., andUsai, S. (2006). Innovation clusters in the European regions. European Planning Studies, 14(9), 1235–1263.
Ouwersloot, H., and Rietveld, P. (2000). The geography of R&D: Tobit analysis and a Bayesian approach to mapping R&D activities in the Netherlands. Environment and Planning A, 32(9), 1673–1688.
34
Paci, R. and Usai, S. (2000). Technological enclaves and industrial districts: an analysis of the regional distribution of innovative activity in Europe. Regional Studies, 34 (2), 97-114.
Perez, M. and Sanchez, A. (2003). The development of university spin-offs: early dynamics of technology transfer and networking. Technovation, 23 (10), 823- 831. Porter, M. (2003). The economic performance of regions. Regional studies, 37(6-7), 549-578.
Rodriguez-Pose, A. and Crescenzi, R. (2008). Research and development, spillovers, innovation systems, and the genesis of regional growth in Europe. Regional Studies, 42 (1), 51–67.
Rogers, E., Takegami, S., and Yin, J. (2001). Lessons learned about technology transfer. Technovation, 21 (4), 253-261.
Romer, P. (1986). Increasing returns and long- run growth. Journal of Political Economy, 94 (5), pp. 1002-1037.
Romer, P. (1990). Endogenous technological change. Journal of Political Economy, 98 (5), 71-102.
Schmookler, J. (1966). Invention and economic growth. Cambridge, Mass: Harvard University Press.
Schmookler, J. (1972). Patents, invention and economic change:Data and selected essays.Cambridge, Mass: Harvard University Press.
Siegel, D., Waldman, D., and Link, A. (2003). Assessing the impact of organizational practices on the productivity of university technology transfer offices: An exploratory study. Research Policy, 32(1), 27–48.
Storper, M. (1997). The regional world. New York: The Guilford Press.
Studio, R. (2012). RStudio: Integrated development environment for R. Boston, MA: RStudio Inc.
Tappeiner, G., Hauser, C., andWalde, J. (2008). Regional knowledge spillovers: Fact or artifact? Research Policy, 37(5), 861–874.
Thursby, J., Kemp, S. (2002). Growth and productive efficiency of university intellectual property licensing. Research Policy, 31 (1), 109–124.
Thursby, J., Thursby, M. (2002). Who is selling the Ivory Tower? Sources of growth in university licensing. Management Science 48 (1), 90–104.
Uyarra, E. (2010). What is evolutionary about ‘regional systems of innovation? Implications for regional policy. Journal of Evolutionary Economics, 20(1), 115-137.
35
Van Oort, F. (2002). Innovation and agglomeration economies in the Netherlands. Journal of Economic and Social Geography, 93(3), 344–360.
Vivarelli, M. and Pianta, M. (2000). The Employment Impact of Innovation. Evidence and Policy (eds.). London, Routledge.