DISCUSSION
PAPER
/ / M A X I M I L I A N B A C H A N D S T E P H A N S I E V E R T
/ / N O . 2 0 - 0 5 3 | 1 0 / 2 0 2 0
Birth Cohort Size Variation
and the Estimation of Class
Size Effects
Birth Cohort Size Variation and the Estimation of
Class Size Effects
∗
Maximilian Bach
†Stephan Sievert
‡October 2020
Abstract
We show that in school systems with grade retention or redshirting, birth cohort size is negatively related to the grade-level share of students who are too old for their grade. This compositional effect gives rise to an upward bias in estimates of class size effects based on commonly used research designs exploiting within-school variation in birth cohort size. Using data for all primary schools in one federal state of Germany, we find support for this compositional effect. Correcting for the resulting bias, we find that not only are smaller classes beneficial for test scores, but also for reducing grade repetitions.
Keywords: Class size effects; Quasi-experimental evidence; Student achievement; Primary school
JEL Codes: I20, I21, I29
∗We benefited from helpful discussions with Edwin Leuven, Helena Holmlund, Jan Nimczik, Bernd Fitzenberger, Jan Marcus, Felix Weinhardt, C. Katharina Spieß, Mathias Hübener, Jochen Pröbsting, Sophia Schmitz, Julia Schmieder, Jan Berkes, Friedhelm Pfeiffer, as well as with the audiences at ZEW Berlin, DIW Berlin, Hertie School of Governance, HU Berlin, and the conferences BIEN and IWAEE. This paper uses data from the National Educational Panel Study (NEPS): Starting Cohort Kindergarten, doi:10.5157/NEPS:SC2:6.0.1. From 2008 to 2013, NEPS data was collected as part of the Framework Program for the Promotion of Empirical Educational Research funded by the German Federal Ministry of Education and Research (BMBF). As of 2014, NEPS is carried out by the Leibniz Institute for Educational Trajectories (LIfBi) at the University of Bamberg in cooperation with a nationwide network. We also thank Friedhelm Münch und Christoph Paulus for providing a subset of the data.
†Corresponding author. ZEW Mannheim & DIW Berlin. Email: [email protected] ‡DIW Berlin. Email: [email protected]
1
Introduction
Class size is one of the most important determinants of the costs of education as teachers’ salaries account for the bulk of educational expenditures in public education in most countries (OECD, 2019). At the same time, the empirical literature on class size effects is contentious and does not offer clear guidance as to what are the effects on student outcomes that class size changes entail. To identify these effects, a large part of the quasi-experimental literature exploits within-school variation in cohort size over time (see, e.g. Hoxby, 2000; Leuven et al., 2008; Cho et al., 2012). These studies mostly find small or no class size effects, which contrasts with the available experimental evidence showing substantial class size effects (see, e.g. Krueger, 1999; Krueger and Whitmore, 2001).1
This paper offers a potential explanation for this apparent puzzle. In school systems that allow students with insufficient academic skills to be held back a grade, we can show that class size estimates based on within-school variation in cohort size are upward biased because of a mechanical relationship between the initial size of a cohort and the student composition in higher grades. This bias has been ignored to date and helps to explain why studies using within-school variation in cohort size generally find less negative class size effects than experimental studies.2
Part one of this paper clarifies what within-school estimates based on cohort size variation identify in school systems that allow low-ability students to be held back a grade either through grade retention or redshirting (i.e., late primary school enrollment). First, we show theoretically that, within schools, birth cohort size is negatively related to the grade-level share of students who have been held back in the past even in the absence of causal class size effects. Intuitively, in larger cohorts retained students from the previous (smaller) cohort mechanically make up a smaller share of students in the given (larger) cohort. This negative association causes a positive relationship between birth cohort 1Of course, one explanation for these differences in findings is that class size effects are likely
context-specific. However, the sheer number of studies from vastly different countries based on the within-school between-cohort design that fail to detect class size effects of similar magnitude as the available experimental evidence points against this explanation (see Table E.1).
size and average test scores at the grade-level because students held back in the past are negatively selected. A spurious positive class size effect ensues since cohort size is positively related to class size, which leads to an upward bias in class size estimates based on within-school variation in cohort size. In instrumental variables terminology, this is a violation of the exclusion restriction of birth cohort size as an instrument. This spurious effect is similar to the bias identified by Ciccone and Garcia-Fontes (2014) for studies that exploit within-school variation in the gender composition of cohorts to estimate gender peer effects. Since grade retention and redshirting are common practices in most countries,3 our theoretical results have important implications for the majority of studies
based on the within-school design.
We further propose a simple solution to this problem that is motivated by the following observation. The source of the upward bias is the negative relationship between cohort size and the share of negatively selected students in higher grades. Simply adjusting the test scores of those negatively selected students eliminates this link and produces estimates free of the resulting bias. Correcting can, therefore, be achieved by simply controlling for whether or not a student has previously been held back a grade.
In part two, we test our theoretical predictions empirically using administrative school-and student-level data from the German state of Saarlschool-and. Consistent with our predic-tions, we show that birth cohort size is systematically related to the composition of students at the grade-level. Students from larger cohorts are enrolled in classes with a significantly smaller share of students who have been redshirted or retained in the past. Importantly, we can show that these compositional effects do not exist at the birth co-hort level. For example, students who are born into larger birth coco-horts are not more or less likely to be enrolled late. This is consistent with a purely mechanical effect driv-ing the observed relationship between birth cohort size and student composition at the grade-level.
Our empirical results allow us to quantify the expected bias in class size estimates from within-school designs that rely on birth cohort variation. The results imply that 3For example, the United States and 88 percent of European Union countries permit grade retention
the bias can be expected to decrease estimates of a one-student-reduction in class size between grades 1 to 3 on test scores in grade 3 by about 0.74 to 0.94 percent of a standard deviation. The magnitude of this bias is considerable and can be shown to increase even further in settings with higher rates of retention and redshirting or settings with larger test score differences between non-retained and retained students as well as when test scores in higher grades are used as outcome variables. Since the share of retained students in German primary schools is at 7.7 percent similar to the OECD average of 7 percent (OECD, 2011; Ikeda and Garcia, 2014), we expect our results to be generalizable to other countries.4 This insight recommends caution in the application and interpretation of
within-school designs based on idiosyncratic variation in cohort size in school systems that allow for redshirting or grade retention.
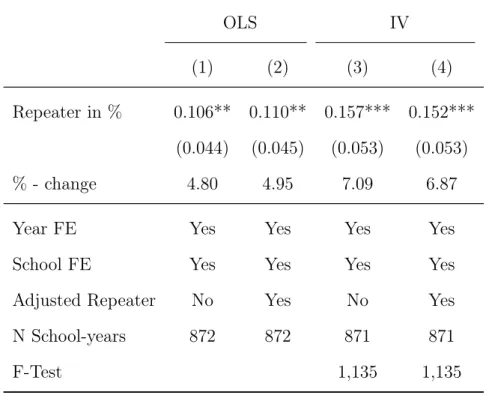
Based on these considerations, we estimate class size effects with data that cover four full cohorts of students in Saarland who participated in state-wide centralized exams in language and math at the end of grade 3 merged with administrative data on enrollment in grade 1. As an instrument for class size in grade 3, we use within-school variation in predicted class size based on changes in initial cohort size. In line with our theoretical results, adding a proxy for whether or not a student has been redshirted or retained in the past leads to a substantial increase in effect size. Overall, we find that a one-student decrease in class size in grades 1 to 3 improves language and math test scores at the end of grade 3 by around 1.9 and 1.4 percent of a standard deviation, respectively. We interpret these estimates as lower bounds on the true effect sizes. Our study provides the first causal evidence of significant class size effects on test scores in Germany.5 The beneficial impact of smaller classes is also supported by our finding that retention rates drop by 0.15 percentage points (7 percent) if the number of students in a class is reduced by one.
4Unfortunately, official statistics on redshirting are not available for most countries.
5Previous quasi-experimental studies for Germany cannot conclude that smaller classes improve
student achievement. Wößmann (2005) is the only study for Germany that analyzes the effect of class size on test scores but the standard errors are too large to be able to detect our average effects at the 95 percent level of statistical confidence. Argaw and Puhani (2018) study the relationship between class size and recommendations for track choice in secondary school and actual track attendance as well as grade repetitions in another German state (Hesse). They find no or small effects on tracking, but a higher likelihood of repeating a grade in larger classes.
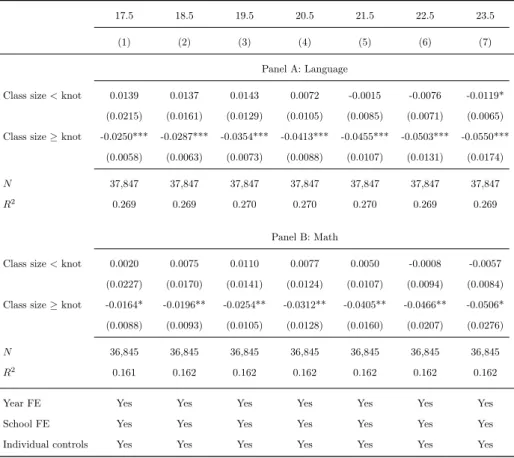
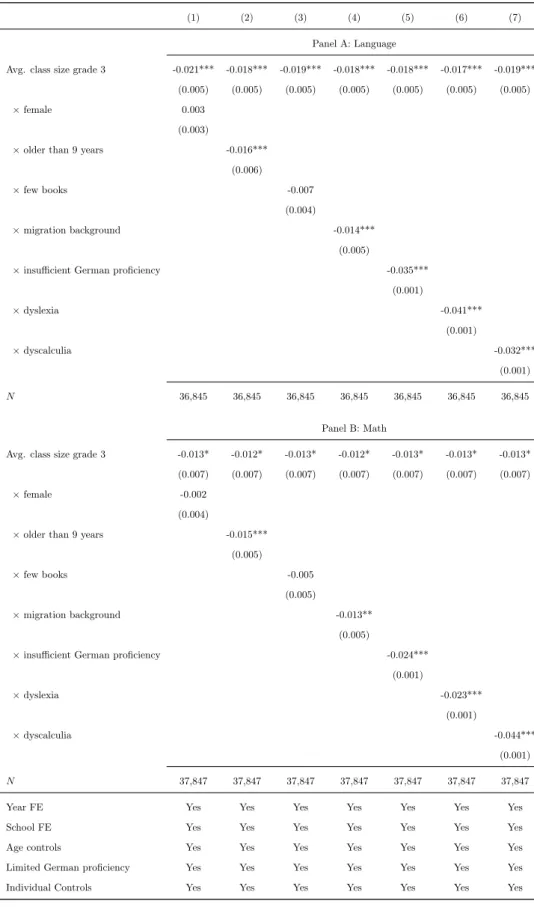
However, these average effects mask a significant degree of heterogeneity. We find class size effects to be non-linear, with large effects in larger and no effects in smaller classes. A one-student-reduction in size in classes with more than 20.5 students (which is close to the average class size in our data) is predicted to improve language and math test scores by 4.8 and 3.8 percent of a standard deviation. At the same time, we uncover no evidence that class size reductions improve student outcomes in classes smaller than 20.5 students. Moreover, in line with Krueger (1999) our results suggest that disadvantaged students benefit the most from attending smaller classes: For example, test scores of students with insufficient German proficiency or a learning disorder are predicted to increase, on average, by around 5.3 to 5.8 percent of a standard deviation in language and 3.7 to 5.7 percent of a standard deviation in math for a one-student-decrease in class size. Overall, these effects are large and similar in magnitude to those from the randomized experiment Project STAR.
These heterogeneous patterns have important policy implications. The larger benefits of smaller classes for disadvantaged children warrant the use of progressive maximum class size rules. These rules prescribe smaller maximum class sizes as the share of disadvantaged children in a grade increases. Saarland is one of several German states that practices these flexible rules. Furthermore, class size reductions to increase student achievement only seem to be efficacious in larger classes. Hence, if anything, class size reductions should be targeted at larger classes. Indeed, the finding of no beneficial effects of smaller classes in small classes indicates that class size may be increased up to a certain size without negative consequences for student achievement.
Going back to our theoretical results, we expect that our simple solution to correct for the upward bias in within-school estimates provides an opportunity for researchers to re-visit this empirical strategy to further investigate class size effects in other contexts. This is important since within-school designs provide a number of advantages over commonly applied “Maimonides”-style research designs that exploit variation in class size generated by maximum class size rules as pioneered by Angrist and Lavy (1999) and subsequently
used in numerous studies to investigate the effects of class size.6 First, the within-school design is widely applicable and allows for studying class size effects even if no class size rules exist or when the correct class size threshold cannot easily be identified, because different thresholds are in place that depend on characteristics unobservable to the re-searcher.7 Second, regression discontinuity designs (RDD) can yield biased estimates
in some contexts where carefully implemented within-school designs may not.8 Gilraine (2020), for example, shows that crossing the class size threshold in New York City often prompts the hiring of a teacher of below-average quality. The resulting discontinuity in teacher quality substantially biases RDD class size estimates upwards. Moreover, our finding that grade retention rates increase with class size could result in a discontinuous change in the student composition at the class size threshold, which is also likely to bias RDD estimates of class size effects. Third, within-school designs allow the estimation of heterogeneous class size effects along the full range of the class size distribution. The advantage of this flexibility is the ability to detect the type of non-linear class size effects we find in our data, which is missed in RDDs.
The rest of the paper is organized as follows: Section 2 reviews the related literature. Section 3 discusses the sources of bias and its implications for previously used research designs. Section 4 sets out the institutional background for our empirical part. Section 5 presents our estimation strategy. Section 6 describes the data used in our analysis. Estimates are presented and interpreted in section 7, with conclusions drawn in section 8.
6This regression discontinuity approach is used to study the effects of class size by Hoxby (2000)
in the United States, Dobbelsteen et al. (2002) in the Netherlands, Browning and Heinesen (2007), Krassel and Heinesen (2014) and Nandrup (2016) in Denmark, Bressoux et al. (2009) and Piketty and Valdenaire (2006) in France, Asadullah (2005) in Bangladesh, Wößmann (2005) in 10 European countries, Jakubowski and Sakowski (2006) in Poland, Urquiola (2006) in Bolivia, Angrist et al. (2017) in Italy, Falch et al. (2017) and Leuven and Oosterbeek (2018) in Norway, and Argaw and Puhani (2018) in Germany.
7In our empirical application, for example, the class size threshold depends on the number of students
with insufficient German proficiency in first grade. Since we have no information on students’ German proficiency in first grade, we cannot assign the correct class size thresholds.
2
Literature review
While the study of class size effects dates back at least to the early 1920s (Stevenson, 1922), we will focus here on more recent experimental and quasi-experimental attempts to identify causal class size effects.9 The methods applied in these studies can be broadly
classified into three categories. The first is randomized experiments. Tennessee’s Student Teacher Achievement Ratio Project—“Project STAR”, as it is known—is the largest and most influential class size experiment ever conducted. Primary school students were randomly assigned to classes of different sizes during kindergarten and the first three years of schooling. Krueger (1999) provides a careful analysis of this project and finds a significant negative effect of class size on achievement. Students assigned to small classes performed five to seven percentile points (0.20-0.28 SD) better than students assigned to regular classes, which had on average about seven more students. Project STAR seems to have had long-run effects reaching well into adolescence and young adulthood as shown by a higher likelihood of graduating from high school and enrolling in college as well as higher labor market earnings (e.g. Krueger and Whitmore, 2001; Finn et al., 2005; Chetty et al., 2011). Molnar et al. (1999) provide more experimental evidence of class size effects by evaluating the Wisconsin SAGE program which was considerably smaller than Project STAR. They find class size effects of similar magnitude to those from Project STAR.
A second common strategy to identify class size effects, hereinafter referred to as the within-school design, was first introduced by Hoxby (2000). The underlying idea of this approach is to leverage variation in class size arising from random fluctuations in cohort size that occur within a particular school (or school district) over time. Hoxby (2000) uses school-district-level data from Connecticut.10 As an instrument for the average class
size a cohort from a specific district has experienced up until the time of the test (which is either in 4th or 6th grade), Hoxby uses the number of five-year-old children in each school 9Rockoff (2009) reviews the early pre-1940 literature. See Hanushek (1986, 1989, 1996, 1998) for
summaries of the literature from the 1950s to the 1990s and Krueger (2003) for a reassessment of that literature.
10Using school-district-level instead of school-level data allows to rule out biases resulting from
time-variant selection of students into different schools within a school district, with the limitation that the identifying variation is substantially reduced.
district from the year that a particular cohort should have been enrolled in kindergarten according to the school entry rule. To isolate natural randomness in birth cohort sizes from any secular trends, she controls for flexible school-district trends using 24 years of birth cohort data.11 Her results indicate no class size effects and rule out effect sizes as
small as 0.04 SD for a 10-percent-reduction in class size.12 The same approach has been
used to study class size effects in Norway and Minnesota by Leuven et al. (2008) and Cho et al. (2012), respectively. While Cho et al. (2012) find small significant effects, Leuven et al. (2008) find no effects.
The type of data required for this approach, namely a long panel of demographic data merged with test score data, are often not available to researchers. Instead, many studies use slight variants of Hoxby’s approach and regress student test scores directly on the school’s average class size in the grade at the time of the test while controlling for school fixed effects.13 We have listed all within-school studies that we could find and
broken them down along a number of dimensions in Table E.1. All studies use data from school systems that allow either for grade retention or redshirting of students.14 While differences in grades covered, the aggregation level of data, and other factors cloud comparisons of the magnitude of class size effects across these studies, none of the listed within-school design studies find effect sizes as large as those from Project STAR.15 In
fact, of the 11 papers summarized, four find no significant class size effects and one even finds significant beneficial effects of larger classes. The main identifying assumption under which estimates of these studies have a causal interpretation is that the within-11Hoxby is also careful to distinguish between cases where the population variation triggers the opening
or closing of a class (through a maximum class size rule), and where it only causes variation in class size without opening or closing a class. This can be achieved by including fixed effects for each school-expected-number-of-classes combination.
12Hoxby (2000) uses the natural log of class size as an explanatory variable. Hence, her estimates
measure the effect of a proportionate change in class size.
13Some studies instrument actual class size with the average class size in that grade and year if the
data do not include all classes from a school in a given grade.
14However, not all school systems in these analyses allow for both redshirting and grade retention.
Denny and Oppedisano (2013), for example, investigate class size effects with PISA data from the United States and the United Kingdom. Whereas grade retention and redshirting is very rare in the United Kingdom, it is relatively common in the United States.
15As is well known, effect sizes tend to be inflated with the level of aggregation. For example, effects
sizes with district-level data are measured in the standard deviation of test scores by school-district-year, which is, of course, smaller than the standard deviation of individual student test scores.
school variation in cohort size is not related to any determinants of student achievement other than class size. However, even if this assumption holds true, class size estimates may suffer from a bias if the school system allows for academically weak students to be held back.
The third popular strategy to identify class size effects exploits maximum class size rules in a regression discontinuity design. This approach was first used by Angrist and Lavy (1999) and Hoxby (2000) and has since been applied in various studies spanning many countries. Gilraine (2020) and Leuven and Oosterbeek (2018) provide summaries of those papers. Gilraine (2020) reports that only three out of the 14 papers he summarizes find effect sizes qualitatively similar to those from Project STAR. The majority of papers cannot conclude that class size affects student achievement. As some studies have pointed out, however, depending on the institutional context, RDD estimates of class size effects may be prone to substantial biases. Bias may be introduced if school principals are able to manipulate enrollment around the maximum class size cutoffs or if crossing a cutoff leads to the hiring of a lower quality teacher (Urquiola and Verhoogen, 2009; Cohen-Zada et al., 2013; Gilraine, 2020). Our paper points out yet another potential source of bias that arises if class size affects retention rates and thereby the composition of classes with enrollment just below and above the maximum class size cutoffs. These findings cast doubt on the validity of the identifying assumptions in some of the RDD studies on class size effects.
3
The spurious relationship between birth cohort size
and student composition at the grade level
3.1
Theoretical predictions and intuition
In this section, we discuss a previously overlooked spurious relationship between cohort size and the grade-level composition of students within schools that arises if there is
selective grade progression due, for example, to grade retention.16 In what follows, we only discuss the main intuition underlying the spurious relationship and invite interested readers to consult Appendix A for a technical discussion and derivations of the main results in a more general set-up.
Consider a school with only one class per grade.17 Each yearta new birth cohort enters
grade 1. Students from each birth cohort with skills above a fixed retention threshold proceed to the next grade after one year, while those with skills below the threshold are retained in the current grade for another year. To fix ideas, we further assume that the composition of birth cohorts in terms of students’ abilities is the same across years and that there is no class size effect—that is, students from larger birth cohorts are not more likely to be retained. This implies that the share of students retained in each birth cohort is constant across years. This simple setting allows us to derive two general empirical predictions:
Prediction 1: Within schools, there is a negative correlation between the size of a birth cohort and the grade-level share of students who have previously been held back once the birth cohort is scheduled to reach this grade.
Prediction 2: Within schools, there is a positive correlation between the size of a birth cohort and students’ average skills at the grade-level once the birth cohort is scheduled to reach this grade, if previously retained students have lower skills than non-retained students.
The intuition for Prediction 1 is as follows. Assume a generally constant birth cohort size across years but an increase in the size of the birth cohort which enters grade 1 in year t. This has two effects: First, due to the increase in enrollment in grade 1 in year t, more non-retained students reach grade 2 in yeart+ 1. Hence, retained students from the preceding cohort (the birth cohort that enters grade 1 in year t−1) make up a smaller share of the students in grade 2 in year t+ 1 relative to other years. Second, due to the 16We focus the discussion here on grade retention and discuss the implications of other forms of
selective grade progressions, such as redshirting or early school enrollment, in the appendix.
17By assuming that there is only one class, we abstract from maximum class size rules which make
increase in enrollment in grade 1 in year t, there are also more students who are retained in grade 1 at the end of year t. These additionally retained students proceed to grade 2 a year later in year t+ 2, thereby increasing the share of previously retained students among all students in grade 2 in year t+ 2 relative to year t+ 1.
Together, these two effects imply that a positive shock to the size of the birth cohort that enters grade 1 in year t is mechanically associated with a reduction in the share of previously retained students in grade 2 in yeart+ 1 relative to yeartand yeart+ 2. The within-school covariance between the birth cohort size and the grade 2 share of previously retained students sums up these two effects, leading to Prediction 1.
Prediction 2 follows directly from Prediction 1 as a lower share of previously retained students increases average student skills at the grade-level if previously retained students have lower skills than non-retained students, as is typically the case.18
Importantly, Prediction 2 implies a violation of the exclusion restriction for the in-strumental variable estimator based on within-school variation in birth cohort size as a source of exogenous variation. Since we have so far abstracted from any causal effects of class size on student achievement, Prediction 2 amounts to a spurious relationship between birth cohort size (the instrument) and test scores (the outcome) independent of the treatment (class size).
Following analogous arguments to those above, it is easy to see that Prediction 1 also applies to other two forms of selective grade progression. For example, in school systems with redshirting, there will be a negative correlation between the size of a birth cohort and the grade-level share of students who should have been enrolled in grade 1 in the previous year. The sign of the resulting relationship between birth cohort size and students’ average skills at the grade-level (Prediction 2) depends in that case on whether redshirted students have, on average, lower or higher skills than students who were enrolled on time.19
18Ciccone and Garcia-Fontes (2014) identify a similar bias in the analysis of gender peer effects where
shocks to the initial gender composition of cohorts translate into positive peer effects even in the absence of true peer effects in within-school comparisons.
3.2
Implications for within-school designs
Based on the intuition for the relationship between birth cohort size and students’ skills at the grade-level, we now turn to a discussion of what parameters within-school designs identify if there are causal class size effects. To do this, we extend the set-up from the previous section to a more general model, which we only sketch briefly here.20 We assume that students spend the first L school years in lower grades (LG). At the end of the Lth year in primary school, students move to higher grade (HG) if their academic skills are higher than their school’s academic threshold for grade retention. Students with skills below the threshold spend another year in LG and move to HG one year later. Let πLG andπHGdenote the causal effect of class size on students’ skills in lower and higher grade, respectively. The sumπLG+πHG captures the combined effect of class size in LG and HG on accumulated academic skills. This is our main parameter of interest, which we will refer to as the “pure class size effect.” We also allow for random variation in birth cohort size, ability levels of birth cohorts, and grade retention thresholds, and again assume that there is only one class per grade so that class size is always equal to the number of students in a grade.
3.2.1 Instrumental variable (IV) approach
The commonly used instrumental variable approach estimates class size effects by re-gressing individual test performance in HG in yeart on school fixed effects and class size in HG in yeart while instrumenting class size by the size of the birth cohort that entered school in yeart−L.21 In the appendix, we show that in this set-up, where shocks to the
birth cohort size are completely independent from shocks to academic skills and grade retention thresholds (i.e., under random assignment of the instrument), the IV estimator 20Our model is similar to that by Ciccone and Garcia-Fontes (2014). See Appendix A for a more
detailed discussion of the model set-up.
21Most studies do not directly use cohort size as an instrument. Instead, they regress cohort size on
higher polynomials of time separately for each school catchment area (or school district). The residuals from these regressions are then used as an instrument for class size. Thereby, differences in cohort size stemming from smooth variations over time are removed. Our findings carry over to these approaches. Additionally, the number of classes is held constant so that increases in cohort size are always associated with larger classes. This ensures that the monotonicity assumption of the instrumental variable approach is not violated.
identifies
βIV = (E[test|non−retained]−E[test|retained])ρIV
| {z }
grade retention bias I
+ ξIV
|{z}
attenuation factor
πLG+πHG (1)
where the first difference in brackets is the average test score difference in HG between non-retained students and students retained in LG and the factor ρIV captures the posi-tive association between the share of non-retained students and birth cohort size at the grade level (see Prediction 1). The product of these two terms causes an upward bias in IV estimates of class size effects, if previously retained students have lower average academic skills than non-retained students (as in our data).
The factor ξIV can be shown to only take on values well below one, which implies an attenuation bias for the class size effect in LG, πLG. This is similar to the standard classical attenuation bias because our explanatory variable, class size in HG, is a noisy measure of class size in LG for two reasons: First, class size in HG is not perfectly correlated with class size in LG because retained students change the size of the same class between grades. Second, the observed class size in HG for students who are retained in LG should be at most weakly correlated with the class size these students experience in LG.22The importance of this attenuation bias has previously been pointed out by Jepsen
and Rivkin (2009).
These two sources of bias imply that even if initial cohort size is unrelated to academic skills and grade retention thresholds, the net effect of the bias will likely be upwards, i.e. reduce the estimated size of the negative class size effect. In the appendix, we further show that this bias increases with the retention rate. A natural solution for the first bias is to control for the effect of grade retention on academic achievement at the individual level.23 In the appendix, we prove that by conditioning on whether a student has been
22Although we do not model this explicitly, it is easy to see that students switching schools will
exacerbate both sources of attenuation bias. Students switching schools will increase the differences in the size of the same class between lower and higher grades, thereby reducing the correlation between class size in LG and HG. At the same time, if students change schools and join a new class in HG, the size of that class is an erroneous measure of class size in their previous class at a different school.
23Ciccone and Garcia-Fontes (2014) show a similar result for the case of peer effects contaminated by
retained the IV estimator identifies
βIVREA=ξIVπLG+πHG (2) where REA stands for retention-effect adjusted. To get an intuition for this result, re-call that the grade retention bias in (1) results from the positive correlation between cohort size and the share of non-retained students in HG, and the fact that non-retained students typically have higher average academic skills than retained students. However, conditioning on grade retention removes any correlations in test scores that are solely driven by differences in the share of retained students as long as the difference in skills between retained and non-retained students is not correlated with shocks to the birth cohort size. However, while conditioning on grade retention removes the positive grade retention bias, it does not resolve the attenuation of the class size effect in lower grades. The resulting estimator in (2) thus yields a lower bound on the true class size effect.
3.2.2 OLS approach
Instrumental variable estimates are generally less precise than OLS estimates, which reduces their power to detect class size effects. In addition, oftentimes it is not possible to match birth cohort size information to student test score data. Several studies in Table E.1 thus regress test scores directly on observed class size in HG conditional on school fixed effects since this places a substantially lower demand on the data relative to the IV approach. In the appendix, we show that in our set-up this estimator identifes
βOLS = (E[test|non−retained]−E[test|retained])ρOLS
| {z }
grade retention bias I
+ ιOLS
| {z }
grade retention bias II
+ ξOLS
| {z }
attenuation factor
πLG+πHG
(3)
Here we have three sources of bias. The first bias results from the correlation between birth cohort size and the share of grade repeaters in HG, similar to the grade retention bias for the IV estimator in (1). This compositional effect also biases OLS estimates since initial birth cohort size is strongly related to eventual enrollment in HG. However, ρOLS
can be expected to be smaller than ρIV because previously retained students increase en-rollment in the year that they are observed in HG (but they do not increase initial cohort size). This offsets part of the positive grade retention bias, ρIV, for the IV estimator.
The second bias, ιOLS, results from variation in ability levels and grade retention thresholds across birth cohorts.24 These two sources of variation affect both class size
(through their effects on grade retention) and test scores in HG. To see why this bi-ases within-school OLS estimates, consider a positive shock that shifts the entire ability distribution of one birth cohort. Holding birth cohort size constant, this positive shock raises class size in HG as fewer students from this cohort are retained. At the same time, non-retained students from this cohort have higher skills in HG compared to non-retained students in other years. As a result, variation in ability across cohorts causes a spurious positive relationship between test scores and class size in HG. Similar arguments show that variation in grade retention thresholds has the opposite effect. The sign of ιOLS therefore depends on the relative magnitude of these two sources of variation. Since this is unobserved, it is impossible to tell what the net effect of the bias on βOLS will be. However, comparing IV and OLS estimates could give us a sense of the direction and magnitude of this bias.
The third bias is again caused by measurement error as class size in HG is not perfectly correlated with class size in LG. The attenuation factor ξOLS for the class size effect in LG also differs slightly from its IV counterpart, but can still be shown to take on values strictly below one.
Analogous to the IV case, controlling for grade retention at the individual level re-moves the first bias
βOLSREA=ιOLS +ξOLSπLG+πHG (4) However, the second bias, ιOLS, does not disappear. This is because it results from shocks that also cause ability levels of retained and non-retained students to deviate 24IV estimates do not suffer from this second bias as long as initial ability levels and grade retention
from their respective average values. Moreover, estimates will still be attenuated due to
ξOLS. Albeit more susceptible to bias, this OLS estimator should be more efficient than the IV approach based on birth cohort size.
The above results are easily extended to school systems that allow for redshirting or early school enrollment. We explore these extensions more fully in Appendix A.3.
4
Institutional context
To demonstrate the bias in within-school designs for the estimation of class size effects and our solution, we focus our empirical analysis on one German federal state (Saarland), for which we have detailed student test score data for multiple years of all third-graders. Generally, all federal states in Germany run their own educational systems, but states agree on some common standards so that many features are shared across states. This is especially true for primary education. As a result, most characteristics of primary schooling in Saarland are similar to all other German federal states. Primary school in Saarland is obligatory, free of charge and spans grades 1-4. School entry is determined by a cut-off date set at June 30th. Children turning six before this cut-off start school at the beginning of the same school year. Children born after the cut-off are enrolled in the next school year. However, children may be sent to school in the year before or after they become eligible depending on their maturity.25 There is no explicit ability tracking in primary school.26 Furthermore, it is not possible to fail one of the first two
grades in Saarland. However, children may be retained in these grades with their parents’ approval—an option that is routinely resorted to. In fact, the retention rates in primary schools in Saarland are highest in grades 1 and 2 (German Federal Statistical Office, 25Early school entry is possible upon parental request subject to the school principal’s agreement.
Principals base their assessment on the results of a medical- and in some cases a psychological examination of the child as well as a talk with the parents. Equally, principals may decide to defer school entry for another year. For this to happen, a number of requirements must be fulfilled. First, the results of the obligatory diagnostic language tests in the year before regular school entry have to be unsatisfactory. As a result, parents would usually be advised to send their child to a special preparatory course in the following year. Only if this course does not bring about the desired improvement or if parents fail to follow the advice altogether, principals may reject applications for regular school entry (Lisker, 2010).
26While Germany is known for early ability tracking, this happens only when students leave primary
school after fourth grade and enroll at one of three different secondary schooling tracks (Gymnasium, Realschule or Hauptschule).
2010).
Allocation of children to primary schools is determined by place of residence with little choice for parents since primary schools have well-defined catchment areas that generally do not overlap. Only a handful of all-day schools have catchment areas that overlap with those of other schools (Ministerium für Bildung und Kultur, 2018). However, parents who are not satisfied with their assigned school have two options to change schools. First, they may send their child to a private school. In practice, however, very few parents resort to this option: Private primary schools are rare in Germany. In 2006, there were only 624 of these schools which accounted for 3.7 percent of all primary schools in Germany (Autorengruppe Bildungsberichterstattung, 2016). Almost all of these schools were boarding schools, religious schools or schools offering specialized pedagogic approaches, like Waldorf education (Cortina et al., 2008). The second option, sending the child to a different public school, is only possible under certain conditions; for example, if a different school offers full-day care while the local school does not. Reasons pertaining to comfort or preference alone are generally not deemed sufficient to switch schools. Ultimately, school principals have to decide whether or not a claim is well-founded and, consequently, if the change of school should be granted. When making this decision, they are obliged to apply strict standards (Schulordnungsgesetz, 2006).
Like most countries, school funding in Saarland is a function of the number of classes in a grade. This number is determined by maximum class size rules. Prior to the 2002-03 school year, the maximum class size was set at 27 students (for ease of discussion we subsequently refer to an academic year by the calendar year in which it begins). Hence, whenever a class would exceed 27 students, a new class had to be formed. This threshold increased to 29 in the summer of 2003. However, if the average number of students with insufficient German proficiency per class was at least 4 in a grade, the threshold was set at 25 (Ernst, 2017). Note that class size is a much more meaningful concept in German primary schools than in secondary schools. Students are taught in the same classroom with the same peers in all or almost all subjects and the teacher is also the same in most subjects (Jonen and Eckhardt, 2006). The majority of students in a classroom stay
together for the entire duration of primary school. Classroom composition changes only if children repeat grades, switch schools, or, in rare cases are moved to a different classroom of the same grade.
Importantly, during the school periods for which we have test data, Saarland enacted a major structural reform in the primary school sector. Due to decreases in the number of school-aged children, which drove up the per-student costs especially in rural areas with low population densities, policy-makers decided to merge schools to ensure that all schools would have at least two classes per grade. This meant that primary schools with an insufficient number of students to form at least two classes per grade were merged with other primary schools. This applied to around one-third of all schools. Hence, the number of primary schools decreased from 268 in 2004 to 159 in 2005. However, the reform was not practically implemented at once in all schools. In most places, almost all incumbent students continued to be taught in the same buildings and classrooms as before. Only new incoming cohorts were sent to the main building of the newly merged schools. Because even the most recent cohort for which we have test score data was already enrolled in primary school when this policy was enacted, the consolidation of schools had no discernible impact on third graders in our data.
5
Estimation strategy
In our empirical analysis we estimate class size effects based on the within-school designs discussed in Section 3. However, we extend the estimators by allowing for year fixed effects and other pre-determined student characteristics.27 First, we estimate equations
of the following form by OLS:
yits =α0+α1CSts +α2Xi+Tt+Ss+icts (5) whereyitsrepresents the standardized grade 3 test score of studenti in yeartin schools; 27We abstract from these additional covariates in Section 3 to simplify the exposition of our main
CSts is the average class size in grade 3 in year tin schools ;Xi is a vector of studenti’s characteristics (e.g., gender);TtandSsare year and school fixed effects, respectively. Note that the grade-level average class size is used instead of actual class size to circumvent bias resulting from potential sorting of students and teachers within the same year and school into classes of different sizes. Including school fixed effects allows to control for between-school sorting that is time-invariant.
The OLS estimator exploits the entire within-school variation of class size in grade 3. This variation stems from a variety of sources, some of which might be problematic. For example, in deriving the estimators in Section 3, we allow class size in grade 3 to vary due to two additional sources besides birth cohort size: Differences in ability levels and grade retention thresholds across birth cohorts within schools. In settings with grade retention or redshirting, both of these sources of variation affect class size but also average test scores in grade 3, and thus potentially bias OLS estimates.28 The IV estimator in (1)
therefore exploits only arguably random variation in the timing and number of births within school catchment areas.
Ideally, we would thus estimate equation (5) via two-stage least squares (2SLS) using the predicted class size based on a school’s birth cohort size as an instrument for class size in grade 3. Unfortunately, data on the number of births at the level of the school catchment area are not available in Germany, but we can impute cohort size using ad-ministrative school-level enrollment data. For a given school in grade 3 in year t, we do this by summing up the number of regularly enrolled students in grade 1 in year t−2, the number of late enrolled students from year t−1, and the number of early enrolled students from year t−3. Dividing this sum by the number of classes in grade 1 in year
t−2gives the predicted class size for grade 3 in yeart, which we then use as an instrument for CSts in (5).
As discussed in Section 3, estimating class size effects this way still results in biased estimates since birth cohort size is correlated with the grade-level composition of students. To overcome this bias, we need to control for whether a student has been retained,
28Recall the discussion ofι
enrolled late, or enrolled early at the individual level (i.e., include dummies for each group of students in the vectorXi). While our test score data does not include this kind of information, it does contain age in years at the time of the test. We construct separate dummies for each age and use them as proxies for each group of students.29 This amounts
to combining students who have been retained or enrolled late into one group because both types of students are older than 9 years on the day of the test. Thereby, we also incorrectly assign those students reaching third grade one year late but who were born between May and June to the group of students who reach 3rd grade on time (recall that the enrollment cut-off is the 30th of June and age is measured in May). Assigning some retained or redshirted students to the group of non-retained students implies that we underestimate the average test score difference of non-retained students and students too old for their grade. Since the grade retention bias in (1) is a positive function of this difference, we expect some remaining upward bias in estimates of the pure class size effect.30
The fact that different maximum class size rules apply depending on the number of students with insufficient German proficiency in grade 1 introduces a further bias in class size estimates based on equation (5). Because even if cohorts size across years is completely random within schools, random shocks to the number of students with insufficient German proficiency in a cohort lead to a spurious positive class size effect if these students score lower on standardized tests (as in our data).31 To reduce this
upward bias, we control in some specifications for whether the teacher reports that a 29Note that controlling for age linearly, as done in some previous studies (see, e.g., Wößmann and
West, 2006; Denny and Oppedisano, 2013), is not sufficient to correct for the upward bias. The reason is that the negative relationship between age and test scores, caused by negatively selected students who are too old for their grade, is offset by a positive effect of age on test scores for students who are on schedule (Black et al., 2011). Hence, controlling linearly for age does not correctly adjust test scores for retained and redshirted students.
30Similarly, students born between May and June who were enrolled on time will be incorrectly
classified as having been enrolled too early. However, this should not have an effect on our estimates as we discuss in Appendix C.
31To see this, consider two cohorts in the same school with 27 students. Suppose that all students are
identical in terms of their academic skills except that the second cohort includes 4 students with limited German proficiency who have academic skills considerably lower than all other students. Due to these 4 students, the maximum class size threshold of 25 applies for the second cohort, while the threshold 27 applies for the first cohort. Hence, class size will be 27 and 18.6 for the first and second cohort, respectively. Since the average skill is lower in the second cohort, a simple within-school regression of test scores on class size would result in a spurious positive class size effect.
student has insufficient German proficiency in third grade. This is only a proxy for insufficient German proficiency in grade 1 as some students become proficient in German until grade 3. Hence, we expect this to only partially correct for the positive bias.32
Around one-third of all primary schools in Saarland were merged in 2005. This consol-idation of schools is a potential threat to our identification strategy since school-specific factors such as material resources and the composition of students may have changed as a result. These time-varying changes are not picked up by school fixed effects. For this reason, we estimate separate fixed effects for schools that were eventually merged on the individual school-level for the academic years 2003-2004 (when they had not yet been merged) and on the consolidated school-level for the academic years 2005-2006.33
As discussed in Section 3, the key identifying assumption for the results (1)-(4) is that the birth cohort size within a school’s catchment area is arguably random. That is, the size of a birth cohort is not related to its student composition or the threshold that determines grade retention or redshirting. The most obvious violation of this assumption results from potential self-sorting of families into specific school catchment areas that is not constant over time. To assess the credibility of our key assumption, we perform an extensive set of balancing checks at the birth cohort level below.
6
Data
6.1
State-wide Orientation Exams (SOE)
We use a unique administrative dataset that contains information on the math and lan-guage skills for the full universe of four consecutive cohorts of third-graders in the German 32German proficiency in grade 3 is, of course, potentially endogenous because it might be affected by
class size. However, since class size can be expected to negatively affect German proficiency, controlling for it provides a lower bound on the true class size effect.
33For efficiency reasons, we would ideally estimate only one set of fixed effects on the individual
school-level for schools that were merged in 2005 in which 3rd grade classes continued to be taught in their old schools. However, in our data we do not observe which school classes belonged to before consolidation. Hence, the need to aggregate everything to the consolidated school-level for merged schools.
state of Saarland.34 35 The data were obtained via state-wide centralized exams at the end of third grade in the school years 2003 to 2006. Participation in these "State-wide Orientation Exams" (SOE) was obligatory for all schools and classes.36 Testing was
car-ried out on three different days—two days for language and one day for math. If a student was not present on the day of testing, she was not allowed to take the exam later and her test score is, therefore, missing. We provide more information on these data in Appendix B.
Standardized assessments may suffer from bias introduced by manipulation of test scores by teachers (see, e.g., Angrist et al., 2017). In our case, there is an incentive for teachers to manipulate test scores, since the results directly affect them. It was a specific objective of the SOE to compare achievement between different schools and even between classrooms within schools in order to detect successful approaches to teaching and learning. To prevent the most common forms of teacher cheating and shirking, particularly teaching to the test and biased grading, the designers of the exams established a number of safeguards. First, teachers had to keep the test material sealed until the day of testing. That way, specific preparation for the test was prevented. Second, and most crucially, teachers did not correct the exams themselves. Answer sheet transcription and grading was performed by an external team of scorers who followed the provided grading rubrics. Therefore, score manipulation by the teacher can be ruled out.
We link the 2003-2006 test score data to administrative records obtained from the Saarland statistical office. These administrative records include enrollment and number of classes for grades 1-3 for all schools in Saarland. Furthermore, for the 2000-2005 school years, these data contain information on the school-year-level on the number of students in grade 1 who were retained, enrolled one year late, and enrolled one year early. This information is used to impute initial cohort size. Table E.2 shows the structure of the Saarland data by academic year.
34If not stated otherwise, all information provided in this section is based on Paulus and Leidinger
(2009).
35Students who were educated with "different aims" (zieldifferent) were exempt from the exams.
Education with different aims is often applied for students with disabilities.
6.2
Sample selection, variables and descriptive statistics
The full SOE dataset comprises 39,014 student-year observations from 268 schools. We impose a set of restrictions on these data. First, we drop all schools for which we observe zero classes for some years. These are schools that formed multi-grade-classes because enrollment was too low to form separate classes for each grade. This restriction means that we exclude 10 schools (less than 4% of all schools). Next, in order to reduce measurement error, we exclude individual students if the teacher indicated that the student arrived too late to class that day to be able to complete the test. This restriction results in less than 0.2% of our initial data being dropped. Note that we keep observations from students who participated in only one of the two days of testing in German. This applies to 2,209 students. These students are assigned the standardized score on the respective test domain that they took as their overall score in language. Our final dataset includes 37,847 language and 36,845 math test scores from 38,415 students.
Table 1 reports descriptive statistics for our final sample. We standardize test scores to have mean zero and a SD of one. In addition to test scores, the SOE data contain a rich set of control variables. Teachers reported gender, nationality, language spoken at home, age in years, German proficiency, and learning disabilities for each student. Students also reported the number of books at home, which is a useful proxy for socio-economic family background. Ammermueller and Pischke (2009) show that the reported books at home indicator strongly correlates with a host of parental background measures such as income, education, and origin. In fact, Wößmann (2005) and Ammermueller and Pischke (2009) find it to be the single most important predictor of cognitive skills in the Third International Math and Science Study (TIMSS) and the Progress in International Reading Literacy Study (PIRLS) as well as the Programme for International Student Assessment (PISA), respectively. Unfortunately, this question was not included in the first round of testing in 2003.
[Table 1 about here]
For most variables the share of missing observations is less than five percent except for the books at home question. In order to preserve as much information from the data as possible we keep all observations with missing data on control variables and create an additional missing category for each variable. The lower panel of Table 1 illustrates the impact of the school mergers in 2005. The number of schools decreased from 258 in the year 2004 to 156 in 2005 (a change of 40%) and as a result the average number of classes increased substantially from 2.33 to 3.25 classes per school.
Our main independent variable is the average class size in grade 3 for a given year and school. On average, class size is 20.8 for the academic years 2003 to 2006 in Saarland. Figure 1 illustrates the range of variation in average class size in grade 3 across as well as within schools. It is obvious that most of the variation is between schools, however, there is also a large amount of variation in average class size within schools.
[Figure 1 about here]
Table 2 reports descriptive statistics on the fraction of students in Saarland that were enrolled late and early in grade 1 in the academic years 2001-2006. It further contains the fraction of students repeating each grade during those school years. On average, 9 percent of all students repeat a grade before fourth grade, 2.5 percent are enrolled late, and 7 percent are enrolled early.
[Table 2 about here]
7
Results
7.1
Testing the theoretical predictions
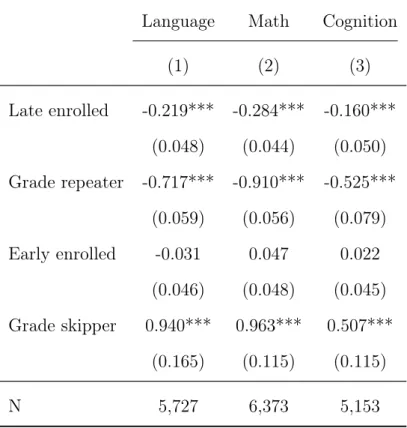
We first test whether differences in birth cohort size lead to the predicted compositional changes at the grade-level. Using administrative enrollment data for Saarland, we regress the fraction of students in grade 1 who were retained in grade 1 the year before, the fraction of students enrolled late, and the fraction enrolled early on the imputed cohort size for that year and school fixed effects. Panel A of Table 3 reports the results of these
regressions. Consistent with Prediction 1, all coefficients have the expected negative sign and are statistically significant. For example, for the fraction of late enrolled students, we obtain a point estimate of -0.21. This estimate implies that if a birth cohort is increased by one student, students who have been enrolled one year too late will account for 0.21 percentage points fewer students in grade 1 in the year that this cohort is expected to enroll.
[Table 3 about here]
The actual instrument we use is the predicted class size based on the imputed cohort size. To assess to what extent this instrument is systematically related to the composition of students at the grade level, Panel B presents estimates where we use class size in grade 1 as explanatory variable and instrument it with the predicted class size based on the imputed cohort size. Again, all coefficients have the expected negative sign and are statistically significant. However, the coefficients increase substantially in size compared to Panel A. For instance, an increase of one student in the predicted class size in grade 1 is associated with a decrease in the share of students in grade 1 who were enrolled too late by 0.80 percentage points. It is easy to see why this is the case. Since most schools have more than one class, class size does not increase one for one with cohort size. Hence, the compositional effects in Panel A are upward scaled by the inverse of the average increase in class size associated with a one-student-increase in cohort size to obtain the IV estimates in Panel B.
The key assumption in deriving (1)-(4) is the random assignment of birth cohort size within schools—that is, variation in birth cohort size is not related to the composition of these birth cohorts.37 Panel C of Table 3 checks the validity of this assumption by
testing whether birth cohort size is related to the fraction of students from the same birth cohort who are redshirted or enrolled early. Reassuringly, the results do not indicate any systematic relationship.38 In light of our discussion of the results in Panels A and B, any 37In our model set-up in Appendix A, random assignment also requires that yearly birth cohort size
changes are unrelated to variation in grade retention thresholds.
38We omit the result for the fraction of students who repeat a grade in column 3. The reason is that if
class size has a negative impact on student achievement, we expect a significant positive effect of cohort size on retention rates even if cohort size is unrelated to the composition of cohorts.
correlation between initial cohort size and the composition of students in higher grades seems to be driven by mechanical relationships rather than correlations between the size and the initial composition of birth cohorts.
In Appendix C, we perform several additional tests. To check that the compositional effects in Table 3 are a purely mechanical result, we perform a simulation exercise with a data-generating process based on a simple model that is tailored to the primary school system in Saarland in terms of the size of cohorts and the fraction of retained students (see Table E.12). This yields very similar results to those in Table 3. We also replicate the results in Table 3 with administrative data for another federal state (Saxony), for which we have data on retention rates until grade 3 (see Table C.1). The results for Saxony and the simulation exercise both corroborate the existence of mechanically arising compositional effects. They further indicate that these effects increase approximately multiplicatively in higher grades. Finally, we also provide extensive balancing tests based on the SOE student-level data to further check that birth cohort size variation within schools is quasi-random (see Table E.4). These indicate that the composition of birth cohorts in terms of observable student characteristics is balanced with respect to birth cohort size.
Given our theoretical results in Section 3 and the estimates in Panel B of Table 3, we can quantify the expected bias in class size estimates based on the IV approach. Equation (1) shows that the grade retention bias is additive and equals the product of two terms: (i) the average test score difference between non-retained and retained students and (ii) the IV estimate of the effect of class size on the share of non-retained students at the grade level (i.e., the negative value of the estimate in Panel B of Column 3 in Table 3).39 The biases resulting from redshirting and early enrollment can be obtained in the same way. To compute the overall bias we thus need the difference in average skills between the group of regular students and those who have been retained, redshirted, and early enrolled. As discussed above, our data do not allow to distinguish between students who have been redshirted and those who have been retained in primary school, as they will 39We do not take into account the bias resulting from attenuation here because this would require us
to make assumptions about the true class size effects. Hence, we get a lower bound on the true size of the bias.
both appear as older than 9 years in our data set. Hence, we rely on a different data set—The German National Educational Panel Study—to estimate test score differences for each group of students (see Appendix C for more details).
Given the estimates of these test score gaps and the fact that the compositional effect in grade 3 can be approximated by multiplying the effect in grade 1 by 3 as suggested by the Saxony data, this yields for retained students values of 0.00564 SD (= 3×0.717×
0.00262) and 0.00715 SD (= 3×0.910×0.00262) for language and math, respectively.40
For the full bias, we add the bias arising from late enrolled students: 0.00175 SD (= 0.219×0.008) for language and 0.00227 SD (= 0.284×0.008) for math. Since we do not find early enrolled students’ skills to differ from those of regular students, early enrollment can be neglected for the computation of the full bias. Combining these results, we expect the bias from compositional effects to decrease estimates of a one-student-reduction in class size between grades 1-3 on test scores in grade 3 by 0.0074 SD for language and 0.0094 SD for math.
7.2
Class size effects
In this section, we turn to reporting our class size effects. Table 4 reports first stage coefficients for our instrument, predicted class size based on imputed cohort size, on average class size in grade 3. As expected, the instrument is a strong predictor of class size and the F-statistic is above 170 for all specifications. Our results indicate that a one-student-increase in predicted class size based on imputed cohort size leads approximately to a 0.45-student-increase in class size in grade 3.
[Table 4 about here]
Tables 5 contains our main results for the empirical model in (5). We run separate regressions for language and math to be able to draw subject-specific conclusions. Col-umn 5 reports results from IV regressions where we only control for school and year fixed 40The value 0.717 is from row 3 and column 1 in Table C.2, the second value, 0.00262, comes from
column 3 of Panel B in Table 3. The first value for math comes from the second row of column 2 in Table C.2.
effects.41 The point estimates in both subjects are negative but not statistically signifi-cant. Our discussion of equation (1) suggests, however, that these estimates might suffer from a positive bias because of the correlation between initial cohort size and the com-position of students in higher grades. Once we include age controls in column 6, the IV estimates for language and math almost double in absolute size. This is consistent with the comparison of equations (1) and (2). The implied upward bias in class size estimates without age controls for a one-student-change is 0.0071 SD for language and 0.006 SD for math, which is in the ballpark of the predicted bias based on our theoretical model. The differences between estimates in columns 5 and 6 are not statistically significant and only the language effect turns weakly significant when we control for age. Nevertheless, these findings are suggestive of a potentially substantial bias in IV estimates of class size effects in school systems where students can be retained or redshirted.
[Table 5 about here]
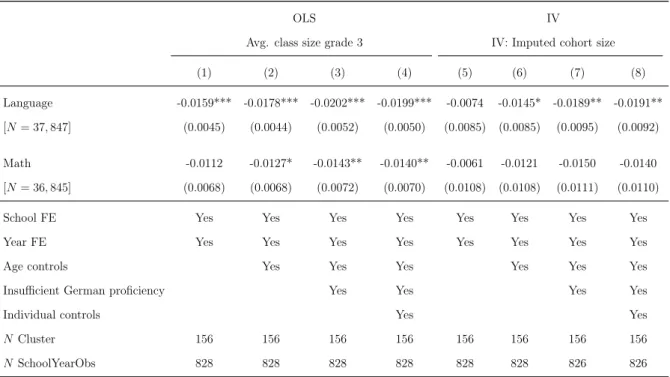
Because students with insufficient German proficiency are, on average, placed in smaller classes in Saarland (see the discussion in Section 5 and Appendix C), the re-sults in column 6 are likely still upward biased. Controlling for German proficiency in column 7 confirms this. Class size coefficients for both subjects become considerably more negative and the language effect turns significant at the five percent level. Includ-ing further controls such as a gender dummy or the reported number of books at home in column 8, however, makes little difference to the results. This suggests that any bias in our within-school estimates seems to be driven either by compositional effects arising from held back students or the lower class size threshold for students without sufficient German proficiency. Once we control for these confounding effects, the class size coeffi-cient for language implies a statistically significant test score increase of 0.0191 SD for a one-student-decrease in class size from grade 1 until grade 3. For math, the corresponding effect size is 0.014 SD, although the estimate is not statistically significant.
The OLS results in columns 1-4 follow the same pattern as the IV results. Estimated class size effects become more negative as we control for age and insufficient German
ficiency, but do not change with the inclusion of further controls. However, estimates for language and math in column 1 without age controls are substantially larger in absolute size than the corresponding IV estimates. For language the effect is significant at the one percent level. The inclusion of age controls only modestly increases the estimates in size in column 2. This could point to a lower compositional bias in within-school designs that regress test scores directly on class size compared to the IV approach. One possible explanation is that held back students increase the size of the class they join after having been held back. A positive correlation between class size and the share of retained students ensues, which offsets part of the negative correlation between class size and the share of held back students discussed before.42 Notably, with the full set
of control variables the OLS results in column 4 are very similar to the IV results in column 8. Durbin-Wu-Hausman tests fail to reject the null of no endogeneity in all IV specifications in columns 5-8 for language and math. Therefore, the overall conclusion is that the OLS results seem to be robust to the potential bias ιOLS in equation (4) in our setting. The substantially smaller OLS standard errors render estimates of class size effects for language and math in columns 3-4 statistically significant at the at the one and five percent level, respectively. We view this as strong evidence for a negative impact of class size on students’ test scores.
Importantly, the true magnitude of the class size effects is likely to be larger than the estimates presented here. Imperfect proxies for retention status and German proficiency leave some room for upward bias in our estimates. Further, equations (2) and (4) imply that the estimates in Table 5 are attenuated because class size in grade 3 is not perfectly correlated with the class size students experienced in grades 1 and 2.43
42Unfortunately, comparing ρ
IV and ρOLS in equations (1) and (3) does not allow us to conclude whether the composition bias should be larger for IV or OLS. This is becauseρOLS is a function of the second moments of the shocks to ability levels and grade retention thresholds (see equation (D.19) in the appendix), which cannot be identified.
43Table E.7 reports estimates for different specifications using either average class size in grade 1,
grade 2, or the average of grades 1-3 as explanatory variables. OLS and IV results for both subjects exhibit a monotonic pattern. Estimated class size effects appear to decrease in absolute size if test scores are regressed on class size from lower grades and results for the average class size in grades 1-3 fall somewhere between the results for grade 1 and grade 3. This is consistent with the notion that for students who enter a class after grade 1 (e.g. because they have been retained or switched schools), the class size for grade 1 of the class in which we observe them in grade 3 is an erroneous measure of their previous class size. Note that we do not observe when a student has been held back or switched