2010/82
■
School autonomy and educational performance:
within-country evidence
Jean Hindriks, Maijn Verschelde,
Glenn Rayp and Koen Schoors
Center for Operations Research
and Econometrics
Voie du Roman Pays, 34
B-1348 Louvain-la-Neuve
Belgium
http://www.uclouvain.be/core
CORE DISCUSSION PAPER 2010/82
School autonomy and educational performance: within-country evidence
Jean HINDRIKS1, Marijn VERSCHELDE2,
Glenn RAYP 3 and Koen SCHOORS 4 December 2010
Abstract
This paper shows the value of school autonomy for educational performance. To fully capture the informational advantage of local actors, we define school autonomy as the operational empowerment of the principals and teachers. The Flemish secondary school system in Belgium is analyzed as it is has a long history of educational school autonomy, but considerable variation between schools in school staff empowerment. Combining detailed school level and pupil level data from the PISA 2006 study with a semiparametric hierarchical model, we find strong indications that operational school autonomy is associated with high educational performance if appropriate accountability systems are active. Sensitivity tests show that both low and high-performers benefit from this kind of school autonomy.
Keywords: educational performance, PISA, school autonomy, educational production function, semiparametric.
JEL Classification: I28, H52
1 Université catholique de Louvain, CORE & Department of Economics, B-1348 Louvain-la-Neuve,
Belgium. E-mail: [email protected]. This author is also member of ECORE, the association between CORE and ECARES.
2
SHERPPA, Department of General Economics, Ghent University, B-9000 Gent, Belgium. E-mail: [email protected]
3
SHERPPA, Department of General Economics, Ghent University, B-9000 Gent, Belgium. E-mail: [email protected]
4 CERISE, Department of General Economics, Ghent University, B-9000 Gent, Belgium.
E-mail: [email protected]
We sincerely thank Sietse Bracke, Klaas Mulier and Joost Vandenbossche for their helpful suggestions and insightful comments on an earlier draft of this paper. Marijn Verschelde acknowledges financial support from the Fund for Scientific Research – Flanders (FWO-Vlaanderen).
This paper presents research results of the Belgian Program on Interuniversity Poles of Attraction initiated by the Belgian State, Prime Minister's Office, Science Policy Programming. The scientific responsibility is assumed by the authors.
1
Introduction and related literature
A remarkable stylized fact of educational economics is that higher school resources do not necessarily yield higher pupil performance. Evidence for an overall large effect of school resource policies on pupil performance is largely missing (Hanushek, 2003; W¨oßmann, 2003). It cannot be excluded however that the effect of input-based policies on pupil performance is moderated by the incentive structure of school actors (Hanushek, 2003). Since the incentive structure of school actors is embedded in school institutions, insight in the latter may be crucial to understand the relation between school resources and pupil performance.
There is accumulating cross-country evidence that getting incentives right by a combination of monitoring and autonomy is beneficial for educational efficiency (W¨oßmann, 2008). Since these studies compare institutions across countries the results may be biased because of an obvious omitted variable problem. Any other source of cross-country variation, like legal or cultural differences, may indeed bias the results. A simple identification strategy to circumvent the omitted variable bias problem and test the robustness of cross-country evidence would be to focus on the within-country variation in monitoring and autonomy, since cultural, legal and other country level variables can no longer bias the estimations. The problem however with this identification strategy is that the within-country variation is in most countries too small for insightful inference. In W¨oßmann (2010), one of the few papers that employ this strategy, regional variation across the 16 German states is used as microcosmos to show the robustness of the cross-country evidence. The limited number of observations in this study (only 16 regions) limits considerably the statistical power of the conducted tests. The first contribution of this paper is that we employ the strategy of within-country variation of institutions on a dataset of pupil level performance1, which gives us the degrees of freedom needed for statistical inference. We study pupil level performance in Flanders, where we consider Flanders as a ‘natural experiment’ with large within-region variation in school level institutional settings.2 The second contribution of the paper is that we restrict ourselves to a narrow definition of autonomy. We only look into the effects of autonomy of principals and teachers, the local agents that, through their local informational advantage, are supposed to boost educational outcomes. This identification strategy brings our work closer to a clean test of the supposed effects of autonomy in a principal-agent framework, where the government is the principal and the local school actors (principal and teachers) are the agents.
1
A pupil level study was not possible in W¨oßmann (2010) due to confidentiality requirements 2
With school level institutional settings we capture the school-specific level of among others choice, account-ability, autonomy, teacher quality, selectivity, etc. This is thus different from the system-level institutional settings.
Since 1989 Belgian education is administered by the country’s three communities, the Flem-ish Community, the French-speaking Community and the German-speaking Community. We focus on the Flemish Community (hence Flanders) because it is characterized by the needed within-country variation in school institutions and is considered to have the most effective accountability system (Hirtt, 2007). In Flanders, secondary education starts at age 12 and ends at age 18. Freedom of education and free parental school choice are enshrined in Bel-gium’s Constitution of 1831.3 The government subsidizes schools if they meet the minimal requirements. The main requirement is to set out a curriculum that is in line with the final and developmental objectives set by the government. In other words, the central government sets ‘end goals’4 and leaves it to the underlying levels how to attain these ‘end goals’. This considerable level of local autonomy in the organization of education has however not yielded a diverse educational landscape. About 75 percent of pupils are in Catholic schools, nearly 25 percent in publicly organized schools and only a very small proportion of pupils are in non-Catholic non-public schools. Considerable school policy autonomy was entrusted with non-profit school groups (‘de inrichtende macht’) that can group several schools of the same type within the same city or region. The studies of Eurydice (2007, 2008), an EU-financed network that provides information on and analysis of European education systems and poli-cies, provide insight in the structure of school autonomy in Flanders in an internationally comparable way. Neither schools, nor intermediate government institutions have the auton-omy to set the salaries of teaching or non-teaching staff. Schools have no autonauton-omy in setting the end goals, though full autonomy in the curricular content of optional subjects. Schools also have full autonomy over teaching methods, textbook choice, grouping of pupils, pupil assessment and the decision whether a pupil should resit a year or not. Little to nothing is known in the Eurydice data however on the school level variation in the empowerment of school staff. In this paper we will exploit the considerable variation - both in Catholic and public schools - in the ability of the school’s direction and teachers to set crucial school policies, as a strategy to identify the effect of school actor incentives on the relation between school resources and output.
Theoretical background The impact of school autonomy is linked to several strands of the literature. The decentralization of education may boost efficiency and productivity by eliminating unnecessary bureaucratic burdens (see Niskanen (1971) and Niskanen (1991), for seminal work on budget maximizing bureaucrats). School autonomy may help schools to
over-3
This guarantees that every natural or legal entity has the right to establish and organize schools au-tonomously and that a parent can inscribe his/her child in the school he/she wants (if place is available). (Moller et al., 2007)
come bureaucratic rigidity and in this way impact student performance positively (Bottani and Favre, 2001; Chubb and Moe, 1990). Entrusting the provision of education to local agents may also lead to more efficient provision because local agents will be closer and more respon-sive to student needs and preferences since students can ‘vote with their feet’ by changing school or even community. Tiebout (1956) shows that decentralized public good provision may, under certain conditions, yield the efficient provision of public goods like education. Hoxby (1999) confirms this Tiebout hypothesis for local school productivity under much less restrictive conditions. This suggests that the combination of decentralization and free school choice may indeed provide greater opportunities for local citizens and students to monitor and discipline the local agents that are responsible for educational policy, thereby creating greater efficiency and productivity. If the decentralization of education is accompanied by public information on school performance, it may also be conducive to yardstick competition (see Shleifer (1985), and Besley and Case (1995)) among schools, in this way encouraging the adoption of more effective teaching methods and more efficient operational procedures. Card et al. (2010) for example recently find significant effects of enhanced competition on the test score gains of students in Canada in all studied school systems. They however also point at a possible negative effect of this yardstick competition. It cannot be excluded that “in more competitive markets teachers and principals spend more time and effort preparing for stan-dardized tests, and less on other aspects of learning. If “test skills” have limited intellectual value, the effort devoted to competing over test outcomes is socially wasteful, and the higher test score gains observed in more competitive markets may be counter-productive” (Card et al. (2010), p. 29-30). In weak institutional environments, decentralization may have some addi-tional negative implications, like increased levels of uncoordinated rent-seeking and corruption as government structures become more complex and devoluted (Fan et al., 2009), increased coordination costs and slower institutional reform. The most important negative consequence of increased autonomy may lie in a potential principle-agent problem (see W¨oßmann et al. (2007)). The government (principal) tries to improve cognitive skill creation by delegating responsibilities to schools (agents) that are assumed to have a local information advantage over the principal. A principal-agent problem appears when the interests of the government and the school diverge and information is asymmetric. Interests typically diverge for decisions that influence the financial position of the school or the workload for school actors. Budget formulation and curriculum content are therefore policy areas with a high probability of di-vergence between the interests of the government and the school. In process and personnel decisions on the other hand, little divergence of interest is expected. This principal-agent problem can be solved by ensuring that the government has enough information on the effort of schools to improve cognitive skills of the pupils. If information is sufficiently symmetric,
autonomy is therefore expected to enhance educational efficiency. Central examinations are a widely used mechanism to keep the information asymmetries between government and schools in check (W¨oßmann et al., 2007), but other mechanisms can be used to attain this goal. In Flanders, as in the rest of Belgium, there are no central examinations, but inspection teams investigate on a regular basis whether the curriculum and teaching process are aimed at reach-ing the centrally imposed ‘end goals’ and whether budget formulation is in accordance with the posed requirements. Benchmarking by parents is possible as the inspection reports are publicly available. In addition, freedom in budget formulation is limited to additional fund-ing, above the centrally imposed funding system. Consequently, information asymmetries are limited in decision areas with a high probability of divergent interests, like budget formu-lation and curriculum development. We therefore expect that the principal-agent problem will be limited in Flanders and that the institution of school autonomy, through improved incentives for schools and teachers, will affect resource-allocation decisions and ultimately the educational performance of students positively.
How to measure school autonomy? School autonomy is a rather vague concept. PISA (2006) shows that increased autonomy does not necessarily go hand in hand with more re-sponsibilities for the principal or the teachers, because the rere-sponsibilities may be delegated to the school governing board instead. In the principle-agent framework, school autonomy is mainly expected to yield higher efficiency because the local actors (the principal and the teachers) have important informational advantages. If responsibilities are delegated to the school governing body however, it is less clear why we should expect a positive effect on effi-ciency. Studies that fail to appreciate these different types of autonomy may underestimate the beneficial impact of school autonomy. Hallinger et al. (1996) were the first to measure principals’ activities in key dimensions of a school’s instructional program and to relate these to student outcomes such as reading achievement. W¨oßmann (2003) is one of the first to look into the effect of individual teacher influence over teaching on student performance. In our study we will explicitly focus on autonomy of principals and teachers, using the data made available by PISA (2006). The PISA dataset among other things looks specifically into the roles that principals and teachers might play in educational decision-making and contains measures of centralization and decentralization for these different functions.
2
Data
2.1 PISA 2006
We use the PISA 2006 dataset. Since 1989, Belgian education is organized by the Flemish community, the French-speaking community and the German-speaking community. We fo-cus on the Flemish community because it is characterized by the needed large variation in principal and teacher autonomy, while this is much less the case in the other Belgian com-munities. The Programme for International Student Assessment (PISA) is an internationally standardized assessment of pupils of 15-year old in the subjects of reading, math and science. The assessment in all subjects covers the acquisition of essential knowledge and competencies. (see OECD (2006))
There are 3 cycles: PISA 2000, PISA 2003 and PISA 2006. In 2006, the survey was im-plemented in 57 countries. The PISA dataset is rich in variables related to educational achievement, family background and school level institutional settings. The main focus of PISA 2006 is on science, however all pupils are also requested to complete a standardized test on math, science and reading and fill out a survey with questions related to their family background, views on issues related to science, the environment, careers, learning time and teaching and learning approaches of science. Every principal in participating schools is asked to complete a survey with questions over the characteristics of the school.
Tests are typically constructed to assess between 4500 and 10000 students of age 15 in each country. To sample the target population of 15-year old pupils that are at least in grade 7, PISA 2006 has implemented a two-stage stratified sample design. In stage 1, for each strata5, schools are sampled proportionally to size from a list of schools in the region (PPS sampling). The target was 150 schools in each region. In stage 2, 35 pupils are randomly drawn from a list of 15-year old pupils in the school.6 Final student weights are constructed to correct for varying selection probabilities of the students.7 In PISA 2006 the plausible value approach is used to estimate the pupil performance in respectively mathematics, science and reading literacy. These plausible values are random values from the posterior distribution and cannot be aggregated at pupil level (OECD, 2005). Therefore, in what follows, we use the first plausible value component to estimate educational outcomes in math, science and reading at pupil level. A Balanced Repeated Replication (BRR) procedure with 80 replication estimates
5
A group of schools, formed to improve the precision of sample based estimates. 6
If the school has less than 35 pupils, all pupils are included in the sample. 7
This occurs because certain subgroups that are over- or under-sampled, the information of school size at the time is not completely correct, school non-response, student non-response and the inclusion of trimming weights to ensure stable estimates.(OECD, 2009)
- described in OECD (2005)- is used to construct standard errors and to account for sampling variation (OECD, 2009).
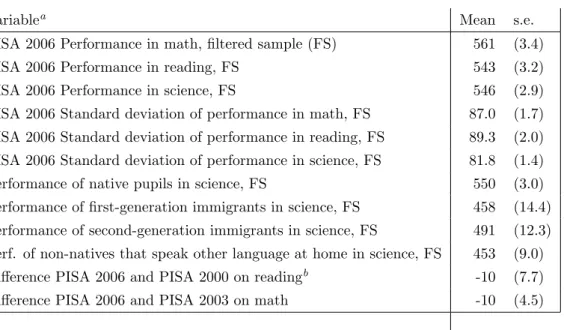
Pupils in special education or part-time education are dropped from the sample. Pupils in private-funded schools or with missing values for some variables are also dropped from the sample. By this, the sample is reduced to 3430 observations. Sub-schools are defined to control for ability tracking in general, technical-arts and vocational education. A sub-school is defined as a unit that provides either general, technical-arts, or vocational education. When a school provides both general and technical or arts education (there are only a few), then the school is treated as two separate (sub-)schools. The sample consists of 238 sub-schools. Table 1 shows descriptive statistics of the educational achievement of pupils in Flanders. Standardized test scores for math, science and reading are high in Flanders (PISA average is 500). But the high standard deviation of educational outcomes indicates that the inequality in individual test scores is also high in Flanders. The performance of non-native pupils is in Flanders lower than the performance of native pupils.
Table 1: Pupil performance
Variablea Mean s.e.
PISA 2006 Performance in math, filtered sample (FS) 561 (3.4)
PISA 2006 Performance in reading, FS 543 (3.2)
PISA 2006 Performance in science, FS 546 (2.9)
PISA 2006 Standard deviation of performance in math, FS 87.0 (1.7) PISA 2006 Standard deviation of performance in reading, FS 89.3 (2.0) PISA 2006 Standard deviation of performance in science, FS 81.8 (1.4)
Performance of native pupils in science, FS 550 (3.0)
Performance of first-generation immigrants in science, FS 458 (14.4) Performance of second-generation immigrants in science, FS 491 (12.3) Perf. of non-natives that speak other language at home in science, FS 453 (9.0) Difference PISA 2006 and PISA 2000 on readingb -10 (7.7)
Difference PISA 2006 and PISA 2003 on math -10 (4.5)
aA SAS procedure for a Balanced Repeated Replication procedure with 80 replication estimates and 5
plausible values for each subject, described in OECD (2005), is used to construct the mean and standard error. b
2.2 School staff empowerment
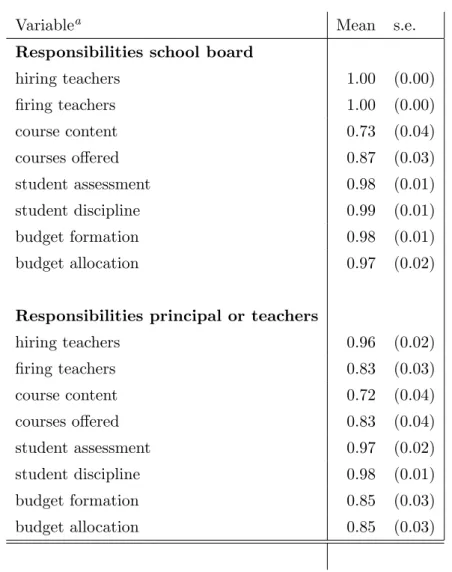
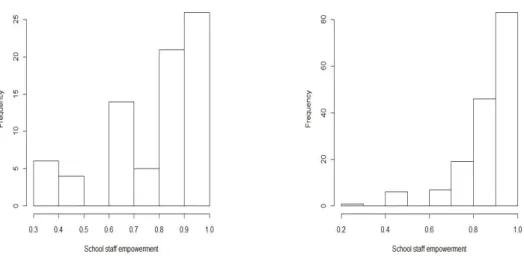
In line with Eurydice, the PISA 2006 data, summarized in Table 2, show that Flanders is characterized by considerable autonomy in staffing, budget issues, assessment and discipline of pupils and that most of this autonomy is entrusted with the principal and the teachers. To obtain insight in the overall school staff empowerment, we create the composite index “school staff empowerment” as the proportion of the following issues where the principal or teachers have significant responsibility on: (1) hiring teachers, (2) firing teachers, (3) course content, (4) courses offered, (5) student assessment, (6) student discipline, (7) budget formation, (8) budget allocation. Figure 1 shows that both public and privately-operating schools have large operational autonomy. Therefore, we have no reasons to expect per se that privately-operating schools will be more efficient than public schools. This is in line with Cherchye et al. (2010). Cherchye et al. (2010) find no evidence that privately-operating schools are more efficient than public schools in primary education in Flanders if the results are controlled for environmental differences (among others socio-economic background). Figure 1 not only indicates that the school staff is on average strongly empowered, but also suggests there is considerable variation across schools in the level of school staff empowerment.
School autonomy is only expected to benefit educational efficiency if the information advan-tage of the school staff is employed and if information asymmetries are limited. The high level of local staff empowerment found in this section indicates that the school autonomy in Flanders will indeed employ the information advantage of local staff. As regards the informa-tion asymmetries, we already discussed above why several accountability systems ensure that information asymmetries are rather limited in Flanders. In short, Flanders is characterized by a combination of school staff empowerment and accountability. We hypothesize that this combination of school staff empowerment and accountability will, after controlling for socio-economic and school-level institutional variation, affect educational performance of students positively.
Table 2: The Responsibility structure
Variablea Mean s.e.
Responsibilities school board
hiring teachers 1.00 (0.00) firing teachers 1.00 (0.00) course content 0.73 (0.04) courses offered 0.87 (0.03) student assessment 0.98 (0.01) student discipline 0.99 (0.01) budget formation 0.98 (0.01) budget allocation 0.97 (0.02)
Responsibilities principal or teachers
hiring teachers 0.96 (0.02) firing teachers 0.83 (0.03) course content 0.72 (0.04) courses offered 0.83 (0.04) student assessment 0.97 (0.02) student discipline 0.98 (0.01) budget formation 0.85 (0.03) budget allocation 0.85 (0.03) a
A SAS procedure for a Balanced Repeated Replication procedure with 80 replication estimates, described in OECD (2005), is used to construct the mean and standard error.
(a) Public education (b) Privately-operating education
Figure 1: Histogram school staff empowerment (sub-school level)
2.3 Control variables
Inputs To relate variation in outcomes to family background, we consider 2 socio-economic variables: socio-economic status and migration status. First, family socio-economic status is estimated by PISA 2006 as a composite index of the Economic and Socio-Cultural Status (ESCS) of a pupil, derived from (1) the highest occupational status of each student’s parents, (2) their highest educational level, and (3) a summary measure of household possessions. Second, for migration status, three proxies are used. First-generation immigrants and second-generation immigrants are respectively defined as pupils that are not born in Belgium and pupils that are born in Belgium, but are children of immigrants. Pupils that are first- or second-generation immigrant and do not speak an official Belgian language at home are grouped in a third variable of immigrants that do not speak an official Belgian language at home. The socio-economic and cultural status (ESCS) shows substantial variation across pupils. The proportion of non-native pupils is around 5 percent. 2 percent of the pupils in the sample do not speak an official Belgian language at home. In addition, there is significant lin-guistic fractionalization in schools. In ordinary secondary education in 2006, public spending per pupil was 7208 euros in Flanders (Eurybase, 2008). Schools receive funding and ‘teaching hours’ according to the number of pupils. Schools with more disadvantaged pupils receive additional resources (’GOK beleid’). On average, schools have a modest lack of educational resources (e.g. instructional material, labs) (the average is above the PISA 2006 average of 0). There are on average 9 pupils per teacher.
Institutional settings In Flanders, pupils in ordinary education are tracked in the first year of secondary education in general education, technical education, arts education and vocational education based on prior achievements. In our filtered sample, 51 percent of pupils are in general education (high track), 32 percent are in technical-arts education (middle track) and 18 percent in vocational education (low track).8
If a pupil has not reached the basic skills, determined by the ‘end goals’ in a school year, grade repetition and re-orientation to lower tracks are used. In our filtered sample, 79 percent of pupils are ‘on time’ in Flanders.
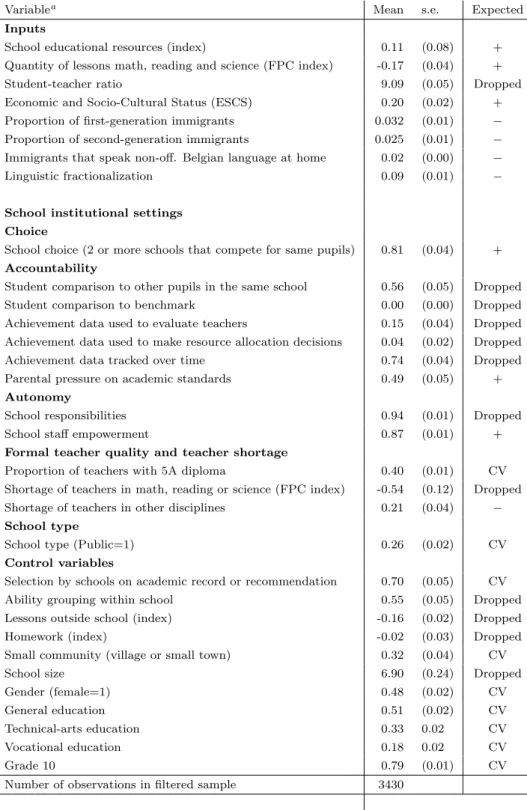
Private-granted schools are only a negligible proportion of the school population. There are mainly public schools (under control of community, provinces, cities or municipalities) and private operating, public-granted schools (e.g. Catholic schools, non-confessional schools). In our filtered sample, 74 percent of pupils are in privately-operating schools. Selection by schools is officially not allowed within a track. However, Table 3 indicates that selection on academic record or recommendation is frequently used. In Hanushek and Luque (2003), a significant positive effect is found of competition of private schools. In Hoxby (2000), evidence is found that Tiebout choice leads to better school performance in the US.9However, Rothstein (2006) notes that the positive effect of competition depends on the way parents choose schools. If parents choose schools on characteristics not related to school productivity, the positive impact of competition on the incentive structures in schools disappears. In sum, if the parents choose schools on productivity, competition is expected to be beneficial for educational efficiency. Table 3 shows that there is considerable competition between schools in Flanders. 81 percent of the pupils are in schools where the principal declares that 2 or more schools compete for the same pupils. In addition, there is a competition effect of the existence of both public-operating and private-operating schools. Other accountability systems than the formal inspection exist. A significant proportion of the schools are faced with parental pressure on academic standards. Tracking achievement over time and comparing pupil achievements within the same school also occur frequently. The true effect of school size in a cross-section study at pupil level is difficult to disentangle from the effect that parents choose schools with high education quality, with as consequence higher school size for better schools. Therefore, we do not analyze the effect of school size in this cross-sectional analysis. In line with Rivkin et al. (2005) and Kane et al. (2006), we expect that the relation between formal teacher quality and true teacher quality is weak. Therefore, no positive effect is
8
We merge the technical and arts tracks together because the two tracks do not dominate each other in curriculum difficulty and test scores and because there is only a small proportion of pupils that are in the arts track.
9
expected of formal teacher quality.
Shortage in educational personnel can have negative effects on the teacher quality and teaching process in a school. Therefore, a negative sign is expected. Because we are interested in the general perception of shortages in adequate teaching personnel, we focus on the more general proxy: shortage of adequate teaching staff in areas other than math, science and reading. Shortages of teachers in a specific area are too specific and for math and science, there is a well known systematic shortage in teachers. Student-teacher ratio, homework and lessons outside school are insightful at system-level, but are dropped from the pupil level analysis because of problems of reversed causality.
Table 3: Summary statistics
Variablea Mean s.e. Expected
Inputs
School educational resources (index) 0.11 (0.08) + Quantity of lessons math, reading and science (FPC index) -0.17 (0.04) + Student-teacher ratio 9.09 (0.05) Dropped Economic and Socio-Cultural Status (ESCS) 0.20 (0.02) + Proportion of first-generation immigrants 0.032 (0.01) −
Proportion of second-generation immigrants 0.025 (0.01) −
Immigrants that speak non-off. Belgian language at home 0.02 (0.00) −
Linguistic fractionalization 0.09 (0.01) −
School institutional settings Choice
School choice (2 or more schools that compete for same pupils) 0.81 (0.04) +
Accountability
Student comparison to other pupils in the same school 0.56 (0.05) Dropped Student comparison to benchmark 0.00 (0.00) Dropped Achievement data used to evaluate teachers 0.15 (0.04) Dropped Achievement data used to make resource allocation decisions 0.04 (0.02) Dropped Achievement data tracked over time 0.74 (0.04) Dropped Parental pressure on academic standards 0.49 (0.05) +
Autonomy
School responsibilities 0.94 (0.01) Dropped School staff empowerment 0.87 (0.01) +
Formal teacher quality and teacher shortage
Proportion of teachers with 5A diploma 0.40 (0.01) CV Shortage of teachers in math, reading or science (FPC index) -0.54 (0.12) Dropped Shortage of teachers in other disciplines 0.21 (0.04) − School type
School type (Public=1) 0.26 (0.02) CV
Control variables
Selection by schools on academic record or recommendation 0.70 (0.05) CV Ability grouping within school 0.55 (0.05) Dropped Lessons outside school (index) -0.16 (0.02) Dropped Homework (index) -0.02 (0.03) Dropped Small community (village or small town) 0.32 (0.04) CV School size 6.90 (0.24) Dropped Gender (female=1) 0.48 (0.02) CV General education 0.51 (0.02) CV Technical-arts education 0.33 0.02 CV Vocational education 0.18 0.02 CV
Grade 10 0.79 (0.01) CV
Number of observations in filtered sample 3430
a
A SAS procedure for a Balanced Repeated Replication procedure with 80 replication estimates, described in OECD (2005), is used to construct the mean and standard error of the mean. The school educational resources index summarizes the inverse of the principals’ responses to seven questions on the adequacy or shortage of educational resources. Linguistic fractionalization is created as in Alesina et al. (2003) with as
3
Methodology
Educational settings are complex and heterogeneous. First, the largest part of the empiri-cal data have a multilevel structure (pupils are nested within classes, classes within schools, schools within regions and school types, etc.). It is necessary to include this highly multi-level data structure into the empirical analysis to obtain unbiased estimates (Raudenbush and Bryk, 2002). This can be done by the use of so called ‘hierarchical’ or ‘mixed’ model. This implies that the intercept - and in some models also the slopes - is allowed to randomly vary between groups. To estimate the effects of school-level institutional factors and family background on student achievement, a multilevel regression analysis is carried out where co-variates are distributed at two levels: the students and sub-schools. In an educational setting, unobserved school effects are expected from school-level disparities in e.g. the unobserved aca-demic culture of school staff. As students are clustered in different schools, the assumption of independent noise is violated. It is thus necessary to include random school effects into the empirical analysis to obtain unbiased estimates.
Second, as result of the complex, heterogeneous nature of the data structure, imposing para-metric assumptions on the relationship between educational inputs and output can lead to biased estimates if there is misspecification. As it is unclear how school staff empowerment affects the educational performance, it is advisable to use a more flexible approach. Non-linearities and interactions can be addressed in different ways. First, polynomial expansions and parametric interactions can be considered. This would be easy to implement, but the risk of introducing multicollinearity is very high. Second, nonparametric approaches can be considered. Fully non-parametric approaches do not impose parametric assumptions on the functional form, but imply the so called ‘curse of dimensionality’ - that is that including a large amount of regressors dramatically slows down convergence speed - and involves prac-tical difficulties to include random effects. To avoid the ‘curse of dimensionality’, we use a semiparametric additive mixed model approach.
We define pupil test scoresY as a function of socio-economic, institutional predictorsX, and unobserved determinants such as innate ability and random noise at the pupil level . To allow for hierarchically clustered noise, we defineθas the random effect of school. We define a semiparametric varying-intercept model as:
Y =β0+β1x1+β2x2+. . .+βpxp +s1(xp+1) +s2(xp+2) +. . .+sq(xp+q)
+tp1(xp+q+1, xp+q+2) +...+tpr(xp+q+r, xp+q+r+1)
+θ+ (1)
whereβf, with f = 1, . . . , pare the fixed parameters of the p categorical variables, sk, with k = 1, . . . , q are the smooth functions for the q additive continuous variables and tpl, with l= 1. . . , r the smooths for the bivariate terms ofr+ 1 continuous variables.10
Semiparametric regressions can be estimated by the use of kernel weights or by using piece-wise polynomial functions - splines. Each approach has its own merits and drawbacks in a particular setting. We opt for a spline based approach as it is less cumbersome to use with large datasets.
A large methodological literature has focused on the issue how to represent smooth func-tions and to choose the smoothness of these funcfunc-tions (Wood, 2006). The popular backfitting approach of Hastie and Tibshirani (1990) has as advantage that multiple smooth terms can be included. The largest disadvantage is that the model selection (= selection of number of smooths) can be quite cumbersome (Wood and Augustin, 2002). The alternative approach of Gu and Wahba (1991) has solved the model selection problem. However, the high com-putational cost of the Gu and Wahba (1991) approach is an important practical barrier. A regression spline approach as proposed in Eilers and Marx (1996), Marx and Eilers (1998), Wahba (1980) and Wahba (1990) is a computationally efficient approach to estimate a semi-parametric additive model with integrated model selection. We use this regression spline approach as implemented in themgcv package in R as described in Wood (2006) with auto-matic and integrated smoothing parameter selection. As for now, the spline approaches are not suited to include categorical variables, we include the categorical variables parametrically. We thus have a semiparametric partially linear mixed model.
In specific, we opt for the penalized splines (P-splines) approach of Eilers and Marx (1996) to smooth the continuous variables, as this is robust for different scales of the covariates in a bivariate smooth.
The smooth function of a spline approach is a weighted sum of a basis of r overlapping splines.
10
Multivariate smooths can also be introduced, but are not used in this analysis as we use a tensor product of B-splines as discussed later. Multivariate tensor products of B-splines imply a dramatic loss of degrees of freedom.
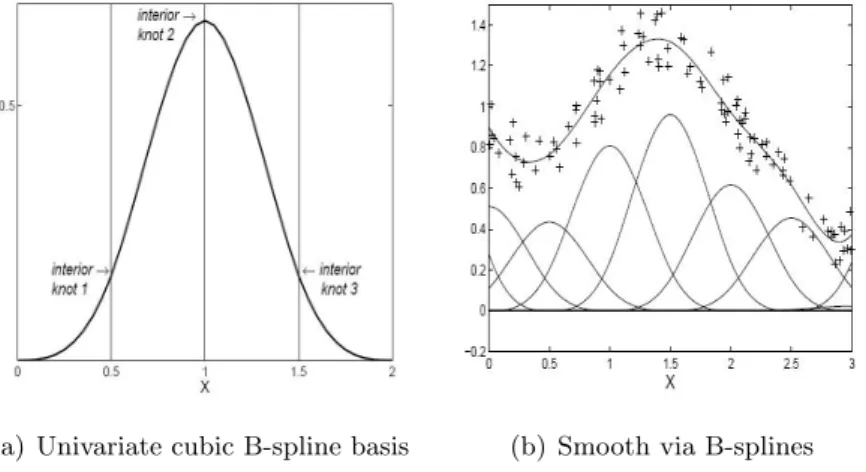
Figure 2(a) illustrates a cubic spline with local support (B-spline)11. By altering the weight of the splines by weight parameter αj, with j = 1, . . . , r on usually evenly spaced knots in function of minimization of the squared error, we obtain a flexible nonparametric smooth -as shown in Figure 2(b). Formally, the smooth function ˆs(x)(α)i can be represented as the
sum of r overlapping basis functions, multiplied by the respective basis parameters αj, with j = 1, . . . , r. ˆ s(x)(α)i = r X j=1 αjBj(x), such that∀x, r X j=1 Bj(x) = 1. (2)
To estimate a regression via P-splines,αis estimated by minimizing the squared error (known as theL2 norm) with inclusion of a penalty on wiggliness for each smooth function to avoid oversmoothing. Usually, the second order differences are penalized (d=2), however other penalty structures are also possible. As in Bollaerts et al. (2006), we define theL2 norm as follows: L2 = m X i=1 (yi−s(x)ˆ (α)i) 2+λ r X j=d+1 (4dαj)2, (3) with4dα
jbeing thedthorder differences, that is4dαj =41(4d−1αj) with41αj =αj−αj−1 and withλa non-negative smoothness parameter.
(a) Univariate cubic B-spline basis (b) Smooth via B-splines
Figure 2: B-splines, source: Bollaerts (2009)
To allow for interaction between variables, bivariate smooths are needed. A popular approach is the use of a tensor product. A bivariate spline of degree q can be defined as
Bjk(x1, x2, q) =Bj(1)(x1, q)×B(2)k (x2, q) (4)
11
A univariate B-spline of degree q smoothly joins q+1 polynomial pieces of degree q at q interior knots in the local support. The local support implies that outside the boundaries, the value is zero.
withx1,x2the regressors,B(1)andB(2)the two univariate B-splines. The estimated bivariate smooth term over a basis of r×r0 overlapping bivariate B-splines is defined as:
ˆ s(x)(α)i = r X j=1 r0 X k=1 αjkBjk(x1, x2, q) (5)
withαjk the coefficient. For n observations (x1i, x2i, yi), theL2 norm to be minimized is thus
L2 = n X i=1 (yi−s(x)ˆ (α)i) 2+λ 1 r X j=d+1 r0 X k=1 |4d rαjk|+λ2 r X j=1 r0 X k=d+1 |4d cαjk| (6) with4d
r the partialdth order differences of x1 and 4dc the partial dth order differences of x2. It is trivial that theL2 can be extended to include simultaneously a parametric part, random effects, univariate smooths and bivariate smooths in an additive approach.
3.1 Empirical model
To investigate whether educational performance of pupils is associated with the empowerment of school staff, we use the defined semiparametric partially linear additive mixed model. It is possible that the effect of school staff responsibility is dependent on the school composition and on the school type. Therefore, we allow interactions between school type, school staff empowerment and school ESCS. As output variable we consider the first principal compo-nent of pupil test scores on math, science and reading (with mean 20 and standard deviation 1.5). To control for the institutional and socio-economic variation in the educational setting in Flanders, we include control variables for (1) the pupil socio-economic status : migration status and pupil ESCS, (2) gender, (3) ability tracking, (4) grade repetition, (5) community effects, (6) linguistic fractionalization, (7) the quantity of lessons math, science and reading, (8) school-level educational inputs: the formal quality of the teaching staff, shortage of ade-quate teachers and school educational resources (9) school-level institutional settings: school choice, parental pressure and selectivity of the schools. We do not present results that control for the rather vague accountability measures and for within-school ability tracking. However, results including these variables are equivalent to the presented results and are available on request.
Pupil performance =β0+β1Gender +β2First generation immigrant +β3Second generation imm. +β4Language at home +β5Not lagging behind
+β6General education +β7Technical-arts education +β8Public school +β9School choice +β10Parental pressure +β11Selectivity of school +β12Teacher shortage +β13Small community
+s1(Lessons math, science and reading) +s2(Formal quality teachers)
+s3(School educational resources)
+s4(Linguistic fractionalization) +s5(Pupil ESCS)
+tp1(School staff empowerment,School ESCS)Public education +tp2(School staff empowerment,School ESCS)Private education
+θ+ (7)
4
Results
The estimated semiparametric partially linear model explains 60 percent of the variation in educational performance between pupils. A large part of this explanatory power finds its origin in socio-economic control variables.
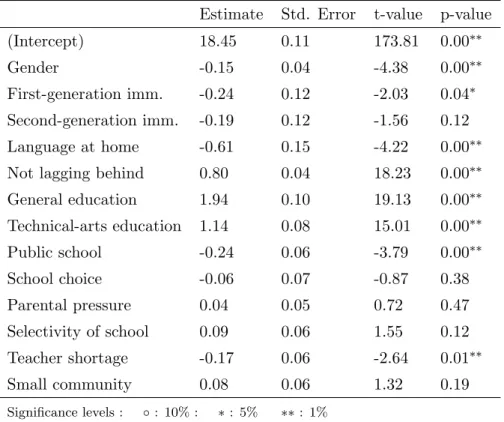
The parametric part of our semiparametric model as described in Table 4 shows significant effects of migration status. We find an effect of migration status over and above the effect of the socio-economic status of pupils. This effect is further amplified if the non-native pupil does not speak a Belgian language at home. We also find a significant effect of school type. However, due to strong self-selection of pupils into school types, based on unobserved variables, a value-added approach is needed to obtain more reliable evidence on this matter. As expected, the control variables for ability tracking, grade repetition and teacher shortage are significant. No evidence is found that the variation in educational performance in Flanders can be explained by variation in parental pressure, variation in school choice (competition), variation in selectivity of schools and variation in community size. However, this does not mean that these variables cannot have an effect at system-level.
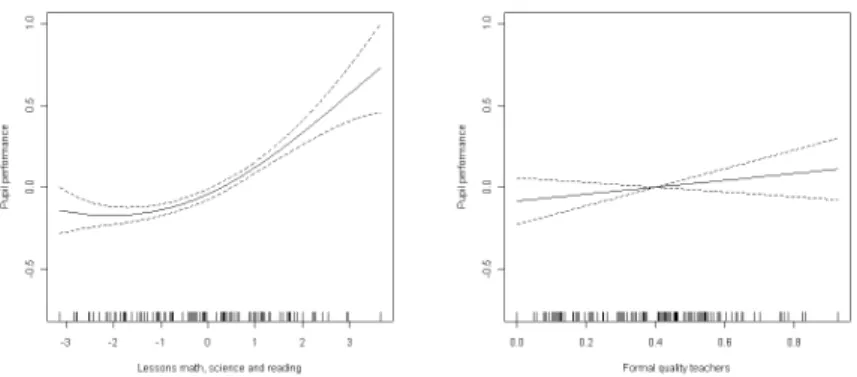
The smoothed variables, as shown in Table 5, Figure 3 and Figure 4, show in addition that pupil ESCS matters for educational outcomes. Within a school, there is still an effect of ESCS. Linguistic fractionalization in the school is found to be detrimental for educational
achievement. This can be the result of a ’getto-school’ effect or the effect of an environment where pupils have linguistic barriers to learn and cooperate with each other. In line with existing evidence, no effect is found for the formal quality of teachers. True teacher quality is distinct from formal quality. The control variables for the amount of lessons math, science and reading is also significant.
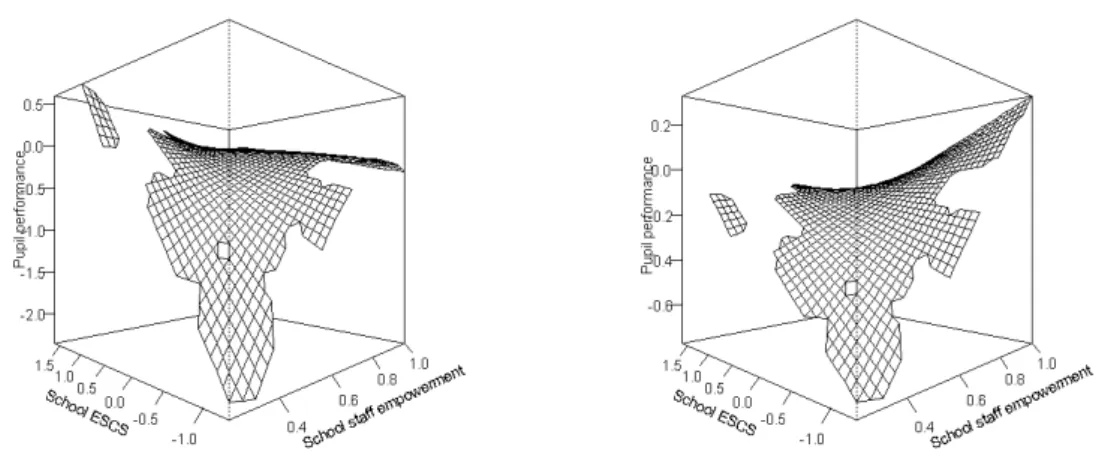
Last but certainly not least, we find that school staff empowerment matters. Figure 3 shows clearly that there is a positive effect of school staff empowerment on educational outcomes. In addition, we find that this effect is stronger in schools with more disadvantaged pupils, that may need a more tailored approach. By separating the smooth by school type, we show that this positive effect of school staff empowerment can be found in both privately-operating and public schools. Table 5 shows the significance of the bivariate smooth of school ESCS and school staff empowerment. Results available on request show the significance of both terms separately if school ESCS and school staff empowerment are modeled as univariate smooths.
Estimate Std. Error t-value p-value
(Intercept) 18.45 0.11 173.81 0.00∗∗
Gender -0.15 0.04 -4.38 0.00∗∗
First-generation imm. -0.24 0.12 -2.03 0.04∗ Second-generation imm. -0.19 0.12 -1.56 0.12
Language at home -0.61 0.15 -4.22 0.00∗∗
Not lagging behind 0.80 0.04 18.23 0.00∗∗
General education 1.94 0.10 19.13 0.00∗∗ Technical-arts education 1.14 0.08 15.01 0.00∗∗ Public school -0.24 0.06 -3.79 0.00∗∗ School choice -0.06 0.07 -0.87 0.38 Parental pressure 0.04 0.05 0.72 0.47 Selectivity of school 0.09 0.06 1.55 0.12 Teacher shortage -0.17 0.06 -2.64 0.01∗∗ Small community 0.08 0.06 1.32 0.19 Significance levels : ◦: 10% : ∗: 5% ∗∗: 1%
F-value p-value tp(School staff empowerment, School ESCS)Private education 2.75 0.02∗ tp(School staff empowerment, School ESCS)Public education 4.36 0.00∗∗
s(Lessons math, science and reading) 41.17 0.00∗∗
s(Formal quality teachers) 1.40 0.24
s(School educational resources) 3.15 0.04∗
s(Linguistic fractionalization) 15.63 0.00∗∗ s(Pupil ESCS) 14.52 0.00∗∗ R-sq.(adj) 0.60 Scale est. 0.84 Obs. 3430 Significance levels : ◦: 10% : ∗: 5% ∗∗: 1%
Table 5: Approximate significance of smooth terms
(a) Interaction school ESCS and school staff em-powerment in private schools - perspective plot
(b) Interaction school ESCS and school staff em-powerment in public schools - perspective plot
(a) Number of lessons math, science and reading (index)
(b) Proportion of teachers with 5A diploma
(c) School material for education (d) Linguistic fractionalization
(e) Pupil ESCS
Figure 4: The effect of univariate smooth terms
5
Effects at the Top and Bottom
We tested the robustness of the findings by altering the econometric and economic model specification. We regressed a fully parametric model with random school effects, inclusion
of variation in probability weights and clustering within strata. In addition, we tested the effect on the results of including the ‘dropped’ variables. The findings are robust for all the discussed specifications. Results available on request
More importantly, we also checked wether we obtained dissimilar effects at the bottom and the top of the ability distribution (as measured by test scores). In particular, we tested whether the uncovered association between school staff empowerment and average pupil performance can also be found for top and low performing pupils. For this, we estimate a quantile regression as initiated in the seminal work of Koenker and Bassett (1978). This approach allows a more complete picture of the conditional distribution of pupil performance. In this approach the conditional αth quantile (α ∈ (0,1)) is defined as the test threshold such that α percent of the pupils of the reference group perform worse. For example, in the socio-economic statusx, 25 % of the pupils performs worse than the score thresholdq0.25(x). It is common practice to use a so called ‘check function approach’ to estimate a quantile regression via minimization of weighted absolute deviations from the fit.
L1 = n
X
i=1
ρθ(yi−xiβˆ) (8)
with x a vector of regressors, β a vector of coefficients and with check function ρθ being defined as
ρθ(τ) =
(
θτ ifτ ≥0 (resp. τ ≤0) (θ−1)τ otherwise
withτ being defined asyi−xiβˆ. Weight factorθindicates how positive and negative values of τ are weighted. Ifθ= 0.5, positive and negative values are equally weighted and the median is estimated. If θ= 0.75, positive values ofτ receive a weight that is three times higher than the weight of negative values; the third quartile is estimated.
However, a drawback of a quantile regression approach is the lack of a consensus on how to include random school effects in the model. As such, the advantage of a more complete picture of the conditional distribution of pupil performance comes at the cost that we cannot control for random school effects.
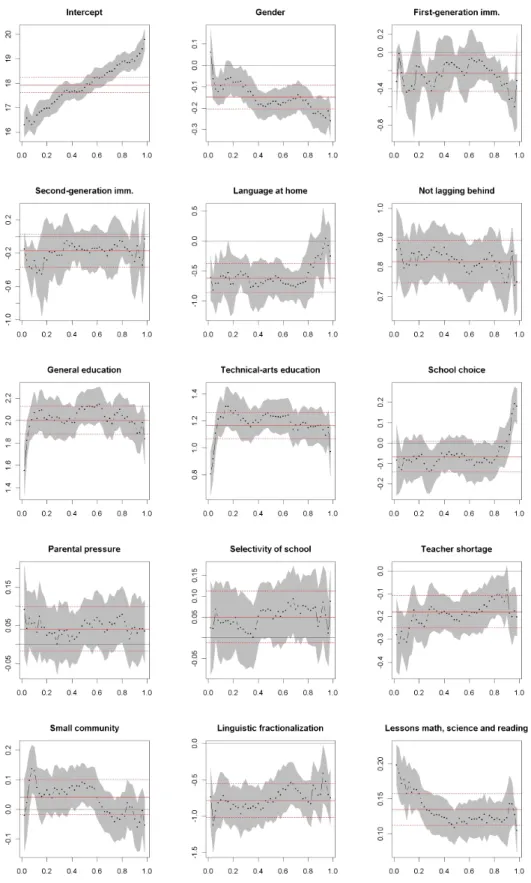
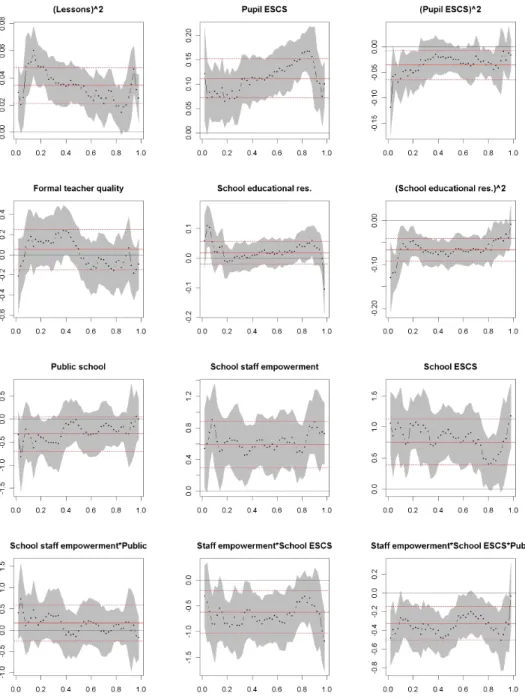
We opt for the parametric quantile regression approach, as implemented in the package ‘quantreg’ in R. We estimate 50 quantile regressions with θ between 0.025 and 0.975. To allow for interaction and quadratic effects, found in the discussed semiparametric model, we include quadratic terms for the quantity of lessons, pupil ESCS and school educational re-sources and allow for interaction between school staff empowerment, school type and school ESCS.
the estimated coefficient (y-axis). The shaded area denotes the 90% confidence interval and the dashed horizontal line the conditional mean estimates (with no random school effects). The results show robustness of our findings. School staff empowerment has a significant positive effect on pupil performance. This effect is higher for pupils in schools with low average ESCS and is not significantly different between school types. The negative interaction between school ESCS and school staff empowerment is higher in public schools. In addition, no indications are found for different coefficients between lower and upper quantiles; both the low and top performers benefit from higher school staff empowerment.
6
Conclusion
In this paper we have tested whether a combination of accountability and autonomy in educa-tion provision is beneficial for educaeduca-tional efficiency. There is ample cross-country evidence for this conjecture, but these studies are invariably faced with an omitted variable bias. We test this conjecture on the PISA-dataset for Flanders, where we consider Flanders as a ‘natural experiment’ with large within-region variation in school level institutional settings. Flanders presents a very useful natural experiment for several reasons. Increased delegation of respon-sibilities is expected to yield increased educational efficiency only if the central government (principal) delegates responsibilities to schools (agents) that have a local information advan-tage over the principal and if the interests of the government and the school do not diverge or information on school performance is symmetric. In Flanders, the government delegates a lot of responsibilities to school principals and teachers. This high level of local staff empowerment should lead to better use of local information and hence higher efficiency, if the central gov-ernment can avoid a principal-agent problem by monitoring school performance. In Flanders, there are no central examinations, but inspection teams investigate on a regular basis whether the curriculum and teaching process are aimed at reaching the centrally imposed ’end goals’ and whether budget formulation is in accordance with the posed requirements. In addition, freedom in budget formulation is limited to additional funding, above the centrally imposed funding system. This ensures that information asymmetries are limited in decision areas with a high probability of divergent interests, like budget formulation and curriculum devel-opment and therefore limits the scope for principal-agent problems in Flanders. Therefore Flanders is a very good testing ground for the theory that the institution of school autonomy, through improved incentives for schools and teachers, will affect resource-allocation decisions and ultimately the educational performance of students positively.
Our findings support this hypothesis. Controlling for a large battery of controls (migration status, pupil ESCS, gender, ability tracking, grade repetition, community effects, linguistic fractionalization, the quantity of lessons math, science and reading, the formal quality of the teaching staff, the shortage of adequate teachers and school educational resources, school choice, parental pressure and selectivity of the schools) we find indeed that local staff em-powerment clearly boosts educational outcomes. This positive effect of increased autonomy is stronger in schools with more disadvantaged pupils, and is present in both public and privately-operating schools. This is clear evidence of the theory that increased school auton-omy, if appropriately implemented, has the potential to yield better educational outcomes. Does the combination of accountability and autonomy boost educational efficiency? Yes.
References
Alesina, A., Devleeschauwer, A., Easterly, W., Kurlat, S., Wacziarg, R., Jun. 2003. Fraction-alization. Journal Of Economic Growth 8 (2), 155–194.
Besley, T., Case, A., 1995. Incumbent behaviour: vote-seeking, tax-setting, and yardstick competition. American Economic Review 85 (2), 25–45.
Bollaerts, K., 2009. Statistical models in epidemiology and quantitative microbial risk assess-ment applied to salmonella in pork. Ph.D. thesis, University of Hasselt.
Bollaerts, K., Eilers, P. H. C., van Mechelen, I., Nov. 2006. Simple and multiple p-splines re-gression with shape constraints. British Journal Of Mathematical & Statistical Psychology 59, 451–469.
Bottani, N., Favre, B., 2001. School autonomy and evaluation. Prospects - Quarterly Review of Comparative Education 31 (4), 166, issue 120.
Card, D., Dooley, M., Payne, A., 2010. School competition and efficiency with publicly funded catholic schools. Canadian Labour Market and Skills Researcher Netwerk, Working Paper 66, 61.
Cherchye, L., De Witte, K., Ooghe, E., Nicaise, I., 2010. Efficiency and equity in private and public education: a nonparametric comparison. European Journal of Operational Research 202, 563–573.
Chubb, J., Moe, T., 1990. Politics, markets, and america’s schools. Brookings Institution paper, 318.
Eilers, P., Marx, B., 1996. Flexible smoothing with b-splines and penalties. Statistical Science 11, 89–121.
Eurybase, 2008. Organisatie van het onderwijssysteem in de Vlaamse Gemeenschap van Belgi¨e: 2007-2008. European Commission.
Eurydice, 2007. School autonomy in Europe. Policies and Measures. Eurydice, iSBN 978-92-79-07522-3.
Eurydice, 2008. Levels of autonomy and responsabilities of teachers in Europe. Eurydice. Fan, C., Lin, C., Treisman, D., 2009. Political decentralization and corruption: evidence from
Gu, C., Wahba, G., 1991. Minimizing gcv/gml scores with multiple smoothing parameters via the newton method. SIAM Journal on Scientific and Statistical Computing 12 (2), 383–398. Hallinger, P., Bickman, L., Davis, K., 1996. School context, principal leadership, and student
reading achievement. Elementary School Journal 96 (5), 527–549.
Hanushek, E. A., Feb. 2003. The failure of input-based schooling policies. Economic Journal 113 (485), F64–F98.
Hanushek, E. A., Luque, J. A., Oct. 2003. Efficiency and equity in schools around the world. Economics Of Education Review 22 (5), 481–502.
Hastie, T., Tibshirani, R., 1990. Generalized Additive Models. London: Chapman and Hall. Hirtt, N., 2007. Pourquoi les performances pisa des ´el`eves francophones et flamands sont-elles
si diff´erentes ? Appel pour une ´ecole d´emocratique, 27.
URLhttp://www.skolo.org/IMG/pdf/PISA F.pdf
Hoxby, C., 1999. The productivity of schools and other local public goods producers. Journal of Public Economics 74 (1), 1–30.
Hoxby, C., 2003. The economics of school choice. University of Chicago Press.
Hoxby, C. M., Dec. 2000. Does competition among public schools benefit students and tax-payers? American Economic Review 90 (5), 1209–1238.
Kane, T., Rockoff, J., Staiger, D., 2006. What does certification tell us about teacher effec-tiveness? evidence from new york city. National Bureau of Economic Research Working Paper (12155).
Koenker, R., Bassett, G., 1978. Regression quantiles. Econometrica 46 (1), 33–50.
Marx, B., Eilers, P., 1998. Direct generalized additive modelling with penalized likelihood. Computational Statistics and Data Analysis.
Moller, J., Nusche, D., Pont, B., December 2007. School leadership for systemic improvement: Communities of schools in flanders, belgium - a case study report for the oecd activity improving school leadership. Tech. rep., OECD: Improving School Leadership Activity -Education and Training Policy Division.
URLhttp://www.oecd.org/edu/schoolleadership
Niskanen, W., 1971. Bureaucracy and Representative GOvernment. Chicago: Aldine-Atherton.
Niskanen, W., 1991. A reflection on Bureaucracy and Representative Government. Ch. The budget-maximizing bureaucrat: appraisals and evidence, pp. 13–31.
OECD, 2005. PISA 2003 Data Analysis Manual: SAS users. OECD Programme for Interna-tional Student Assessment.
OECD, 2006. PISA 2006: Science Competencies for Tomorrow’s World. OECD Programme for International Student Assessment.
OECD, 2009. PISA 2006 Technical report. OECD Programme for International Student As-sessment.
Raudenbush, S. W., Bryk, A. S., 2002. Hierarchical Linear Models: Applications and Data Analysis Methods. Thousand Oaks, CA: Sage.
Rivkin, S. G., Hanushek, E. A., Kain, J. F., Mar. 2005. Teachers, schools, and academic achievement. Econometrica 73 (2), 417–458.
Rothstein, J., 2006. Good principals or good peers?parental valuation of school characteristics, tiebout equilibrium, and the incentive effects of competition among jurisdictions. American Economic Review 96 (3), 1333–1350.
Shleifer, A., 1985. A theory of yardstich competition. RAND Journal of Economics 16 (3), 319–327.
Tiebout, C., 1956. A pure theory of local public expenditures. Journal of Political Economy 64, 416–424.
Wahba, G., 1980. Approximation Theory III. Academic Press, New York, Ch. Spline bases, regularization, and generalized cross validation for solving approximation problems with large quantities of noisy data, pp. 905–912.
Wahba, G., 1990. CBMS-NSF Regional Conference Series in Applied Mathematics. Vol. 59. Philadelphia: Society of Industrial and Applied Mathematics, Ch. Spline models for obser-vational data.
W¨oßmann, L., May 2003. Schooling resources, educational institutions and student perfor-mance: the international evidence. Oxford Bulletin Of Economics And Statistics 65 (2), 117–170.
W¨oßmann, L., Apr. 2008. Efficiency and equity of european education and training policies. International Tax And Public Finance 15 (2), 199–230.
W¨oßmann, L., Apr. 2010. Institutional determinants of school efficiency and equity: German states as a microcosm for oecd countries. Jahrbucher Fur Nationalokonomie Und Statistik 230 (2), 234–270.
W¨oßmann, L., L¨udemann, E., Sch¨utz, G., West, M., 2007. School accountability, autonomy, choice, and the level of student achievement: International evidence from pisa 2003. Un-classified OECD Education Working Paper 13, 1–85.
Wood, S., 2006. Generalized Additive Models: an introduction with R. Texts in Statistical Science. Chapman and Hall/CRC.
Wood, S., Augustin, N., 2002. Gams with integrated model selection using penalized re-gression splines and applications to environmental modelling. Ecological modelling 157, 157–177.
Recent titles
CORE Discussion Papers
2010/44. Michel DENUIT, Louis EECKHOUDT, Ilia TSETLIN and Robert L. WINKLER. Multivariate concave and convex stochastic dominance.
2010/45. Rüdiger STEPHAN. An extension of disjunctive programming and its impact for compact tree formulations.
2010/46. Jorge MANZI, Ernesto SAN MARTIN and Sébastien VAN BELLEGEM. School system evaluation by value-added analysis under endogeneity.
2010/47. Nicolas GILLIS and François GLINEUR. A multilevel approach for nonnegative matrix factorization.
2010/48. Marie-Louise LEROUX and Pierre PESTIEAU. The political economy of derived pension rights.
2010/49. Jeroen V.K. ROMBOUTS and Lars STENTOFT. Option pricing with asymmetric heteroskedastic normal mixture models.
2010/50. Maik SCHWARZ, Sébastien VAN BELLEGEM and Jean-Pierre FLORENS. Nonparametric frontier estimation from noisy data.
2010/51. Nicolas GILLIS and François GLINEUR. On the geometric interpretation of the nonnegative rank.
2010/52. Yves SMEERS, Giorgia OGGIONI, Elisabetta ALLEVI and Siegfried SCHAIBLE. Generalized Nash Equilibrium and market coupling in the European power system.
2010/53. Giorgia OGGIONI and Yves SMEERS. Market coupling and the organization of counter-trading: separating energy and transmission again?
2010/54. Helmuth CREMER, Firouz GAHVARI and Pierre PESTIEAU. Fertility, human capital accumulation, and the pension system.
2010/55. Jan JOHANNES, Sébastien VAN BELLEGEM and Anne VANHEMS. Iterative regularization in nonparametric instrumental regression.
2010/56. Thierry BRECHET, Pierre-André JOUVET and Gilles ROTILLON. Tradable pollution permits in dynamic general equilibrium: can optimality and acceptability be reconciled?
2010/57. Thomas BAUDIN. The optimal trade-off between quality and quantity with uncertain child survival.
2010/58. Thomas BAUDIN. Family policies: what does the standard endogenous fertility model tell us? 2010/59. Nicolas GILLIS and François GLINEUR. Nonnegative factorization and the maximum edge
biclique problem.
2010/60. Paul BELLEFLAMME and Martin PEITZ. Digital piracy: theory.
2010/61. Axel GAUTIER and Xavier WAUTHY. Competitively neutral universal service obligations. 2010/62. Thierry BRECHET, Julien THENIE, Thibaut ZEIMES and Stéphane ZUBER. The benefits of
cooperation under uncertainty: the case of climate change.
2010/63. Marco DI SUMMA and Laurence A. WOLSEY. Mixing sets linked by bidirected paths. 2010/64. Kaz MIYAGIWA, Huasheng SONG and Hylke VANDENBUSSCHE. Innovation, antidumping
and retaliation.
2010/65. Thierry BRECHET, Natali HRITONENKO and Yuri YATSENKO. Adaptation and mitigation in long-term climate policies.
2010/66. Marc FLEURBAEY, Marie-Louise LEROUX and Gregory PONTHIERE. Compensating the dead? Yes we can!
2010/67. Philippe CHEVALIER, Jean-Christophe VAN DEN SCHRIECK and Ying WEI. Measuring the variability in supply chains with the peakedness.
2010/68. Mathieu VAN VYVE. Fixed-charge transportation on a path: optimization, LP formulations and separation.
2010/69. Roland Iwan LUTTENS. Lower bounds rule!
2010/70. Fred SCHROYEN and Adekola OYENUGA. Optimal pricing and capacity choice for a public service under risk of interruption.
2010/71. Carlotta BALESTRA, Thierry BRECHET and Stéphane LAMBRECHT. Property rights with biological spillovers: when Hardin meets Meade.
Recent titles
CORE Discussion Papers - continued
2010/72. Olivier GERGAUD and Victor GINSBURGH. Success: talent, intelligence or beauty?
2010/73. Jean GABSZEWICZ, Victor GINSBURGH, Didier LAUSSEL and Shlomo WEBER. Foreign languages' acquisition: self learning and linguistic schools.
2010/74. Cédric CEULEMANS, Victor GINSBURGH and Patrick LEGROS. Rock and roll bands, (in)complete contracts and creativity.
2010/75. Nicolas GILLIS and François GLINEUR. Low-rank matrix approximation with weights or missing data is NP-hard.
2010/76. Ana MAULEON, Vincent VANNETELBOSCH and Cecilia VERGARI. Unions' relative concerns and strikes in wage bargaining.
2010/77. Ana MAULEON, Vincent VANNETELBOSCH and Cecilia VERGARI. Bargaining and delay in patent licensing.
2010/78. Jean J. GABSZEWICZ and Ornella TAROLA. Product innovation and market acquisition of firms.
2010/79. Michel LE BRETON, Juan D. MORENO-TERNERO, Alexei SAVVATEEV and Shlomo WEBER. Stability and fairness in models with a multiple membership.
2010/80. Juan D. MORENO-TERNERO. Voting over piece-wise linear tax methods.
2010/81. Jean HINDRIKS, Marijn VERSCHELDE, Glenn RAYP and Koen SCHOORS. School tracking, social segregation and educational opportunity: evidence from Belgium.
2010/82. Jean HINDRIKS, Marijn VERSCHELDE, Glenn RAYP and Koen SCHOORS. School autonomy and educational performance: within-country evidence.
Books
J. GABSZEWICZ (ed.) (2006), La différenciation des produits. Paris, La découverte.
L. BAUWENS, W. POHLMEIER and D. VEREDAS (eds.) (2008), High frequency financial econometrics: recent developments. Heidelberg, Physica-Verlag.
P. VAN HENTENRYCKE and L. WOLSEY (eds.) (2007), Integration of AI and OR techniques in constraint programming for combinatorial optimization problems. Berlin, Springer.
P-P. COMBES, Th. MAYER and J-F. THISSE (eds.) (2008), Economic geography: the integration of regions and nations. Princeton, Princeton University Press.
J. HINDRIKS (ed.) (2008), Au-delà de Copernic: de la confusion au consensus ? Brussels, Academic and Scientific Publishers.
J-M. HURIOT and J-F. THISSE (eds) (2009), Economics of cities. Cambridge, Cambridge University Press. P. BELLEFLAMME and M. PEITZ (eds) (2010), Industrial organization: markets and strategies. Cambridge
University Press.
M. JUNGER, Th. LIEBLING, D. NADDEF, G. NEMHAUSER, W. PULLEYBLANK, G. REINELT, G. RINALDI and L. WOLSEY (eds) (2010), 50 years of integer programming, 1958-2008: from the early years to the state-of-the-art. Berlin Springer.
CORE Lecture Series
C. GOURIÉROUX and A. MONFORT (1995), Simulation Based Econometric Methods. A. RUBINSTEIN (1996), Lectures on Modeling Bounded Rationality.
J. RENEGAR (1999), A Mathematical View of Interior-Point Methods in Convex Optimization.
B.D. BERNHEIM and M.D. WHINSTON (1999), Anticompetitive Exclusion and Foreclosure Through Vertical Agreements.
D. BIENSTOCK (2001), Potential function methods for approximately solving linear programming problems: theory and practice.
R. AMIR (2002), Supermodularity and complementarity in economics. R. WEISMANTEL (2006), Lectures on mixed nonlinear programming.