Influence of Integration of Information Communication
Technology in Teaching on Students’ Academic Performance
Stephen Ngugi Mbugua1 Joel Kiboss2 Edward Tanui3
1. Department of education, Kagumo Teachers Training College, P.O Box 18-10100, Nyeri, Kenya. 2. Department of curriculum and instruction, Mount Kenya University, P.O. Box 20100-17273, Nakuru,
Kenya.
3. Department of curriculum, instruction and educational management, Maasai Mara University, P.O. Box 861-20500, Narok, Kenya.
Abstract
Teachers must understand the context within which students’ performance improvement takes place. Operational effectiveness and strategy are both essential to superior performance and strategy execution is crucial for quality and better students’ academic result. ICT can be a catalyst by providing tools which teachers use to improve teaching and giving learners access to electronic media that make concepts clearer and more accessible. Teachers in public secondary schools in Nakuru County, Kenya, have been integrating ICT in teaching, but students’ academic performance in KCSE examinations has been low as shown by the outcome of the examination results by Kenya National Examinations Council (KNEC). Few students qualify to join the various universities. This study used a survey research design to establish how the integration of ICT in teaching influenced the students’ academic performance. A total of 486 teachers (405 classroom teachers and 81 principals) from 81public secondary schools participated in the study. They were randomly selected from three clusters of schools namely National, Extra-County and County public secondary schools. Public secondary schools were selected because they are funded by the government and parents through parents’ teachers’ association (PTA) and are managed by the board of management (BOM). The findings of the study showed a positive influence on students’ academic performance with integration of ICT in teaching. The finding also showed that there was no relationship between gender and integration of ICT in teaching but there were relationship between teachers’ highest level of education, the age of the teacher and integration of ICT in teaching. The study concluded that integration of ICT in teaching is a vital component in improvement of students’ academic performance.
Keywords: ICT, integration, academic performance, influence, access
1. Introduction
The society today puts a lot of importance on students’ academic performance. Outcome in national examinations is used as criteria for admission in university and middle level colleges in most countries all over the world. For this reason Information Communication Technology (ICT) is increasingly becoming a more and more powerful tool for education and economic development world over. Teachers must understand the context within which students’ performance improvement takes place (Wango, 2009). Porter in Kaplan and Norton (2008) noted that operational effectiveness and strategy are both essential to superior performance and that strategy execution is crucial for quality and better students’ academic result. ICT can be a catalyst by providing tools which teachers use to improve teaching and by giving learners access to electronic media that make concepts clearer and more accessible.
2. ICT Integration in Teaching
ICT is used for capacity development and citizen empowerment. Ultimately, ICT can enhance teaching opportunities and outcomes for students, including students with intellectual disabilities (Anderson, 2009). Students who integrate ICT in learning may easily understand complex topics and concepts. They are more likely to recall information and use it to solve problems in the classroom (Apple Computer, 2002). Integration of ICT in teaching enhances students’ knowledge, investigation and inquiry skills and creates curiosity and interest as information is available at multiple levels (CEO Forum on Education and Technology, 2001).
Integration has a sense of completeness or wholeness by which all essential elements of a system are seamlessly combined together to make a whole (Earle, 2003). In teaching, simply handing out to learners a collection of websites or CD-ROM programs is certainly not integration of ICT. In a properly crafted ICT integrated teaching lesson, ICT and other crucial curriculum contents such as content and pedagogy are molded into one entity. As a result, the quality of the lesson would somehow be diminished if the ICT ingredient were taken away from the ICT-integrated lesson (Williams, 2003).
Teaching is imparting knowledge, attitudes and values (Lefrancise, 1991). Hough and Duncan (1970) described teaching as a unique professional, rational and humane activity in which one creatively and imaginatively uses himself and his knowledge to promote the learning and welfare of the learner. Guilbert (1981) summerised teaching as ‘interactions between teacher and learner under the teachers’ responsibility in order to
bring about expected changes in the learners’ behaviour’. He further explains the purpose of teaching as to help learners to acquire, retain and use knowledge; understand, analyse, synthesize and evaluate; achieve skills and establish habits and develop attitudes. Academic performance refers to the learners’ ability to show and apply knowledge, skills, abilities and attitudes leant towards a specific objective (Kiruhi, Githua,& Mboroki, 2009). Both formative and summative evaluation may be used to measure performance. In Kenya KCSE examination results are used as summative evaluation to measure students’ performance.
3. The problem
Teachers in Kenyan public secondary schools have been integrating ICT in teaching, but students’ academic performance in KCSE examinations has not shown significant improvement. The number of students with aggregate of grade B and above in the national examination was 39,041(9.48%) out of 411787 students and 50,327(14.08%) out of 357488 students for the year 2010 and 2011 respectively. The performance was low as the number of students who qualified to join universities was relatively 10%. A similar result was found in Nakuru County public secondary schools where the number of students with aggregate of grade B and above was 484(2.53%) out of 19139 students and 540(3.05%) out of 17723 students for the year 2010 and 2011 respectively. The government of Kenya in its integration of ICT strategy identified strategic pillars for the education sector integration of ICT as: provision of digital equipment, connecting network facilities, technical support, harnessing emerging technologies, integration of ICT in education, training, partnerships and resource mobilization. There lack information of how integration of ICT in teaching influence students’ academic performance. This study sought to fill this gap.
4. Research Questions
The purpose of this study was to investigate the influence of integration of ICT in teaching on students’ academic performance. To achieve this objective, answers were sought to the questions bellow:
1. Does integration of ICT in teaching influence students academic performance? 2. Is there a relationship between age and integration of ICT in teaching?
3. What relationship exists between teachers’ highest level of academic achievement and integration of ICT in teaching?
4. Does gender influence integration of ICT in teaching in public secondary schools?
5. Methods
5.1 Research Design
The study adopted a survey research design to investigate the influence of integration of ICT in teaching on students’ academic performance in public secondary schools in Nakuru County, Kenya. Survey research design was chosen to enable generalization of the study findings to the population (Gay & Airasian, 2000). Descriptive surveys are also concerned with describing, recording, analyzing and interpreting conditions that either exist or existed and that the researcher does not manipulate the variables or arrange for the events to occur.
5.2 Sample
The population of study was 274 public secondary schools in Nakuru County with a total teacher population of 1644. Teachers were chosen because they were the curriculum implementers who integrate ICT in teaching. The County had 4 national schools, 28 Extra-county schools and 242 County schools. A total of 486 teachers were sampled. Cluster sampling was done to get one (1) National school, eight (8) Extra-County schools and seventy two (72) County schools making a total of eighty one (81) public secondary schools. Further clustering was done to sample teachers in each of the five cluster subjects taught in Kenyan public secondary schools making a total of 405 (81*5) teachers who completed the questionnaire. All the 81principals of the selected schools were interviewed and 81 observation schedules completed. The sample was 30% of the population which was in line with the sample size of 30% of the target population as being enough samples for survey study as suggested by Gay, Mill and Airasian (2006). The three data collection instruments (the questionnaire, interview guide and observation guide) were used to collect data for the study. The instruments were pretested using a sample of 10% (162) teachers of the 1644 teacher population in line with Newman (2006) and Best and Khan’s (2000) whose suggestions were that a researcher pretest the research instruments with a small (1%-10%) set of respondents similar to those in the final survey depending on the sample size.
6. Results and Discussion
The study sought to find out the influence of integration of ICT in teaching on students academic performance. A question was asked over teachers’ integration of ICT in teaching in various areas. The findings were tabulated on Table 1.
schemes of work, 54.1% integrate ICT in preparation of instructional materials, 54.8% integrate ICT in preparing students’ progress reports, 84.4% integrate ICT for students’ instruction in class, 80.0% integrate ICT in library management, 79.3% integrate ICT in preparing students’ records, 78.5% integrate ICT for corroborating with peers and 85.2% integrate ICT in class attendance management. The study shows that integration of ICT in teaching in schools is rather high the least being preparation of schemes of work (52.2%). But ICT integration in classroom student teaching is second highest (84.4%), while ICT is fairy integrated in preparation of instructional materials (54.1%) Table1.
Table 1: Descriptive Data of ICT Integration in Teaching
Area of ICT Integration Percent N=405 Yes No Timetable preparation 80.0 20.0 Preparation of schemes of work 52.2 47.8 Instructional materials 54.1 45.9 Students’ progress reports 54.8 45.2 Instruction in class 84.4 15.6 Library management 80.0 20.0 Students’ records 79.3 20.7 Corroboration with peers 78.5 21.5 Class attendance management 85.2 14.8
This implied that the integration of ICT in teaching in secondary schools is rather significant and may have improved students’ academic performance.
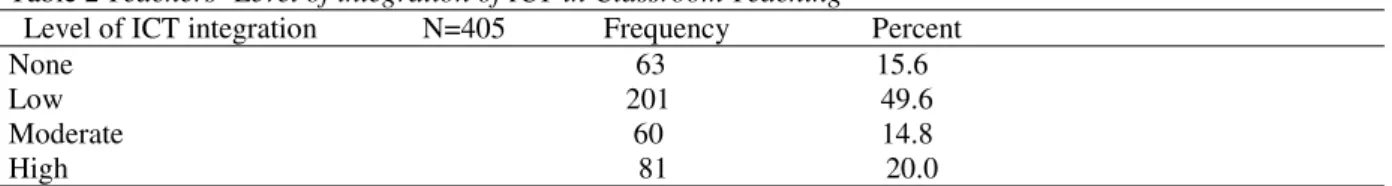
The findings over the levels of integration of ICT in teaching were tabulated on Table 2. Table 2 Teachers’ Level of integration of ICT in Classroom Teaching
Level of ICT integration N=405 Frequency Percent None 63 15.6
Low 201 49.6 Moderate 60 14.8 High 81 20.0
The study found that 15.6% of the respondents did not integrate ICT in teaching, 49.6% lowly integrated ICT in teaching, 14.8% moderately integrated ICT and 20.0% highly integrated ICT in classroom teaching. This meant that majority of teachers 84.4% (low, moderate and high) integrated ICT in teaching.
The study sought information over students’ KCSE performance for the years 2008-2011 the period ICT was been integrated in teaching in Nakuru County. A question was asked over students’ KCSE examination performance for the year 2008- 2011. Data collected was analysed by measures of central tendency and variance and the students’ KCSE mean marks and standard deviations respectively on a twelve (12) point scale were presented on Table 3.
Table 3 showed that students’ taught by the teachers who did not integrate ICT in teaching at all had the lowest (4.16) KCSE mean mark. Those who integrated ICT in teaching at low level had a low (4.76) KCSE mean mark, those who integrated ICT at moderate level had a better (5.61) KCSE mean mark and those who highly integrated ICT had the best (6.14) KCSE mean mark. The findings of this study support a studybyBober (2001) who observed that ICT integration improves students’ academic performance.
Table 3: Students’ KCSE Academic Performance Trend 2008-2011
Year N=405 Mean marks Std 2008 4.85 1.80 2009 4.92 1.81 2010 5.01 1.92 2011 5.05 1.97 2012 4.97 2.06 Overall mean 4.96 1.89
NB: The analysis was at 95% confidence interval for mean.
To find out whether there was a significant relationship between integration of ICT in teaching and students’ academic performance, an inferential parametric test, one way ANOVA test for relationship between KCSE examination performance and levels of integration of ICT in teaching was done. The test outcome in form of mean squares and F-values were presented on Table 4.
Table 4 showed the one way ANOVA test F-value= 9.132 at p-value= 0.000. The critical F-value= 6.59. The value=9.132 obtained was less than the critical value= 6.59. Thus the outcome of ANOVA
F-value= 9.132 showed that the improvement in performance was as a result of the integration of ICT in teaching. The difference was significant at 0.05 level and 3 degrees freedom with an F-ratio of 9.132 and a P-value of 0.000.
Table 4 One Way ANOVA Test Results for Relationship in KCSE Performance by Levels of ICT Integration
Scale Sum of squares df mean square F-ratio P-value Between groups 63.951 3 21.377 9.132 0.000 Within groups 294.128 126 2.334
Total 358.0 79
NB: They were significant at the 0.05 level F (3,126) =9.132, p=0.000.
But the results in Table 4 did not reveal where the relationship were. To pinpoint exactly where the relationship in integration of ICT in teaching were pair-wise a further analysis using a post hoc inferential statistic, Scheffe, was done. The results were presented on Table 5. The test outcome on Table 5 showed the p-values=0.39 between group which did not integrate ICT at all (None) v/s low, p-value= 0.31 for low v/s moderate integration, and p-value=0.86 for moderate v/s high integration. The three p-values were not rejected at 0.5 significance level which means the integration of ICT in teaching was not to a significant level. While the p-value=0.029 for None v/s moderate, p-value=0.00 for None v/s high and p-value= 0.009 for low v/s high were rejected which means the performance improvement was significant in relation to the amount of integration of ICT. Thus there was a difference in students’ performance between the groups which integrated ICT in teaching significantly (None v/s moderate, None v/s high and low v/s high) as their p-values were rejected at 0.05 significance level. This implies that integration of ICT in teaching influenced students’ academic performance positively.
Table 5 Post Hoc Tests multiple comparison test: Dependent Variable; KCSE mean scores for 2008 -2012 Scheffe.
Integration of ICT in Mean difference (md) P-value Teaching levels (group)
None v/s low 0.54 0.395 None v/s moderate -1.45 0.029⃰ None v/s high -1.98 0.00⃰ Low v/s moderate -0.91 0.31 Low v/s high -1.44 0.009⃰ Moderate v/s high 0.53 0.816 (NB: The mean difference is significant at the 0.05 level)
To find out whether there was a significant difference between integration of ICT in teaching and students’ KCSE academic performance, an inferential statistical test, Chi-square (χ2) test was done. Students mean scores were grouped into clusters for cross tabulation with groups for integration of ICT in teaching. A descriptive statistical data analysis was first done and presented in form of frequency distributions and percentages presented on Table 6.
Table 6 Cross-tabulation of the Integration of ICT in Teaching and Students’ KCSE Mean Scores
Level of integration N=405 KCSE Mean Score range frequency Of ICT in teaching (2-7) (8-12) Total
Low 192 18 210
Moderate 122 3 125
High 21 49 70
Total 335 70 405
The cross-tabulated data on teachers’ levels of integration of ICT in teaching and students’ KCSE examination performance Table 6, were subjected to an inferential Chi-square (χ2) test to test whether there was a difference between the levels of integration of ICT in teaching and students’ KCSE examination performance, and the outcome presented on Table 7.
Table 7 Chi-Square Tests for the Integration of ICT in Teaching and Students’ KCSE Mean Scores
Scale Value df Sig. (2-sided) Pearson Chi-Square (χ2) 53.830 2 0.000
NB: The mean difference is significant at the 0.05 level
The Chi-square (χ2) test results showed a Chi-square (χ2) value of 53.830 at 2 degree freedom with a P-value= 0.000 (2-sided).The P-value= 0.000 was below the P-value= 0.05 significance level and the issue that there was no significant difference between integration of ICT in teaching and students academic performance is rejected.
This meant that integration of ICT in teaching affect students’ academic performance positively. Therefore integration of ICT in teaching was associated with improved students’ performance and not by chance. The observations of the findings of the study were in support of the objective of integration of ICT in teaching to improve students’ academic performance as suggested by observations made by Fry and O’Neill (2002), Spiro (2009), Besterfield, Michna, Besterfield and Sacre, (2003) and Bottoms and O’Neill (2002).
To determine how gender associates with integration of ICT in teaching, cross tabulations was done between gender and levels of integration of ICT in teaching and the data presented by the use of descriptive statistics in form of frequencies, Table 8.
Table 8 Cross-tabulation of Gender and Integration of ICT in Teaching
Level of integration N=405 Gender Of ICT in teaching Male Female Total
Low 150 60 210
Moderate 93 33 126
High 42 27 69
Total 285 120 405
To test whether there was a difference between male and female teachers in the level of integration of ICT in teaching; an inferential statistic Chi-square (χ2) test was done on the cross-tabulated data on Table 8 and the outcome presented in form of Pearson Chi-square values and the data was presented on Table 9. Table 9 Chi-Square Tests for Gender and Integration of ICT in teaching Scale Value df Sig. (2-sided) Pearson Chi-Square 1.272 2 0.530 (NB: The mean difference is significant at the 0.05 level) The Chi-square (χ2) test results showed a Chi-square (χ2) value of 1.272 with 2 degree freedom with a P-value= 0.530 (2-sided). The P-value= 0.530 was above the P-value= 0.05 significance level and the issue that there was no significant difference between gender and level of integration of ICT in teaching was not rejected. This meant that gender does not affect integration of ICT in teaching. Thus integration of ICT in teaching does not depend on gender. To determine how age associates with integration of ICT in teaching, cross tabulations was done between gender and levels of integration of ICT in teaching and the data presented by the use of descriptive statistics in form of frequencies, Table 10. Table 10 Cross-tabulation of Age and Integration of ICT in teaching Level of integration N=405 Age in Years Of ICT in teaching 30 yrs and below above 30 yrs Total Low 67 142 209
Moderate 18 109 127
High 9 60 69
Total 94 311 405
To test whether there was a difference between teachers’ age and the level of integration of ICT in teaching; an inferential statistic Chi-square (χ2) test was done on the cross-tabulated data on Table 10 and the outcome presented in form of Pearson Chi-square values, Table 11.
Table 11 Chi-Square Tests for Age and Integration of ICT in teaching
Scale Value df Sig. (2-sided) Pearson Chi-Square 6.137 2 0.046
(NB: The mean difference is significant at the 0.05 level)
The Chi-square (χ2) test results showed a Chi-square (χ2) value of 6.137 at 2 degree freedom with a P-value= 0.046 (2-sided). The P-value= 0.046 was below the P-value= 0.05 significance level and the issue that there was no significant difference between age and level of integration of ICT in teaching was rejected. This meant that age affect integration of ICT in teaching.
To determine how the teachers’ level of education associates with the level of integration of ICT in teaching, cross tabulations was done between teachers’ highest level of education and levels of integration of ICT in teaching, Table 12.
Table 12 Cross-tabulation of Teachers’ Highest Education Level and Integration of ICT in Teaching
Level of integration N=405 Highest Education Level Of ICT in teaching Diploma University Degree Total
Low 3 207 210
Moderate 39 87 126
High 27 42 69
Total 69 336 405
To test whether there was a difference between teachers’ teachers’ highest level of education and the level of integration of ICT in teaching, an inferential statistic Chi-square (χ2) test was done on the cross-tabulated data on Table 12 and the outcome presented in form of Pearson Chi-square values, Table 13.
Table 13: Chi-Square Test for Teachers’ Highest Education Level and Integration of ICT in Teaching
Scale Value df Sig. (2-sided) Pearson Chi-Square 25.762 2 0.000
(NB: The mean difference is significant at the 0.05 level)
The Chi-square (χ2) test results showed a Chi-square (χ2) value of 25.762 at 2 degree freedom with a P-value= 0.000 (2-sided). The P-value= 0.000 was below the P-value= 0.05 significance level and the issue that there was no significant difference between the teachers’ highest level of education and level of integration of ICT in teaching was rejected. This meant that teachers’ highest level of education affect integration of ICT in teaching. Thus integration of ICT in teaching depends on the teachers’ highest level of education.
7. Conclusion
This study sought to determine the influence of integration of ICT in teaching on students’ academic performance. The result of the study demonstrated that Integration of ICT in teaching indeed influence students’ academic performance. An analysis done at 95% confidence interval for KCSE mean scores for 2008-2011 and standard deviation by level of ICT integration in teaching showed the effect of the integration is positive leading to an improved student KCSE examination performance. The study found out that the teachers who did not integrate ICT in teaching at all had the lowest (4.16) KCSE mean mark. Those who integrated ICT in teaching at low level had a low (4.76) KCSE mean mark, those who integrated ICT at moderate level had a better (5.61) KCSE mean mark and those who highly integrated ICT had the best (6.14) KCSE mean mark. This meant that there is need to emphasize to teachers the importance of integration of ICT in teaching in public secondary schools.
The study found that integration of ICT in teaching does not depend on gender. Both male and female equally integrate ICT in teaching with similar outcome. The study found out that age affect integration of ICT in teaching. This is contrary to other study findings where teachers’ ICT knowledge and skill rather than age influence integration of ICT in teaching. Finally the study found that integration of ICT in teaching depends on the teachers’ highest level of education. This was possible in line with the understanding that teachers interact with ICT during their studies as they carry out research and advance in sourcing information during their studies.
References
Apple Computer, (2002).The impact of technology on students’ achievement.
Best, J.W.& Khan, J.V.(2000).Research in Education. 7th edition. New Delhi: Prentice Hall
Besterfield, D.H, Michna, C.B, Besterfield, G. H & Sacre, M.B.(2003). Total Quality Management. 3rd edition. New Jersey: Pearson Education.
Bober, M.J. 2001. School Information Systems and Their Effects on School Operations and Culture. Journal of Research on Technology in Education, 33(5): Summer.
CEO Forum on Education Technology (2001). School technology and readiness report: Key building blocks for student achievement in the 21st century: integrating digital content. Washington, DC: Author.
Earle, S. D. (2003). The integration of instructional technology in public education. Promises and Challenges. Educational Technology.
Fry, B. & O’Neill, K. 2002. Redesigning Leadership Preparation for Student Achievement. Conference Report. Accessed Oct 04, 2007 from http://www.sreb.org
Gay, L.R. & Airasian, P. (2000). Educational research: Competencies for analysis and application. 6th edition. New Jersey: Prentice Hall.214
Gay, L.R., Mills, G.E., & Airasian, P. (2006). Educational research: Competencies for analysis and application. Upper Saddle River, New Jersey: Pearson Merrill Prentice Hall.
Guilbert , J. J. (1981). Educational Handbook for Health Personnel, Revised Edition, World Health Organisation, Geneva.
Hough & Dancun, (1970). Teaching: Description and Analysis, Addison-Wesley.
Kaplan, R.S & Norton, D.P. 2008. The execution premium: Linking strategy to operations for competitive advantage. Boston: Harvard Business Press.
Kiruhi, M., Githua, B. & Mboroki, G. (2009). Methods of Instruction. A guide for Teachers and Teacher Educators. Kijabe Printing Press, Kijabe.
Lefrancoise, G. R. (1991). Psychology for teaching, 7th edition, Wadsworth Publishing Company, Belmont, Califonia.
Newman, L.W. (2006). Social Research Methods. Quantitative and Qualitative Approaches. New Delhi: Dorling Kindersley.
Wango, G. 2009. School administration and management: Quality assurance and standards schools. Nairobi: Jomo Kenyatta Foundation.
Williams, M. D. (2003). Technology integration in education. In S. C. Tan & F. L. Wong (Eds.), Teaching and learning with technology: An Asia-pacific perspective, Singapore: Prentice Hall, 17-31.