Virtual Machine Services:
An Opportunity for Hardware Customization
Ting Cao
∗, Stephen M Blackburn
∗, and Kathryn S McKinley
†∗Australian National University †Microsoft Research † The University of Texas at Austin
{Ting.Cao, Steve.Blackburn}@anu.edu.au, [email protected]
Abstract—This paper considers the intersection of two comput-ing trends: (1) Computer architecture design is now constrained by power, instead of transistor count, which is leading to archi-tecture heterogeneity and customization. (2) Software developers increasingly choose managed languages, such as JavaScript, PHP, Java, and C#. Managed languages require a VM (Virtual Machine), which executes services such as profiling, compilation, scheduling, and memory management together with every appli-cation. The ubiquity of VM services makes them a perfect test case for potential improvements in energy through the use of hardware heterogeneity. This paper uses systematic exploration of hardware features such as frequency and voltage scaling, cache size, hardware parallelism, and gross microarchitecture design on the power, and performance of VM services. It thus evaluates this potential on actual hardware, rather than through simulation. We study Just-in-Time (JIT) compilation, interpretation, and memory management. We find that VM services consume around 20% of energy on average. Compared to application code, the memory manager and interpreter offer substantially different workloads and do not uniformly benefit from high performance architectural features. A heterogeneous multicore processor thus has the potential to substantially improve energy of managed applications with cores customized for VM services.
I. INTRODUCTION
Computer systems are facing an energy crisis. Moore’s Law continues, but because Dennard scaling is reaching its limits, we are confronted with “dark silicon” [1], [2] — the fraction of on-chip transistors powered at once will decrease exponentially. For mobile devices, battery life always falls behind demand. In data centers, the cost of electricity is now the top budgetary consideration [3]. The EPA estimates that U.S. data center electricity consumption cost over $4.5 billion in 2006 and projected growth to $7.4 billion in 2011 [4]. Consequently, Google purchases computers with the best performance per energy (PPE) dollar, rather than the best absolute performance [5], and the Japanese Green IT Council promotes PPE as a world standard metric for data center efficiency [6]. The higher a machine’s PPE is, the more effectively it uses the available energy budget.
Researchers are proposing to use architecture customization and heterogeneity to improve PPE [7], [1], [8]. For exam-ple, some propose a heterogeneous processor that combines high performance cores with simple cores (low power, low performance) and then assign critical and non-critical threads in a multithreaded application accordingly to improve PPE. Another example of the heterogeneous custom design philos-ophy is a GPU. The GFLOPs per Watt of an AMD GPU 9270 is about 6 times higher than a general purpose Core
i7-920 [9]. However, finding an appropriate workload is a necessary first step for hardware customization. This paper explores whether Virtual Machine (VM) services are a suitable target for customization.
VM services are an attractive choice because they are ubiquitous, unlike application specific-functionality, e.g., mpeg encoding. Programmers are increasingly choosing managed languages. For example, business applications increasingly use Java and C#, and the vast majority of client and server side web applications use JavaScript and PHP. For portability, these languages require a Virtual Machine execution environment that executes code via a Just-in-Time (JIT) compiler and/or an interpreter, and they require garbage collection (GC) to automatically reclaim memory. VM services typically include scheduling and profilers as well, but we focus here on JIT, the interpreter, and GC. Since VM services run together with every application, if we can customize modern hardware for these services such that they provide high PPE, we will improve all managed applications.
We explore our hypothesis using controlled configurations of stock hardware executing VM services from two Java Virtual Machines (Jikes RVM and Oracle JDK) and DaCapo Java Benchmarks [10]. We choose Java because it has mature VM technology and sophisticated benchmarks. We explore power, performance, and energy responses on three Intel microarchitectures: Sandy Bridge Core i7-2600 (32nm) and Core i3-2120 (32nm), representing high performance designs, and an Atom D510 (45nm), representing a low power design. We use the Hall effect sensor methodology of Esmaeilzadeh et al. [11] and the Sandy Bridge’s on-chip RAPL power meters [12]. As far as we are aware, no other stock processor exposes power meters. We configure the BIOS to evaluate the effect of frequency, CMP (Chip Multiprocessor) core count, SMT (Simultaneous Multithreading), memory band-width, cache size, and gross architecture. We compare the power and performance characteristics of VM services to the applications they support.
The results show that VM services (interpreter, JIT, and GC) consume on average around 20% of total energy (ranging from 10% to 55%), making them a promising target for specialization. Furthermore, the interpreter and GC workloads differ substantially from the applications themselves. Modern high-performance architecture features executing at the highest frequency with the most hardware parallelism, bandwidth, and cache all increase the PPE of the JIT and the Java
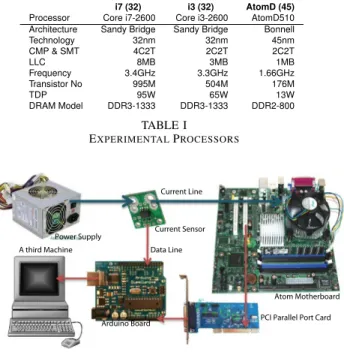
i7 (32) i3 (32) AtomD (45)
Processor Core i7-2600 Core i3-2600 AtomD510
Architecture Sandy Bridge Sandy Bridge Bonnell
Technology 32nm 32nm 45nm CMP & SMT 4C2T 2C2T 2C2T LLC 8MB 3MB 1MB Frequency 3.4GHz 3.3GHz 1.66GHz Transistor No 995M 504M 176M TDP 95W 65W 13W DRAM Model DDR3-1333 DDR3-1333 DDR2-800 TABLE I EXPERIMENTALPROCESSORS
PowerSupply CurrentSensor
Atom Motherboard PCIParallelPortCard Arduino Board
A third Machine
CurrentLine
Data Line
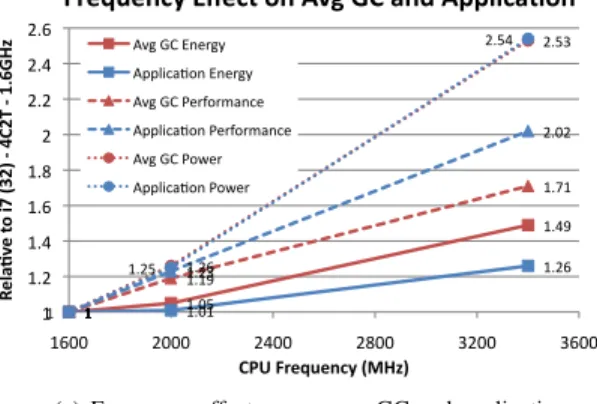
Fig. 1. Power measurement with a Hall effect sensor on Atom
applications themselves. However, many of these hardware features are PPE inefficient for the GC and interpreter —except for hardware parallelism, and for GC, memory bandwidth.
Our results indicate that executing VM services on high performance CPUs is inefficient and that a heterogeneous processor with a high performance core and customized simple cores has the potential to improve the PPE of VM services substantially, and thus the PPE of all managed applications.
The two main contributions of this paper are: (1) The first evaluation of power, performance, and energy of VM services as a function of hardware features. (2) The finding that VM services are promising candidates for hardware heterogeneity and customization.
II. EXPERIMENTAL METHODOLOGY
HARDWARE. Table I lists characteristics of our three
exper-imental machines. Hardware parallelism is indicated in the CMP & SMT row asnCmT: the machine has n cores (CMP) and m simultaneous hardware threads (SMT) on each core. The Atom and Sandy Bridge families are at the two ends of Intel’s product line. Atom has an in-order pipeline, small caches, a low clock frequency, and is low power. Sandy Bridge is Intel’s newest generation high performance architecture. It has an out-of-order pipeline, sophisticated branch prediction, prefetching, Turbo Boost power management, other optimiza-tions, and large caches. We use two Sandy Bridge machines to explore hardware variability, such as cache size, within a family.
POWER MEASUREMENT. This paper uses BIOS configuration,
the Sandy Bridge’s on-chip RAPL (Runtime Average Power Limit) energy meters [12], and the Hall effect sensor method-ology developed by Esmaeilzadeh et al. [11].
On the Sandy Bridge, we use Intel’s on-chip RAPL energy measurement [12]. RAPL is currently only available on
In-tel Sandy Bridge 06 2AH processors. RAPL includes three principal components: power measurement logic, a power limiting algorithm, and memory power limiting control. The power measurement logic uses activity counters and predefined weights to record accumulated energy in MSRs (Machine State Registers). The values in the registers are updated every 1msec, and overflow about every 60 seconds [13]. Reading the MSR, we obtain package, core and uncore energy. We calculate power as energy / runtime. A key limitation of RAPL is that it can not measure short events, i.e., less than 1msec. Unfortunately, the GC and JIT VM services often occur in phases of less than 1msec.
Figure 1 shows the Pololu’s ACS714 Hall effect linear current sensor positioned on the mother board between the power supply and chip. We read the output using an Arduino board with an AVR microcontroller and a sample rate of 5KHz. We connect a PCI card to the digital input of the Arduino board to accurately mark the start and end of VM services. The latency is less then 200µsec. One limitation of this method is that it includes the voltage regulator’s power consumption. We compared the Hall effect sensor to RAPL measurements; power is higher for the Hall effect sensor: 4.8% average, ranging form 3% to 7%. We thus correct for the voltage regulator by subtracting 5% from Hall effect sensor measurements.
We use PPE and energy to calculate efficiency. The Hall effect sensor measures power, so we calculate energy as the product of power and running time. RAPL presents measures of energy directly. PPE is performance / energy, and we calculate performance as 1 / run time for a given workload. We compute relative PPE values based on the experiment. For example, when we compute PPE of hardware feature A compared to feature B running the same workloads, we calculate:
P P EA
P P EB
=
workloadA/run timeA
energyA
workloadB/run timeB
energyB
=run timeB·energyB
run timeA·energyA
BENCHMARKS AND VM SERVICES. We use 10
bench-marks: bloat, eclipse, and fop (Dacapo-2006); avrora, luin-dex, lusearch, pmd, sunflow, and xalan (Dacapo-9.12); and pjbb2005 [10]. Fop, luindex and bloat are single threaded. The others are multithreaded. These benchmarks are non-trivial real-world open source Java programs [10]. When using Jikes RVM we usereplay compilation. We follow Blackburn et al.’s best practices for Java performance analysis [10].
In particular, replay compilation removes the nondeter-minism of the adaptive optimization system. It gathers a compilation profile on a previous execution that dictates what the adaptive compiler chose to do. We execute the benchmark again, apply the profile all at once on the second iteration, turn off the JIT, and then execute and measure the application to produce repeatable results with small variation. Because the unit of work for the JIT when executing normally is too fine grained for us to measure, we perform and measure all JIT work at once from a replay profile. To decrease the effect
0% 10% 20% 30% 40% 50% 60% 70% 80% 90% 100% Ene rg y Tim e Ene rg y Tim e Ene rg y Tim e Ene rg y Tim e Ene rg y Tim e Ene rg y Tim e Ene rg y Tim e Ene rg y Tim e Ene rg y Tim e Ene rg y Tim e Ene rg y Tim e
avrora eclipse lusearch pmd sunflow xalan pjbb2005 bloat fop luindex Avg Energy and Run,me Frac,on
ApplicaHon JIT GC
Fig. 2. Fraction of energy and time in the application, JIT, and GC
of GC when measuring the JIT, we use Jikes RVM’s default generational Immix GC, since it performs the best, and set the heap size to be 4 times minimum generational Immix GC size.
We use three stop-the-world full heap GCs (Immix, Mark-Sweep and SemiSpace) from MMTk in Jikes RVM [14], [15]. These algorithms are highly tuned [16]. We use relatively mod-est heap sizes: 1.5 times minimum heap size of SemiSpace. We choose full-heap collectors because concurrent GC is not eas-ily separable and nursery collections are too short to measure with current methodologies. Because the GC algorithms differ in where they put objects and how efficiently they use memory, the applications’ memory behavior is a function of the GC. We therefore compute the average application (mutator only) time over the three GC algorithms. Since all modern GCs derive from these algorithms, we believe that the results are representative.
We measure interpreter costs in Oracle HotSpot JDK 1.6.0 because Jikes RVM does not have a bytecode interpreter. Jikes RVM immediately compiles to machine code and then adaptively compiles to higher optimization levels. HotSpot interprets bytecodes and then adaptively compiles to machine code. The HotSpot experiment uses the default GC (par-allel copying nursery and serial Mark-Sweep-Compact old generation) and heap size configured with -server flag. The interpreter and GC are not separated, we measure them together.
III. EXPERIMENTALRESULTS
This section first presents the fraction of total time and energy spent performing VM services. It then compares the power, performance, and energy response of the application, GC, JIT, and interpreter as a function of five hardware features: frequency scaling, memory bandwidth, cache size, hardware parallelism, and gross architecture.
VM SERVICES RESOURCE CONSUMPTION. This experiment
computes the fraction of energy and time for the Jikes RVM VM services on thei7, using generational Immix GC with 1.5
×minimum heap size. Prior work and performance regression tests shows that this configuration optimizes total time [15], [16]. Performance is the actual measured time of GC and JIT using replay with a compilation plan from the first iteration (start up versus steady state). We use this methodology because the RAPL is not fine grain enough to measure the JIT in
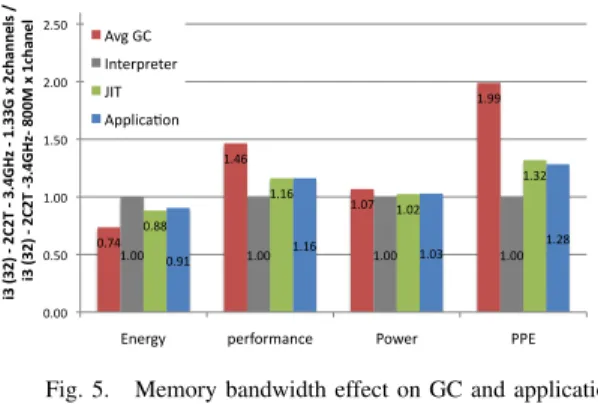
1 1.05 1.49 1 1.01 1.26 1 1.19 1.71 1 1.23 2.02 1 1.26 2.53 1 1.25 2.54 1 1.2 1.4 1.6 1.8 2 2.2 2.4 2.6 1600 2000 2400 2800 3200 3600 Re la %v e to i7 (3 2) -‐ 4C 2T -‐ 1. 6G H z CPU Frequency (MHz)
Frequency Effect on Avg GC and Applica%on Avg GC Energy Applica<on Energy Avg GC Performance Applica<on Performance Avg GC Power Applica<on Power
(a) Frequency effect on average GC and application.
1.10 1.14 1.16 1.13 1.22 0.97 1.15 1.34 1.15 1.60 0.90 1.00 1.10 1.20 1.30 1.40 1.50 1.60
MarkSweep Immix SemiSpace Avg GC Applica?on
Re la %v e to i7 (3 2) -‐ 4C 2T -‐ 1. 6G H z
Frequency Scaling PPE for GC and Applica%on
(b) Frequency scaling PPE for three GC and application at 2.0GHz (light) and 3.4GHz (dark).
1.00 1.10 1.45 1.00 1.04 1.31 1.00 1.03 1.17 1.00 1.01 1.05 1.00 1.05 1.10 1.15 1.20 1.25 1.30 1.35 1.40 1.45 1.50 1600 2000 2400 2800 3200 3600 Re la %v e to i7 (3 2) -‐ 4C 2T -‐ 1. 6G H z CPU Frequency (MHz)
Core Cycles Change for GC and Applica%on MarkSweep
Immix SemiSpace Applica;on
(c) Frequency effect on core cycles of three GC and application.
Fig. 3. Frequency effect on GC and application
vivo. Since a nursery GC is also too short for RAPL, we compute GC energy as the difference of total energy and the average application energy, established by measuring it with the three full-heap collectors. Figure 2 shows the result. The JIT consumes between 4 and 30% of all energy; GC consumes between 1 and 40%; and together they consume 28% on average, a substantial fraction of total energy.
FREQUENCY SCALING. On thei7, we only change frequency,
scaling it from 1.6GHz to 3.4GHz and normalize to 1.6GHz. Figure 3(a) shows the average effect of frequency on energy, performance, and power for the GC and application. Increas-ing frequency increases the power at the same rate for GC and applications. However, application performance increases
1.00 0.96 1.04 1.00 1.00 0.96 1.03 1.25 2.05 1.00 1.24 2.05 1.00 1.19 2.13 1.00 1.19 2.11 0.90 1.10 1.30 1.50 1.70 1.90 2.10 2.30 2.50 1600 2100 2600 3100 3600 Re la %v e to i7 (3 2) -‐ 1C 1T -‐ 1. 6G H z CPU frequency (Mhz)
Frequency Effect on JIT and Applica%on
JIT Energy Applica;on Energy JIT Performance Applica;on Performance JIT Power Applica;on Power
(a) Frequency effect on JIT and application.
1.00 0.99 1.16 1 1.01 1.26 1.00 1.25 2.10 1 1.23 2.02 1.00 1.23 2.43 1 1.25 2.54 0.90 1.10 1.30 1.50 1.70 1.90 2.10 2.30 2.50 1600 2100 2600 3100 3600 Re la %v e to i7 (3 2) -‐ 4C 2T -‐ 1. 6G H z CPU frequency (Mhz)
Frequency Effect on Interpreter and Applica%on
Interpreter Energy Applica:on Energy Interpreter Performance Applica:on Performance Interpreter Power Applica:on Power
(b) Frequency effect on interpreter and application.
Fig. 4. Frequency effect on JIT and interpreter
approximatively linearly by 102%, whereas GC performance increases by 70%, causing GC energy to increase by 49%, whereas application energy increases by 26%.
Figure 3(b) compares the three collectors’ and applications’ PPE as a function of frequency. Application PPE increases by 60%, whereas GC PPE increases by only 15%. The worst case is MarkSweep — PPE at 3.4GHz decreases. SemiSpace gains most benefit from a high clock frequency, but it still benefits much less than the applications. Relative GC performance differs by over 22% on average. SemiSpace is worst, then MarkSweep, and Immix is best [15]. Increasing frequency is inefficient because GC has poor locality and accesses mem-ory at a higher rate than the average application. Hardware performance counters reveal that SemiSpace’s last level (LL) cache misses per instruction are 3+ times greater than the applications; Immix GC is 5+ times; and MarkSweep is 10+ times. Figure 3(c) shows the effect of this latency: the relative number of cycles increases with frequency between 17% to 45% for GC, but only by 5% for applications.
The JIT compiler behavior closely mimics the applications themselves. JIT is not memory-intensive. Although JIT com-pilation is parallelizable, Jikes RVM JIT is single threaded. We thus configure the i7 to be 1C1T for this experiment. Figure 4(a) shows that the JIT and applications essentially have the same power, performance, and energy response to frequency increases.
Figure 4(b) shows the interpreter has even higher perfor-mance increase and lower energy consumption than normal
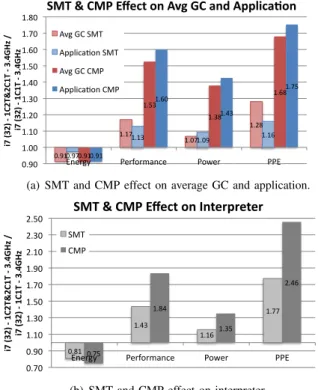
0.74 1.46 1.07 1.99 1.00 1.00 1.00 1.00 0.88 1.16 1.02 1.32 0.91 1.16 1.03 1.28 0.00 0.50 1.00 1.50 2.00 2.50
Energy performance Power PPE
i3 (32) -‐ 2 C2 T -‐ 3.4GHz -‐ 1.33G x 2ch an nel s / i3 (3 2) -‐ 2C 2T -‐3 .4 G H z-‐ 8 00 M x 1c ha ne l
Memory Bandwidth Effect on VM services and ApplicaJon
Avg GC Interpreter JIT ApplicaEon
Fig. 5. Memory bandwidth effect on GC and application
1.04 1.07 1.12 1.02 1.06 1.03 1.09 1.00 1.10 1.10 1.10 1.07 1.06 1.13 0.99 0.97 0.99 1.01 1.03 1.05 1.07 1.09 1.11 1.13
Energy Performance Power PPE
i7 (3 2) -‐ 2C 2T -‐ 3. 4G H z -‐ 8 M LL C / i3 (3 2) -‐ 2C 2T -‐ 3. 4G H z -‐ 3 M LL C
LL Cache Size Effect on VM Services and ApplicaFon
Avg GC Interpreter JIT ApplicaDon
Fig. 6. LL cache size effect on GC and application
applications because it has good cache locality. The memory and LL cache access rates of the interpreter are 18% and 29% respectively of the applications. A high clock frequency is energy-efficient for the JIT, interpreter and applications, but not for GC on the i7.
MEMORY BANDWIDTH. Figure 5 shows that increasing
mem-ory bandwidth provides substantial performance and conse-quently energy improvements for memory-bound GC. The PPE increase for GC ranges from 66% (SemiSpace) to 156% (MarkSweep) with an average of 200%. For application and JIT, increasing memory bandwidth increases performance by only 16% and decreases energy by about 10%, thus PPE in-creases by 30%. Since the interpreter has good cache locality, it is insensitive to memory bandwidth changes. Increasing memory bandwidth disproportionately benefits GC compared to applications and other services.
LAST-LEVEL CACHE SIZE. One way to use the abundant
transistors on chip is to increase cache size. This experiment roughly evaluates the cache size effect on GC and applications using thei7andi3. We configure them with the same hardware parallelism (2C2T) and clock frequency (3.4G). Because they have very similar architectures, the biggest difference is that the i7’s LL cache is 8MB and i3’s is 3MB. We choose four benchmarks with large minimum heap sizes of more than 100MB (bloat, eclipse, pmd and pjbb2005) to ensure that the live object set is significantly larger than LL cache size. In fact the increase in LL cache size from 3MB to 8MB is approximately 3% of the average maximum live objects total size. Figure 6 shows the LL cache size has similar effects on GC and applications. The three GC algorithms have about the same response as well (not shown). When the LL
0.91 1.17 1.07 1.28 0.97 1.13 1.09 1.16 0.91 1.53 1.38 1.68 0.91 1.60 1.43 1.75 0.90 1.00 1.10 1.20 1.30 1.40 1.50 1.60 1.70 1.80
Energy Performance Power PPE
i7 (32) -‐ 1C 2T &2C 1T -‐ 3. 4G Hz / i7 ( 32) -‐ 1C1T -‐ 3.4GHz
SMT & CMP Effect on Avg GC and ApplicaDon Avg GC SMT
ApplicaDon SMT Avg GC CMP ApplicaDon CMP
(a) SMT and CMP effect on average GC and application.
0.81 1.43 1.16 1.77 0.75 1.84 1.35 2.46 0.70 0.90 1.10 1.30 1.50 1.70 1.90 2.10 2.30 2.50
Energy Performance Power PPE
i7 (32) -‐ 1C 2T &2C 1T -‐ 3. 4G Hz / i7 (32) -‐ 1C 1T -‐ 3. 4G Hz
SMT & CMP Effect on Interpreter SMT
CMP
(b) SMT and CMP effect on interpreter.
Fig. 7. Hardware parallelism effect on GC, interpreter and application
cache increases from 3MB to 8MB, the average performance increase for GC and application is about 6%, and energy increases by about 5%, and thus there is no significant change in PPE. Because the interpreter has very good locality, it benefits the least from an increase in LL cache size and results a drop in PPE. The interpreter contrasts with the JIT which has a significant performance gain from an increase in cache size, mainly due to the size of short lived data structures generated during code analysis, yielding an increase in PPE of 10%. GC, interpreter and application show only a modest increase in performance with a similar increase in energy. Thus, the increase in cache size, for all except the JIT, is not an effective use of transistors for these workloads.
HARDWARE PARALLELISM. Esmaeilzadeh et al. show that
hardware parallelism from SMT or CMP benefits simple in-order cores, and can compensate for a single thread’s per-formance loss. We study the effects of hardware parallelism on GC, and interpretation. All the GC algorithms are parallel and utilize all available hardware parallelism. The JIT is not included as it is single threaded in Jikes RVM. We use the multithreaded benchmarks executing on the i7 with 2C1T and 1C1T at 3.4GHz for CMP, 1C2T and 1C1T for SMT. VMs adjust software parallelism to the available hardware parallelism. For instance, the VM allocates thread-specific resources, such as thread-local allocation blocks, that increase with the number of threads. This experiment uses energy per instruction retired and instruction retired per second instead of total energy and performance to eliminate possible workload increases at more threads. Figure 7(a) shows increasing the number of cores improves both GC and multithreaded appli-cations’ PPE similarly. For GC, doubling the number of cores decreases energy by 10%, increases performance by 56%, and
2.21 2.09 4.60 0.95 1.93 2.40 4.52 1.24 1.47 2.93 2.25 1.99 1.55 3.08 4.61 1.99 0.00 0.50 1.00 1.50 2.00 2.50 3.00 3.50 4.00 4.50
Energy Performance Power PPE
i3 (32) -‐ 2C 2T -‐ 1. 6G Hz / At om D 51 0 (3 2) -‐ 2C 2T -‐ 1. 66 G H z
Gross Architecture Effect on VM Services and ApplicaIon
Avg GC Interpreter JIT ApplicaEon
Fig. 8. Gross architecture effect on VM services and application
thus improves PPE by 72%. SMT does not effect PPE as much as CMP, but effectively decreases energy. SMT requires very little additional power as compared to CMP, which is important when the power budget is limited.
The hardware parallelism, incredibly, improves PPE for the interpreter. Figure 7(b) shows that the use of SMT decreases the energy by 20% and CMP decreases energy by 25%. The PPE increases for SMT and CMP are 77% and 146%; both are much higher than normal application or GC. In summary, SMT is efficient and CMPs are very efficient for GC, and both improve PPE for interpreter. These results show that it will be possible to improve GC and interpreter PPE by adding more simple cores.
GROSS MICROARCHITECTURE. Figure 8 compares gross
mi-croarchitecture using the AtomD and i3, controlling for frequency (1.66G for AtomD and 1.6G for i3), hardware parallelism (2C2T), and memory bandwidth (800 MHz, one channel). The result suggests that the high performance archi-tectural features in the i3 are not effective for VM services. This methodology is not perfect and shows the drawback of using real hardware versus a simulator, in which the experi-ment could hold more features constant. The most important difference in the two machines is their process technology. Esmaeilzadeh et al. shows that shrinking technology from 45nm to 32nm for the same microarchitecture and controlling for frequency decreases power by 45% or more, while the providing the same performance. To estimate the process effect, we project the AtomD power consumption data to 32nm by multiplying with a projection factor of 55%. Another important difference is memory hierarchy. Atom has a two level cache hierarchy and the L2 is 1MB. The i3 has a three level cache hierarchy and a 3MB L3. However, Section III shows that the effect of LL cache is a tradeoff between performance and energy. We thus assume the cache difference will not significantly affect the PPE value.
Figure 8 shows the average of the three GC algorithms. Compared to AtomD, the i3benefits applications more than VM services. On thei3, application performance increases by about 200%, energy just increases by 55%, and thus applica-tion PPE is doubled (100% increase). For the interpreter, the energy increase is a remarkable 93%, and thus the interpreter’s PPE increases by only 24%. The worst is GC — the GC’s PPE
decreases as the energy increases 121%.
In summary, a simple architecture is more efficient for VM services, and given the fraction of time spent in VM services, hardware customization for VM services is a promising direc-tion.
IV. RELATED WORK
GC energy consumption. Velaso et al. study the energy consumption of state-of-the-art GCs for designing embed-ded systems [17]. They use Jikes RVM, Dynamic Sim-pleScalar (DSS) [18], and combine DSS with a CACTI energy/delay/area model to calculate energy. Their energy simulation results follow the performance measurements from prior work [19]. However, their simulation results show GC consumes a disproportionate amount of energy, but our results refute this finding. Chen et al. study mark-sweep GC using an energy simulator and the Shade SPARC simulator [20]. They improve leakage energy by using a GC-controlled optimization to shut off memory banks that do not hold live data. Diwan et al. measure four different memory management strategies on a flexible research platform — Itsy Pocket Computer [21]. Their results demonstrate that the choice of GC algorithm changes the program’s energy consumption. Compared to prior work, this paper focuses more broadly on hardware customization for VM services, rather than on designing an energy-efficient GC algorithm or improving energy with GC.
VM hardware customization. Meyer et al. explore hard-ware for GC [22][23][24]. They develop a novel processor architecture with an objected-based RISC core and a GC core using VHDL and generate an FPGA. Their goals are to elimi-nate GC pauses for real-time embedded systems and improve safety and reliability given stringent safety requirements, such as satellites and aircrafts. In comparison, we focus on general purpose hardware and software. Azul systems built a custom chip to run Java business applications and severs [25]. They redesign about 50% of CPU and build their own OS and VM. The chips have special GC instructions, such as read and write barriers, but do not have specialized GC cores. Our work focuses more broadly on VM services and explores if modest hardware customization can improve overall PPE.
V. CONCLUSION
Our work configures and measures real hardware to deter-mine the effect of architectural features on PPE of VM services on applications. The paper establishes that customized cores for VM services has the potential to improve PPE and help address the dark silicon problem.
REFERENCES
[1] G. Venkatesh, J. Sampson, N. Goulding, S. Garcia, V. Bryksin, J. Lugo-Martinez, S. Swanson, and M. B. Taylor, “Conservation cores: reducing
the energy of mature computations,” inASPLOS, J. C. Hoe and V. S.
Adve, Eds. ACM, 2010, pp. 205–218.
[2] H. Esmaeilzadeh, E. R. Blem, R. S. Amant, K. Sankaralingam, and
D. Burger, “Dark silicon and the end of multicore scaling,” inISCA,
R. Iyer, Q. Yang, and A. Gonz´alez, Eds. ACM, 2011, pp. 365–376.
[3] X. Fan, W.-D. Weber, and L. A. Barroso, “Power provisioning for a
warehouse-sized computer,” inACM/IEEE International Symposium on
Computer Architecture, 2007, pp. 13–23.
[4] E. P. Agency, “Report to congress on server and data center energy efficiency,” U.S. Environmental Protection Agency, pp. 109–431, 2007.
[5] Wikipedia, “Google platform.” 2009. [Online]. Available: http:
//en.wikipedia.org/wiki/Google platform
[6] J. G. I. P. Council. (2011) Concept of new metrics for data center energy efficiency. [Online]. Available: http://www.greenit-pc.jp/e/topics/ release/100316 e.html
[7] T. Y. Morad, U. C. Weiser, A. Kolodnyt, M. Valero, and E. Ayguad´e, “Performance, power efficiency and scalability of asymmetric cluster
chip multiprocessors,”Computer Architecture Letters, vol. 5, no. 1, pp.
14–17, 2006.
[8] S. Borkar and A. Chien, “The future of microprocessors,”
Communica-tions of the ACM, vol. 54, no. 5, pp. 67–77, 2011.
[9] D. Bacon, “Virtualization in the age of heterogeneous machines,” in
Proceedings of the 7th ACM SIGPLAN/SIGOPS international conference on Virtual execution environments. ACM, 2011, pp. 1–2.
[10] S. M. Blackburn, R. Garner, C. Hoffman, A. M. Khan, K. S. McKinley, R. Bentzur, A. Diwan, D. Feinberg, D. Frampton, S. Z. Guyer, M. Hirzel, A. Hosking, M. Jump, H. Lee, J. E. B. Moss, A. Phansalkar, D. Ste-fanovi´c, T. VanDrunen, D. von Dincklage, and B. Wiedermann, “The DaCapo benchmarks: Java benchmarking development and analysis,” in
ACM SIGPLAN Conference on Object-Oriented Programing, Systems, Languages, and Applications, Oct. 2006, pp. 169–190.
[11] H. Esmaeilzadeh, T. Cao, Y. Xi, S. M. Blackburn, and K. S. McKinley, “Looking back on the language and hardware revolutions: measured
power, performance, and scaling,” in ASPLOS, R. Gupta and T. C.
Mowry, Eds. ACM, 2011, pp. 319–332.
[12] H. David, E. Gorbatov, U. R. Hanebutte, R. Khanaa, and C. Le, “Rapl:
Memory power estimation and capping,” inISLPED, V. G. Oklobdzija,
B. Pangle, N. Chang, N. R. Shanbhag, and C. H. Kim, Eds. ACM,
2010, pp. 189–194.
[13] I. Coorporation, “Intel 64 and ia-32 architectures software developer’s manual volume 3a: System programming guide, part 1,” pp. 643–655, 2011.
[14] S. M. Blackburn, P. Cheng, and K. S. McKinley, “Myths and
reali-ties: the performance impact of garbage collection,” inSIGMETRICS,
E. G. C. Jr., Z. Liu, and A. Merchant, Eds. ACM, 2004, pp. 25–36.
[15] S. M. Blackburn and K. S. McKinley, “Immix: A mark-region garbage collector with space efficiency, fast collection, and mutator locality,” in
Programming Language Design and Implementation, Tuscon, AZ, Jun. 2008, pp. 22–32.
[16] The Jikes RVM Research Group, “Jikes Open-Source Research Virtual Machine, regression tests,” 2011. [Online]. Available: http:
//www.\-jikesrvm\-.\-org
[17] J. Velasco, D. Atienza, K. Olcoz, F. Catthoor, F. Tirado, and J. Mendias, “Energy characterization of garbage collectors for dynamic applications
on embedded systems,”Integrated Circuit and System Design. Power
and Timing Modeling, Optimization and Simulation, pp. 908–915, 2005. [18] X. Huang, J. E. B. Moss, K. S. McKinley, S. Blackburn, and D. Burger, “Dynamic SimpleScalar: Simulating Java virtual machines,” University of Texas at Austin, Department of Computer Sciences, Technical Report TR-03-03, Feb. 2003.
[19] S. M. Blackburn, P. Cheng, and K. S. McKinley, “Myths and realities:
The performance impact of garbage collection,” inSIGMETRICS, NY,
NY, Jun. 2004, pp. 25–36.
[20] G. Chen, R. Shetty, M. Kandemir, N. Vijaykrishnan, M. Irwin, and M. Wolczko, “Tuning garbage collection in an embedded java
environ-ment,” inHigh-Performance Computer Architecture, 2002. Proceedings.
Eighth International Symposium on. IEEE, 2002, pp. 92–103. [21] A. Diwan, H. Lee, and D. Grunwald, “Energy consumption and garbage
collection in low-powered computing,” 2002.
[22] O. Horvath and M. Meyer, “Fine-grained parallel compacting garbage
collection through hardware-supported synchronization,” inICPP
Work-shops, W.-C. Lee and X. Yuan, Eds. IEEE Computer Society, 2010, pp. 118–126.
[23] S. Stanchina and M. Meyer, “Mark-sweep or copying?: a ”best of both worlds” algorithm and a hardware-supported real-time implementation,”
inISMM, G. Morrisett and M. Sagiv, Eds. ACM, 2007, pp. 173–182.
[24] ——, “Exploiting the efficiency of generational algorithms for
hardware-supported real-time garbage collection,” inSAC, Y. Cho, R. L.
Wain-wright, H. Haddad, S. Y. Shin, and Y. W. Koo, Eds. ACM, 2007, pp.
713–718.
[25] C. Click, “Azuls experiences with hardware/software co-design. keynote
presentation at the acm sigplan,” inSIGOPS International Conference