Project Title: Food Product Tracing Technology Capabilities and Interoperability PI: Dr. Jennifer Cleveland McEntire
Project Start Date: September 2010 End Date: August 2011 Period covered in this report: 2/2011 – 4/2011
1. Aims of the project
The aims of the project are to
a) compare and contrast the capabilities of different traceability solutions currently in the market.
b) identify the potential opportunities and challenges to enable interoperability between the different traceability solutions.
c) refine and test IFT-coined product tracing terms, “Critical Tracking Events” (CTEs) and “Key Data Elements” (KDEs).
2. Aims (tasks, milestones, deliverables) addressed in this progress report
The following tasks, milestones and deliverables are addressed in this progress report: a) Task: Gather (and create) the straightforward supply chain data of a multi-ingredient
product used to test the current capabilities of the traceability solutions.
b) Milestone: Conduct in-person meetings with 8 product-tracing technology providers. 3. Results obtained - including description AND presentation in tabular form and figures
(tables/figures required for Agent Behavior projects; utilize for other research themes as appropriate)
A conference call with the expert panel was held on February 1, 2011, to discuss updates to the data collection of the real-world supply chain, as well as the modeling of the simulated supply chain. A summary of the supply chain data collected from a ground beef company and a spice company was shared with the expert panel. The following individuals participated in the phone call: - Joe Scimeca - Bruce Welt - Kurt Collins - Ben Miller - Brenda Lloyd - Amir Mokhtari - Jennifer McEntire - Sarah Ohlhorst - Tejas Bhatt.
A literature review of the traceability solutions was conducted by compiling relevant information from company/product websites and web searches in the public domain into a document (see attachment: “Overview of Traceability Solution Proviers.doc”). However, to gain
a better understanding of the technical aspects, we evaluated hands-on, live, or webcast demonstrations of the nine traceability solutions. As a recap, the nine solutions providers participating in this task are
- FoodLogiQ - Afilias - Operations Technologies - Trace Tracker - Scoring Ag - Path Tracer
- Corporate Health Initiatives Consulting - IBM
- Trace Register.
Two standardized questionnaires were developed to objectively evaluate the solutions. The first questionnaire analyzed the critical tracking events and the key data elements captured by each traceability solution, along with an exploration of their limitations and challenges in
dealing with the mock supply chain data and the scenarios. The second questionnaire examined the technological capabilities of each solution in the following broad categories:
- Overall architecture - User experience
- Administration and security
- Traceability-related characteristics (including interoperability features).
A pilot test was conducted using one of the traceability solution providers in an attempt to verify and validate the completeness of the test data and the applicability of the two test scenarios. This solution provider was asked to input a draft of the data set and run the
scenarios through their system and share the results with IFT. Because this was intended to be a pilot, the company was given about 2 weeks to evaluate and enter the test data into their systems, following which the two scenarios were shared with them to solicit their feedback.
The remaining eight solution providers (with the exception of the one that agreed to serve as a pilot test for this project) were provided with the test data set in early March and were given about 1 week to enter the data into their technology. Once data entry was completed, each solution provider was given the first scenario, and we recorded their time to respond. Once the first scenario was completed, the second scenario was forwarded to them and we again recorded their time to respond. We scheduled 3-hour face-to-face meetings (towards the end of March and beginning of April) with each of the traceability solutions providers in order to better understand their approach in entering the test data and solving the scenarios.
4. Analysis and interpretation of results
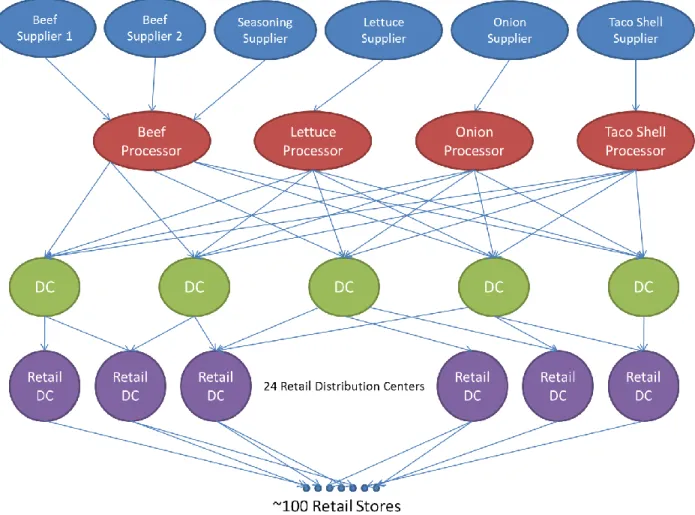
During the conference call in February, a simulated supply chain (shown in Figure 1) was finalized with input from the expert panel. The supply chain included five bulk ingredients (beef, seasoning, lettuce, onions and taco shells), four processors (seasoned beef, shredded lettuce, diced onions and taco shells), one distribution company with five warehouse locations, and one retailer with twenty four retail distribution centers (with each retail distribution
company connected to an average of four retail locations). Two scenarios were developed using the simulated supply chain to test the effectiveness of the various traceability solutions. The first scenario involved a retail location asking for a trace back to determine all ingredients that were used to create a specific batch/lot number, and then trace forward to determine all the product lots that used these ingredients. The second scenario involved tracking all products consumed between a specific date-range at a specific retail location that were linked to a foodborne illness outbreak of tacos. Because the primary goal of this phase of the project was to develop a baseline of the capabilities of the different traceability solutions, we decided to keep the scenarios as simple as possible, focusing on the use of the traceability solutions during the investigation of a mock outbreak and setting up the stage to create a more appropriate interoperability test based on the findings of this phase. The simulated data were constructed such that some errors were intentionally introduced.
During the live demonstrations of the traceability solutions, most of the solution providers were able to show how their systems work in practice using some demo data. The
demonstrations included some general administrative information regarding the wide range of clients each solution provider currently supports, a brief history of the company, and
membership options available for potential users. More specific data were also demonstrated by each solution provider, including the overall architecture of their system (e.g., operating system used, required operating system on the client side, required database, and preferred input/output data protocols). During the live demonstrations, we also received hands-on experience regarding how potential users interact with these traceability solutions, including
a) how users can search and filter traceability data stored in the system (such as lot codes, transaction dates, and supplier/customer data);
b) how users can change the configurations of the systems; and
c) what alternative languages are supported by each individual solution.
As a key component of each traceability solution, each solution provider also discussed their currently embedded security measures, such as encryption technologies for protecting the data and the security measures for critical data storage. During the live demonstration of the
traceability solutions, we were able to identify key traceability-related features. For example, the scopes of traceability supported by selected solutions were typically different. While some solutions could provide whole-chain traceability, others were mostly focused on internal (within a particular facility) or one-up/one-down traceability. Traceability solutions were typically different as far as critical tracking event data required by their systems. Typical required data elements were identified as date, time, location, quantity, and unique product lot identifiers. When feasible, each solution provider demonstrated how their system handles complicated transformation of units of food products in the supply chain. Examples of such situations include:
- unit splitting (e.g., heads of lettuce stored in a large package are repacked into smaller packages in a post-harvest processing establishment for shipping to a buyer),
- unit pooling (e.g., fish stored in the holds of three vessels emptied into the hold of a packer for shipping to a buyer), and
- combination of splitting and pooling (e.g., fish from three vessels emptied into the hold of a packer then placed in totes by an off-loader for shipping to a buyer).
The sample questionnaires developed for this project are included as attachments (see: “Tracing Task Measures.docx” and “Technology Evaluation Questionnaire.docx”)
The pilot test helped clarify and limit the scope of key data elements included in this study as a representation of real-world production data. However, the pilot solution provider was unable to input the non-standardized test data into their technology without considerable effort so IFT reviewed the data to ensure that the questions presented to the 8 technology providers could be answered using the simulated data. The lessons learned from the pilot test are also
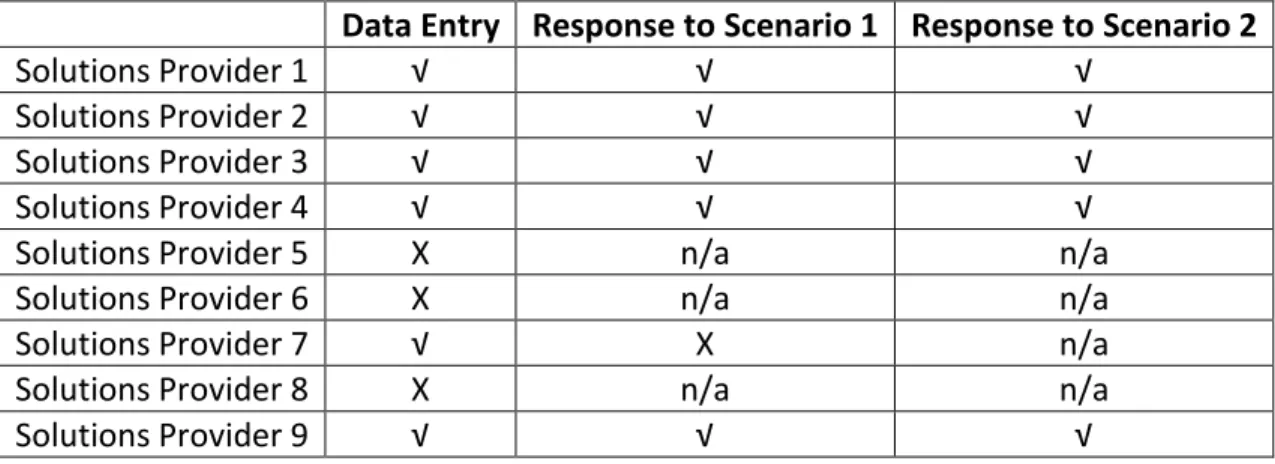
applicable when designing the test for interoperability during the next phase of this project. The summary results from the traceability test conducted with the nine solution providers are shown in Table 1 below. The complete analysis, as well as a discussion on the opportunities and challenges faced by the solutions providers (including the reasons why some solution providers
were able to complete the test and others were not) and its impact on interoperability studies are still being compiled and will be described in the next report.
Table 1: Summary results from Traceability Test
Data Entry Response to Scenario 1 Response to Scenario 2
Solutions Provider 1 √ √ √
Solutions Provider 2 √ √ √
Solutions Provider 3 √ √ √
Solutions Provider 4 √ √ √
Solutions Provider 5 X n/a n/a
Solutions Provider 6 X n/a n/a
Solutions Provider 7 √ X n/a
Solutions Provider 8 X n/a n/a
Solutions Provider 9 √ √ √
5. Pitfalls or difficulties encountered and alternative methods to resolve the problems As noted in the last status report, it was difficult to obtain real time, verified, supply chain data.
The use of simulated data actually provided several opportunities to control the data (e.g., the introduction of known errors) so this alternative method was actually preferable. 6. Future plans/next steps
The following next steps are planned for the next quarter in order to meet the goals of this project:
a) Summarizing the key components of different available approaches to traceability including their scope, assumptions, limitations, and potential challenges with respect to interoperability with other solutions.
b) Completing analysis of the data collected from the traceability test using the mock supply chain data.
c) Summarizing the discussions during the face-to-face meetings with each of the solutions providers.
d) Refining the critical tracking events and key data elements that need to be captured to effectively enable whole-chain traceability (based on the results of this phase)
e) The second Expert Panel meeting is being scheduled to discuss the results of this phase of the project as well as to design the interoperability experimental methodology for the next phase of the project
7. Additional references (not previously cited) Additional Reference Materials:
- “Overview of Traceability Solution Proviers.doc”
- “Tracing Task Measures.docx”