Big Data in Power Systems
Leveraging grid optimization and wave energy integration
Nuno Amaro
R&D Nester
Centro de Investigação em energia REN – State Grid, S.A. Lisbon, Portugal
João Murta Pina
Centre of Technology and Systems (CTS) UNINOVA
Caparica, Portugal [email protected] Abstract — Power systems have been through different
challenges and technological innovations in the last years and are rapidly evolving into digital systems through the deployment of the smart grids concept. Producing large amounts of data, power systems can benefit from the application of big data analytics which can help leveraging the optimization processes going on in power grids nowadays. The whole value of chain of electric power can benefit from the application of big data techniques. This paper presents a short overview of possible applications and challenges that still need to be considered for this synergy to grow. Under the framework of an H2020 funded project named BigDataOcean, a case study will be described, showing how a data-driven approach can foster the development of offshore renewable sources using the example of wave energy.
Keywords— big data; wave energy; BigDataOcean I. INTRODUCTION
Over the last decade, the world faced a digital revolution, and the increased digitalization of different sectors, together with the rapid development of the Internet of Things (IoT) concept and an increase in the number of connected devices resulted in the accumulation of large amounts of data. This is still growing and it is expected that by 2020 the data created and exchanged will reach 44 ZB [1].
In the energy sector, with the deployment of the concept of smart grids and the increasing penetration of Information and Communication technologies (ICT), digitalization is a reality. This digitalization can be seen in all steps of the energy value chain, from generation to distribution/retail [2]. In parallel to it, power systems are facing different challenges related to operational aspects such as the needs to reduce operational costs and increase efficiency, increase the renewable energy share and consider environmental issues, among other. These challenges, together with the innovations brought by big data represent new opportunities, particularly because the next generation of power systems, the smart grids, will be extremely data intensive [3]–[6]. Ultimately, the application of big data techniques in power systems can lead to real time optimization of power generation and transmission, accurate prediction of load demand, consumption patterns analysis leading to new services, and dynamic pricing strategies [7]. However, current status of both power systems and big data technologies still need to overcome different challenges to meet these goals. Most important challenges include: effective data acquisition and storage; data curation methodologies; how to exactly use the stored data to extract business value and how to mitigate
privacy while using these data. These challenges become even more important in a sector which is traditionally adverse to change which is the case of the energy sector. Two of the main reasons for this behavior are reliability and long return-of-investment (ROI) scenarios. The energy sector must assure a high reliability and once a technology is proven to be safe from the operational point of view most utilities are reluctant to change to another technology. In addition, this is an asset intensive sector where most assets have a high cost and a large ROI which indicate that these same assets must ensure a safe operation for long time. Considering this, the adoption of new technologies and the change to a data driven approach must be performed in a timely manner and using opportunities that arise from the challenges the sector is facing.
In order to better understand how big data can be applied to power systems and how these can benefit from techniques which are already common to the ICT world but still seen as strange to the power systems world, this paper presents a short summary of possible applications of big data in power systems. To reach a more concrete status, a clear example is shown taking into consideration the application of a data driven approach to assess the ocean energy potential for wave energy conversion. This approach is being currently followed under the framework of an H2020 project named BigDataOcean. The paper is organized as follows: section II describes shortly the main characteristics of big data and how these can be adapted to fit the needs of power system; section III describes how big data techniques can be used to perform an assessment of ocean energy potential, focused in the wave energy conversion systems; after that, section IV describes the undergoing pilot of the project BigDataOcean which is a concretization of the aspects mentioned in the previous two sections; finally, section V contains some comments and conclusions related to the paper topic.
II. BIG DATA IN POWER SYSTEMS
A. Characteristics of big data
Big data refers to more than just a large collection of data. A common definition of big data includes the classification of its characteristics using the 4V's [8]. These characteristics are applicable to different sectors which can benefit from the application of big data. Taking into consideration the particularities of energy sector, the 4V's can be briefly explained as follows.
Volume. The digitalization of the power system, including the large-scale deployment of smart metering devices and the This work and the BigDataOcean project have received funding from the
European Union’s Horizon 2020 research and innovation programme under grant agreement No. 732310.
changes at the substation level, will generate a large volume of data. This presents new opportunities but also challenges regarding the storage and processing of these data [9], [10].
Velocity. This characteristic refers to the processing speed required to collect, process and use big data in power systems. The time interval of data collection can be as short as few milliseconds and considering that large datasets can be collected the processing of these data in a real time or near real time basis can present a challenge.
Variety. This refers to the different data that needs to be considered. Energy systems include structured data (e.g. data from sensors and meters), semi-structured data (e.g. weather forecast data) and unstructured data (e.g. costumer behavior data). Processing these different datasets represents a challenge, particularly because sources of unstructured data are increasing [11].
Veracity. This characteristic deals with the need to take into consideration uncertainty of data. In a society core sector, such as the energy one, the confidence in the veracity of used data is fundamental and big data techniques must assure this veracity as one of the most important aspects.
These four characteristics allow the utilization of big data techniques with the goal of extracting business value. Due to this reason, Value is often labeled as the fifth V [12]. Taking into consideration the specific application in the power system field, these 5V characteristics can be complemented with the 3E's [13], which stand for: Energy which can be saved from the application of big data techniques; Exchange which stands for the exchange of information between energy and other sectors with the aim of improving the value of energy big data;
Empathy meaning that by providing better energy services
needs of users can be achieved and their satisfaction increased.
B. Big data and smart energy management
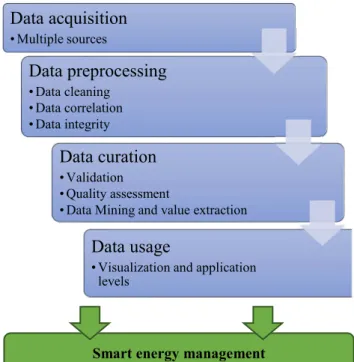
To achieve a data-driven smart energy management system, based in big data analytics, different steps need to be considered. These include the different stages of big data analytics operations which are summarized in the value chain of Fig. 1.
The four major activities of the presented value chain are of great importance in the application of big data analytics in power systems. The data acquisition and preprocessing processes deal with all the necessary topics to gather data from multiple sources and prepare it to be processed by defining a common understanding of all used datasets. Data curation is the core process and deals with all the business value extraction from the data gathered in the previous stages. In the final process, data visualization and representation allows energy sector players to improve their business with the data-driven approach and different goals such as energy efficiency, consumer engagement, real-time monitoring, demand response, intelligent control and dynamic pricing strategies (amongst other) can be achieved.
Big data techniques can be applied to the whole value chain of the energy sector, including: power generation, transport, distribution and demand side management (DSM). The application depends on the core business of the companies
using such approach. Some examples of possible applications are presented next, organized according to the core stage of power systems management [7].
• Power generation: efficiency improvement, asset
management and generation schedule planning;
• Transmission: asset management, grid planning, grid
loss identification;
• Distribution: real-time sensing, voltage control, outage forecast, asset management;
• Demand side management: demand response, load
forecasting, dynamic price strategies, real-time consumption monitoring, fraud detection.
These applications rely on many different data sources located at the different stages of the power sector value chain. There is a large set of data sources, which can be separated into different categories [14]: data from smart meters, through the deployment of advanced metering infrastructures (AMI) [15]; grid assets data (primary equipment sensors); third-party data (off-grid data sets) and asset management data (smart devices in the grid). Because these data sources have very different natures, data integration/correlation becomes a core step of the value chain of data-driven power systems.
Big data analytics need to take into consideration these different data sources and consider the risk and privacy issues that might arise from data utilization at these different steps. Two different aspects need to be taken into consideration: privacy of consumers data, which is important for the consumer engagement in the process, and privacy and control over the data exchanges between different players. The necessity for data privacy represents also a challenge that needs to be overcome by creating / adapting sound and secure technologies ensuring that utilities have their data secure at all
Fig. 1. Value chain of big data analytics in power systems
Smart energy management
Data acquisition
• Multiple sourcesData preprocessing
• Data cleaning • Data correlation • Data integrityData curation
• Validation • Quality assessment• Data Mining and value extraction
Data usage
• Visualization and application levels
times. One other challenge is to define correctly the data ownership. Some datasets are used by different players in the energy sector, however the interfaces between them and the data owners need to be correctly specified otherwise this might result in conflicts which endangers the application of a data driven approach. The solution for this problem relies in the creation of legislation which clearly defines the ownership of different datasets, particularly at the interfaces between different players such as TSO’s and DSO’s [16].
C. Current applications and opportunities
The major steps of the power systems value chain (generation, transmission and distribution) are asset intensive. These assets produce large amounts of data, mainly related to condition monitoring and control. The utilization of big data techniques can improve the life span of assets by providing a new vision related to operation and maintenance activities. A data-driven approach can improve the operation conditions of the different existing assets in different aspects such as real-time monitoring, fault diagnosis, scheduling of maintenance operations, thus improving the grid sustainability and reliability. The main challenge related to this application is related to the necessity of having data privacy, as already discussed previously.
Power systems are mainly composed by natural monopolies (the transmission and distribution grids) and large operators (generation). However, the consumer side is the one that contains more opportunities for big data applications, through the deployment of DSM services. The areas of application of big data are inside a very large spectrum. The deployment of smart meters, the real-time monitoring of load profiles and load classification techniques will allow the creation of many different services such as consumer segmentation and dynamic pricing. Ultimately, these strategies can change the consumer behavior and make this a much more active player in the energy sector than it is nowadays. Big data can also generate new business opportunities at the consumer side, providing new services and products related to the energy sector. Once again, data privacy needs to be ensured and the utilization of consumer data from the utilities must be clearly legislated in order to avoid market imbalances.
One application where big data importance is already very relevant and still growing is related to the management of renewable energy. Energy obtained from renewable sources is already a major source of electric power, particularly in European countries. As an example, in Portugal, in 2016, 57% of electrical power was generated from renewable sources [17]. In order to assure grid stability and power quality, an accurate forecast of renewable energy sources such as wind and solar is fundamental [18] [19]. There are a large variety of forecast models and these can benefit from the integration of more data sources and big data analytics techniques. Different countries are now looking into offshore renewables as the next clean source of energy. These include not only offshore wind farms, which is already a mature technology but also ways of extracting energy from the ocean, namely wave and tidal. Because these areas are those that still need to overcome different technical challenges and still require a sound effort in research to reach maturity, the focus of this paper is the
application of big data techniques to leverage the development of such technologies, focusing in wave energy.
III. BIG DATA DRIVEN WAVE POWER ASSESSMENT
In this section a brief description of how big data techniques may support the advent of ocean energy technologies is presented. Wave power is specifically selected as target source, as described in the next section, as well as its challenges, related to resource and production assessment procedures, among several other. Data mining is then introduced as the set of mentioned big data techniques that can contribute to address those challenges.
A. Wave energy potential and technical challenges
Oceans provide multiple sources of energy, namely [20][21]:
• Waves, originated by wind, which results from heterogeneous heat distribution in atmosphere, are thus an indirect form of solar energy. Energy in waves is present both in kinetic and in potential form [22], due to the circular movement of water particles.
• Tides, mainly a result of Earth-Moon gravitational interactions, with smaller expression from the Sun. Tides also allow converting either kinetic (directly from tide streams) either potential (height difference in stored water corresponding to tide range) energy.
• Thermal gradients, based on the temperature differential between (warmer) surface or shallow waters and (cooler) water at around 1,000 meters. A heat engine allows generating useful work [23].
• Salinity gradients, related with energy that is dissipated when two solutions with different salinities, e.g. water from sea and river, are mixed [24].
Marine environment also allows for well mature offshore wind energy conversion. Excluding the latter, tidal technology seems to be currently the most developed when comparing to waves or thermal. Yet, its site specificity and relatively low scale poses severe constraints to its adoption and viability [20]. On the other hand, efficiency of ocean thermal energy conversion has been demonstrated to be in the range of 2 to 3%, while the technology is also very capital intensive (e.g. long pipelines are required to reach one or more kilometers below surface). Salinity based energy conversion, in spite of being a concept with several decades [25], is highly dependent on site location (river and sea waters need to mix), world resource is greatly limited, and is not expected to be viable in the next decades as technology has a low mature level, among other factors [24].
All these schemes share similar design and operation constraints, related with extreme ocean conditions and harsh environments, although with different impacts. For instance, according to reference [20], the average annual power in the coast of West Ireland is nearly 40 kW/m (design power input), while extreme events may lead to instant waves with a power content exceeding 4 MW/m.
Nevertheless what is previously mentioned, wave energy has attracted large investments and several progresses have been made, for which this will be addressed as a case study in this paper and in BigDataOcean project. A review of the state-of-the-art concerning ocean energy related technologies may be found e.g. in [26].
Several advantages of wave power concerning other sources have also been pointed out in the literature (a compilation of these is presented in [27]), although several of the numbers are based on gross assumptions:
• Sea waves show the highest energy density among renewables, namely 2-3 kW/m2 perpendicularly to wave propagation, typically one order above sun or wind average values [28].
• Waves can travel over long distances with few energy losses [29].
• Wave power availability have been reported as high as 90% of the time [23], and converters can achieve capacity factors whose estimates exceed 30%, depending on the technology and site location [30]. • The resource is more predictable than wind, although
obtaining accurate forecasts is still a challenge [29]. Yet, and also comparing to wind, wave power is also more persistent and spatially concentrated [28], which contributes to less demand in forecasts.
• There are limited negative environmental impacts due to converters, and their structures have even been reported to contribute to seabed restoration (a review of studies is presented in [31]).
In spite of these envisaged benefits, wave energy conversion has still several technological challenges to overcome (a review is presented in [32]), such as:
• Energy has to be converted from slow, random oscillations (in the order of 0.1 Hz) into useful motion that can drive electrical generators. This may often require energy storage means or arrays of devices [29]. • Converters have to be designed for mean power levels,
but, as already mentioned, they must also withstand extreme conditions (e.g. storms), where power may exceed over 100 times its mean value.
• Due to irregularity of the resource, it remains a challenge to obtain high energy conversion efficiency over the entire range of input power [32].
• Hundreds of concepts for wave energy conversion have been patented [33]. Besides the challenge of determining their energy extraction performance in specific sites and conditions, reliability, robustness and survival evaluation, as well as required optimization is still very limited [29].
B. Challenges in assessing resource and production
The steps usually required to assess wave power resource at a specific site are briefly described in the following list (see details in reference [34]):
1. Make a preliminary assessment in the area of interest using statistics from global models, typically run by meteorological agencies.
2. Assess the inter-annual variability of the wave resource at the model site.
3. Since usually the converters site is different from the global model grid point, extrapolate previous climate statistics to the target location, using e.g. transformation models.
4. If previous step suggests site viability, perform a measurement campaign in order to validate the model. 5. Assess the resource at the site, namely (omnidirectional
or directional) power from measured spectra and its statistics.
6. Review the determined resource as more information becomes available.
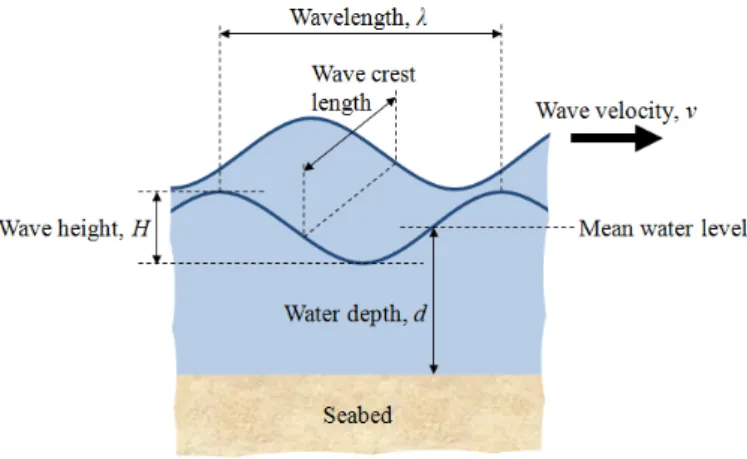
Sea waves are composed by a superposition of elementary waves (or wavetrains) of different frequencies (or periods), heights and directions [28], [35], thus requiring directional spectral analyses to model the resource. Each elementary wave is shown to travel at a phase velocity
( )
gtanh( )
v f f kd
k
λ
= = . (1)
In this equation,
λ
is the wavelength, f =1T is the frequency, whereT
is the period, g=9.8m/s2 is the acceleration of gravity, d is the water depth and k=2π λ is the wave number [35], [36], see Fig. 2.Considering a group of elementary waves, the group velocity is given by [36]
( ) ( )
1 2(
)
2 sinh 2 g v f kd v f kd = + (2)The energy density (per sea surface) associated with an elementary wave in a given direction is given by [22]
2
8
w gH
E =
ρ
(3)where
ρ
=1,030kg/m3 is the density of sea water, 29.8 m/s
g= is the acceleration of gravity and
H
is the wave height (twice its amplitude, see Fig. 2). This energy is stored both in kinetic (due to the movement of water particles) and potential forms. Taking into account the superposition of wavetrains, the total energy is given by [28], [36](
)
2 0 0 , d d E g S f f π ρ ∞ θ θ =
(4)where S f
(
,θ)
, in m2/Hz, is the spectral density of sea (which indicates how energy distributes over frequencies f and directionsθ
). A standard indicator in the offshore industry is the significant wave height, Hm0, which corresponds to the mean height of the highest third of recorded waves in a site. This is typically given as a function of spectral moments, defined by(
)
2 0 0 , d d n n m f S f f π θ θ ∞ =
. (5)It was discovered that 0 4 0 m H = m (6) and thus 2 0 16 m gH E=
ρ
(7)Since wave energy is transported with corresponding group velocity, the available power in waves is expressed as
(
) ( )
2 0 0 , g d d P ρg πS f θ v f θ f ∞ =
(8)In deep water, as kd increases, vg ≈v 2≈ g k and (8) leads to [28], [36]
[
]
2 2 2 0 10 0 10 3 0.49 kW/m 64 10 m m g Pρ
H T H Tπ
− − = = × (9)expressed per length of wave crest. Parameter T−10 is the energy period, given by
1 10 0 m T m − − = . (10)
Besides the previous ones, other parameters as most energetic direction, θm, or peak frequency, fp, corresponding to maximum spectral energy density, are also relevant to characterize the available resource [36].
Previous steps are intended to model the wave power resource at a specific site. Yet, only a fraction of that resource is convertible in useful electrical energy, depending on the type of wave energy converter (WEC) considered. WECs are typically classified according to four categories [32]:
• Operation principle [33]:
o Oscillating water column: fixed, hollow structures,
partially submerged, where air is forced into and out of it by pressure from water, driving a turbine, typically a Wells device which operates under bidirectional flows [35].
o Overtopping device: incoming waves overtop a
reservoir above sea level, and then water is released back to sea through turbines [29].
o Wave-activated bodies: several units, floating or
submerged, move around a reference point or surface due to motion of wave particles. These can be further divided in submerged pressure differential or oscillating wave surge converter devices [29], among others.
• Location [29]: this is related with water depth, although consensual definitions are still lacking.
o Shoreline (onshore): closer to grid infrastructure
and easy to maintain; submitted to reduced load from waves as these are attenuated; refraction causes preferential wave directions (perpendicular to shore); yet, lower power density is available due to losses.
o Nearshore: corresponds to relatively shallow
waters, also suggested as corresponding to a depth
4
d<
λ
[35].o Offshore: corresponding to deep water, which can
be defined as tens of meters or a depth d>
λ
3 or2
d>
λ
[35]. This allows for higher energy values; yet construction, operation and maintenance costs are much higher, and survivability against extreme conditions is determinant.Location typically defines the type of supporting structure, either fixed to seabed (onshore/nearshore) either floating or tethered (nearshore/offshore) [35]. Yet, several possibilities are available.
• Power takeoff system: there are three most widely used systems allowing converting (irregular) wave energy into (smooth) electrical energy.
o Air turbines: they extract energy from air flow as
e.g. the already mentioned Wells turbine. Using air as working fluid allows obtaining higher speeds than from waves.
o Linear generators: used in direct drive converters,
where moving part is directly coupled to the electrical generator, these are typically built with permanent magnets [37].
o Hydraulic systems: mechanical energy from waves
is first converted into hydraulic energy in a compression unit. The pressure difference in the unit then actuates an electrical generator [38]. • Geometry and orientation [29][35]:
o Terminator: its main axis is parallel to incident
wave front (perpendicular to predominant wave direction), they physically intercept waves.
o Attenuator: its main axis is perpendicular to
incident wave front (parallel to predominant wave direction), energy is drawn from waves as they pass the device.
o Point absorber: a type of mounted or seabed
mounted WEC that draws energy from waves in all directions through its movements [32].
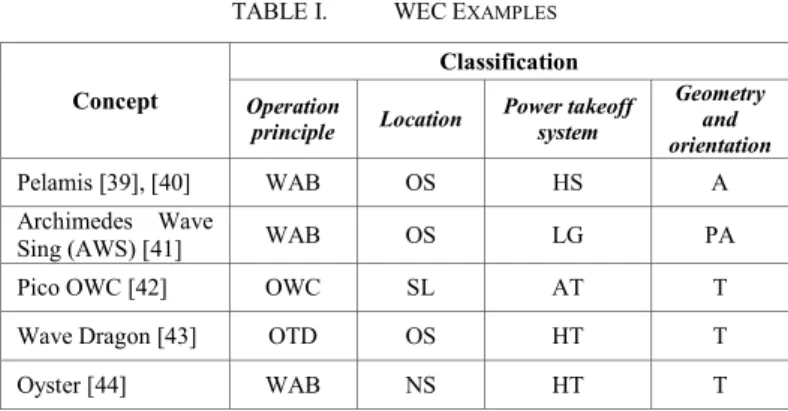
Table I shows some examples of different types of implemented WEC concepts. As can be inferred from the previous classification list, one challenge in assessing production for a specific site, besides assessing the resource, is the huge amount of concepts and patents of WECs. Their models or statistics must be correlated with the available resource.
C. Big data and data mining benefits
Taking into account the complexity of resource assessment, the multitude of WEG concepts, and the diversity and massive amount of data collected and generated worldwide, not only by WEC developers or meteorological and R&D agencies, as well as by vessels, collecting and storing these data in a common framework allows performing unprecedented complex decisions based on data mining, analytics and forecast.
TABLE I. WECEXAMPLES
Concept
Classification Operation
principle Location Power takeoff system
Geometry and orientation
Pelamis [39], [40] WAB OS HS A
Archimedes Wave
Sing (AWS) [41] WAB OS LG PA
Pico OWC [42] OWC SL AT T
Wave Dragon [43] OTD OS HT T
Oyster [44] WAB NS HT T
Operation principle: OWC – oscillating water column; OTD – overtopping device; WAB – wave-activated bodies. Location: SL – shoreline; NS – near shore; OS – offshore. Power takeoff system: AT – air turbine; HT – hydro turbine; LG – linear generator;
HS – hydraulic system.
Geometry and Location: T – terminator; A – attenuator; PA – point absorber.
These are related either with the design/planning stage, either with the operation and maintenance stages. Developers, end-users or utilities may take advantage of such framework. Some of the envisaged functionalities and benefits are the following:
• Design/planning stage:
o By collecting operational data from projects
worldwide in a single platform, this allows extracting statistical/data-driven models from diverse concepts, and thus choosing the optimal WEC for a particular site.
o Survivability statistics of WECs may be assessed
and incorporated in the life-cycle analysis of projects. Typically this requires time domain statistics of highest waves and impacts of runs of waves in WECs operation [34].
o Impact of existing WECs and farms of WECs in
quality of power systems may be assessed from existing sites, allowing designing mitigating measures [45].
• Operation and maintenance stages:
o Determination of more cost effective maintenance
vessels, forecasting vessel and data weather for optimizing vessel performance (saving fuel), planning maintenance operations using accurate weather forecasts [46]. This is more determinant as WECs are located offshore.
o Predict failures of WECs and associated
equipment.
IV. LEVERAGING WAVE POWER INTEGRATION USING BIG DATA Taking into consideration the advantages of using big data in energy systems, and under the framework of an H2020 funded project named BigDataOcean, a pilot related to the development of the offshore energy (particularly wave energy) industry was created. Prior to the explanation of the case study, a short presentation of the project is deemed advisable.
BigDataOcean (http://www.bigdataocean.eu/site/) aims to capitalize on existing modern technological breakthroughs in the areas of the big data driven economy, and roll out a completely new value chain of interrelated data streams coming from diverse sectors and languages and residing on cross technology innovations being delivered in different formats (as well in different states, e.g. structured/unstructured, real-time/batches) in order to revolutionise the way maritime-related industries work, showcasing a huge and realistic economic, societal and environmental impact that is being achieved by introducing an economy of knowledge into a traditional sector which does not operate in an orchestrated manner and is rather fragmented. This infrastructure will be combined with four strong pilots that will bring into BigDataOcean a huge amount of data (in TBs) in order to develop the largest maritime database as a resource of
collaborative, data-driven intelligence. These four pilots are related to four different industries of the maritime sector: security, energy, predictive vessel fault, and environment protection. BigDataOcean will give participants the capability to upload both private and public resources of data, and interrelate them over public and private queries and diagrams. The main objective of BigDataOcean is to enable maritime big data scenarios for EU-based companies, organisations and scientists, through a multi-segment platform that will combine data of different velocity, variety and volume under an inter-linked, trusted, multilingual engine to produce a big-data repository of value and veracity back to the participants and local communities. All information related to the project can be found in the official website [47].
The maritime industry is built by different sectors which can benefit from an integration of information. Over the last years, oceans have been looked upon as a possible source of energy. Different technologies have been considered and these are now at different stages of maturity. However, considering the actual state of the technology, the energy source that uses most the ocean potential is offshore wind, which only uses this potential indirectly. Other sources of energy using the ocean as main resource, such as tidal and wave power are still in a more immature stage. Most projects in these areas are either fundamental research or small prototype testing [48]. This case study aims to deliver an advance in the offshore renewables deployment process, particularly focused in wave power. The pilot of BigDataOcean aims to contribute to the overcome of different technological challenges that this industry faces.
As already stated, the deployment of wave energy production farms depends greatly on the technological advances of WECs but also in correct resource assessment and site planning studies, which will dictate the success of a possible investment. However, to perform these studies is currently a complicated task, mainly since required data is scattered across multiple sources and the quality of some of these data might be questionable. Through the platform implemented in BigDataOcean, this pilot aims to create a database of all necessary data needed to perform quick and accurate assessment of energy potential in the oceans, fastening the process of performing the different studies which ultimately lead to the choice of an exact location to place a wave farm.
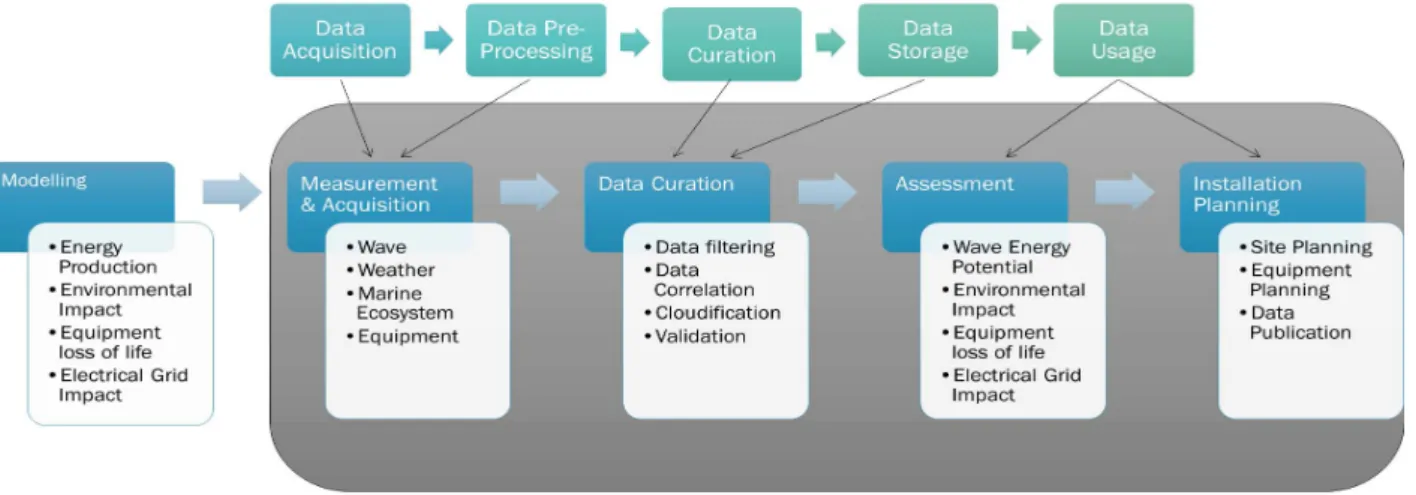
The pilot value chain, depicted in Fig. 3, demonstrates the followed methodology. The different steps of the value chain are closely related to those shown in Fig. 1 that are related to the application of big data techniques in power systems. The main goal of the pilot is to provide data gathered from multiple sources allowing users to use these data in their business. To perform this, multiple sources of data will be identified and data access policies will be verified, to gather the maximum possible data. Already identified data sources include weather and wave forecast data, satellite data, ocean conditions data, biological data, electric grid data and wave energy converters models data. All obtained data will go through operations such as data curation, correlation and filtering, thus providing pilot users with accurate and validated data. The pilot will use mainly data related to a Portuguese pilot zone used for the deployment of offshore renewables, located in the Atlantic coast of Portugal. ENONDAS (a subsidiary of the Portuguese
Transmission System Operator) under the trading name of Ocean Plug, has a public concession for this zone for 45 years, until 2055 [49].
The five main steps envisaged for the pilot, shown in the value chain, can be described as follows.
• Modelling – Considers the attributes necessary to characterize a wave energy harvesting zone in terms of wave energy potential, environment impacts introduced by the deployed equipment, equipment loss of life due to external conditions and the converted energy integration into the existing power system;
• Measurement and Acquisition – Refers to wave, weather, environmental, and equipment operation related data necessary to the wave energy harvesting zone characterization;
• Data Curation – Data from different sources are filtered, pre-analysed, validated, and made available;
• Assessment – Using the developed models, wave energy conversion potential, environment impacts introduced by the deployed equipment, equipment loss of life due to external conditions and the converted energy integration into the existing power system are assessed;
• Installation Planning – In the end of the value chain, the data acquired from different sources is made available and site planning together with equipment planning is supported by the provided wave energy harvesting zone characterization;
The pilot aims to develop solutions to improve the business of different companies and the identification of all stakeholders is still undergoing. Nonetheless, different stakeholders have already been identified and the consortium members are committed into involving these in the project development to assure a correct alignment with their current needs. The identified stakeholders include:
• Data providers – such as oceanographic centers;
• Zone concessionaires – e.g. the concessionaire of the Portuguese pilot zone;
• Service providers – consulting companies that provide studies related to the wave energy deployment process; • Technological companies – e.g. manufacturers of wave
energy converters;
• Energy producers – companies that will deploy and explore wave farms;
• Utilities – companies that operate the grid where the wave farms will be connected to;
• Research institutes and universities.
These stakeholders can benefit from the utilization of the pilot results and from the BigDataOcean platform as a whole. Identified stakeholders main activities fit in different steps of the pilot value chain therefore different services can be
provided to different stakeholders. These services can go from the provision of curated data to service providers up to preliminary site planning studies for energy producers. All envisaged services that can be provided by the pilot, and more
generally by the project, are still under verification by the consortium members and will be constantly updated in the project website.
Fig. 3. BigDataOcean wave power pilot value chain
V. CONCLUSIONS
Recent developments in ICT technologies and the increase in the amount of available data revolutionized different sectors including power systems, who can benefit from the application of big data. Taking this into account, this paper described the main characteristics of big data (when applied to power systems) and presented a concise review of main advantages and challenges related to this synergy.
One of the main power systems areas that can benefit to the application of big data related techniques is the renewable energy development. Taking this into consideration focusing on an ongoing H2020 project named BigDataOcean, it was shown how big data can leverage the development of offshore renewables, particularly wave energy conversion systems. The project pilot envisaged for this area was described, together with a review of offshore renewable energy technologies. All project findings and developments will be made available at the project website.
ACKNOWLEDGMENT
This work and the BigDataOcean project have received funding from the European Union’s Horizon 2020 research and innovation programme under grant agreement No 732310.
REFERENCES
[1] IDC, “The Digital Universe of Opportunities: Rich Data and the Increasing Value of the Internet of Things,” 2014. [Online]. Available: https://www.emc.com/leadership/digital-universe/2014iview/executive-summary.htm.
[2] A. Ipakchi and F. Albuyeh, “Grid of the future,” IEEE Power Energy Mag., vol. 7, no. 2, pp. 52–62, Mar. 2009.
[3] T. Garrity, “Getting Smart,” IEEE Power Energy Mag., vol. 6, no. 2, pp. 38–45, Mar. 2008.
[4] P. Zhang, F. Li, and N. Bhatt, “Next-Generation Monitoring, Analysis, and Control for the Future Smart Control Center,” IEEE Trans. Smart Grid, vol. 1, no. 2, pp. 186–192, Sep. 2010.
[5] (International Energy Agency) IEA, “Smart Grids - Technology
Roadmap,” 2011.
[6] S. Massoud Amin and B. F. Wollenberg, “Toward a smart grid: power delivery for the 21st century,” IEEE Power Energy Mag., vol. 3, no. 5, pp. 34–41, Sep. 2005.
[7] K. Zhou, C. Fu, and S. Yang, “Big data driven smart energy management: From big data to big insights,” Renew. Sustain. Energy Rev., vol. 56, no. January, pp. 215–225, 2016.
[8] IBM Corporation, “The Four V’s of Big Data,” 2016. [Online]. Available: http://www.ibmbigdatahub.com/infographic/four-vs-big-data. [Accessed: 18-Apr-2017].
[9] S. Yin and O. Kaynak, “Big Data for Modern Industry: Challenges and Trends,” Proc. IEEE, vol. 103, no. 2, pp. 143–146, 2015.
[10] D. Cai et al., “Electric Power Big Data and Its Applications,” in
International Conference on Enery, Power and Electrical Engineering (EPEE), 2016, pp. 181–184.
[11] IBM Corporation, “Managing big data for smart grids and smart meters,” White Pap., p. 8, 2012.
[12] IBM Corporation, “Extracting business value from the 4 V’s of big
data,” 2016. [Online]. Available:
http://www.ibmbigdatahub.com/infographic/extracting-business-value-4-vs-big-data. [Accessed: 18-Apr-2017].
[13] E. P. I. S. C. CSEE, “White paper of China’s electric power big data,” 2013.
[14] S. Witt, “DATA MANAGEMENT & ANALYTICS FOR UTILITIES,”
SmartGrid Updat., 2014.
[15] D. G. Hart, “Using AMI to realize the Smart Grid,” in 2008 IEEE Power and Energy Society General Meeting - Conversion and Delivery of Electrical Energy in the 21st Century, 2008, pp. 1–2.
[16] R. Alves, F. Reis, and C. Liang, “TSOs and DSOs Collaboration : The Need for Data Exchange,” vol. Trivent En, no. Deregulated Electricity Market Issues in South Eastern Europe, pp. 55–62, 2015.
[17] REN, “2016 Technical Data,” 2017.
[18] N. P. da Silva, L. Rosa, W. Zheng, and R. Pestana, “Wind Power Forecast Uncertainty Using Dynamic Combination of Predictions,”
Period. Polytech. Electr. Eng. Comput. Sci., vol. 59, no. 3, pp. 78–83, 2015.
[19] S. Pelland, J. Remund, J. Kleissl, T. Oozeki, and K. De Brabandere, “Photovoltaic and Solar Forecasting: State of the Art,” Int. Energy Agency Photovolt. Power Syst. Program. Rep. IEA PVPS T14, pp. 1– 40, 2013.
[20] World Energy Council, “World Energy Resources: 2013 survey,” 2013. [21] World Energy Council, “2010 Survey of Energy Resources,” 2010. [22] J. Cruz, Ed., Ocean Wave Energy Current Status and Future
[23] R. Pelc and R. M. Fujita, “Renewable energy from the ocean,” Mar. Policy, vol. 26, no. 6, pp. 471–479, 2002.
[24] O. Schaetzle and C. J. N. Buisman, “Salinity Gradient Energy: Current State and New Trends,” Engineering, vol. 1, no. 2, pp. 164–166, 2015. [25] R. E. Pattle, “Production of Electric Power by mixing Fresh and Salt
Water in the Hydroelectric Pile,” Nature, vol. 174, no. 4431, pp. 660– 660, Oct. 1954.
[26] N. Khan, A. Kalair, N. Abas, and A. Haider, “Review of ocean tidal, wave and thermal energy technologies,” Renew. Sustain. Energy Rev., vol. 72, no. October 2015, pp. 590–604, 2017.
[27] I. López, J. Andreu, S. Ceballos, I. Martínez De Alegría, and I. Kortabarria, “Review of wave energy technologies and the necessary power-equipment,” Renew. Sustain. Energy Rev., vol. 27, pp. 413–434, 2013.
[28] J. Falnes, “A review of wave-energy extraction,” Mar. Struct., vol. 20, no. 4, pp. 185–201, 2007.
[29] B. Drew, A. . Plummer, and M. N. Sahinkaya, “A review of wave energy converter technology,” J. Power Energy, vol. 223, pp. 887–902, 2009.
[30] L. Rusu and F. Onea, “Assessment of the performances of various wave energy converters along the European continental coasts,” Energy, vol. 82, pp. 889–904, 2015.
[31] L. Riefolo, C. Lanfredi, A. Azzellino, and D. Vicinanza, “Environmental Impact Assessment Of Wave Energy Converters : A Review,” in 7th International Short Course and Conference on Applied Coastal Research, SCACR 2015, 2015, no. September.
[32] B. Czech and P. Bauer, “Wave energy converter concepts : Design challenges and classification,” IEEE Ind. Electron. Mag., vol. 6, no. 2, pp. 4–16, 2012.
[33] A. Clément et al., “Wave energy in Europe: current status and perspectives,” Renew. Sustain. Energy Rev., vol. 6, no. 5, pp. 405–431, Oct. 2002.
[34] The European Marine Energy Centre Ltd., Assessment of Wave Energy Resource. Renewable Energy, 2009.
[35] Les Duckers, “Wave Energy,” in Renewable Energy: Power for a Sustainable Future, 2nd ed., G. Boyle, Ed. Oxford University Press, 2004, pp. 297–340.
[36] S. Barstow and A. Kabuth, “Assessing the Global Wave Energy
Potential,” no. 2008, pp. 1–8, 2014.
[37] N. J. Baker and M. A. Mueller, “Direct drive wave energy converters,”
Rev. des Energies Renouvelables, no. Power Engineering, pp. 1–7, 2001.
[38] Y. Hong, R. Waters, C. Boström, M. Eriksson, J. Engström, and M. Leijon, “Review on electrical control strategies for wave energy converting systems,” Renew. Sustain. Energy Rev., vol. 31, pp. 329– 342, 2014.
[39] G. J. Dalton, R. Alcorn, and T. Lewis, “Case study feasibility analysis of the Pelamis wave energy convertor in Ireland, Portugal and North America,” Renew. Energy, vol. 35, no. 2, pp. 443–455, 2010.
[40] R. Henderson, “Design, simulation, and testing of a novel hydraulic power take-off system for the Pelamis wave energy converter,” Renew. Energy, vol. 31, no. 2, pp. 271–283, 2006.
[41] M. Prado and H. Polinder, “Direct drive in wave energy conversion - AWS full scale prototype case study,” IEEE Power Energy Soc. Gen. Meet., pp. 1–7, 2011.
[42] K. Monk, D. Conley, and V. Winands, “Simulations and Field Tests of Pneumatic Power Regulation by Valve Control Using Short-term Forecasting at the Pico OWC,” Proc. 11th Eur. Wave Tidal Energy Conf., no. September 2015, pp. 1–10, 2015.
[43] N. Muller, S. Kouro, J. Glaria, and M. Malinowski, “Medium-voltage power converter interface for Wave Dragon wave energy conversion system,” 2013 IEEE Energy Convers. Congr. Expo. ECCE 2013, pp. 352–358, 2013.
[44] T. Whittaker, D. Collier, M. Folley, M. Osterried, and A. Henry, “The development of Oyster - A shallow water surging wave energy converter ,” 7th Eur. Wave Tidal Energy Conf., no. January, 2007. [45] H. Polinder and M. Scuotto, “Wave energy converters and their impact
on power systems,” in 2005 International Conference on Future Power Systems, 2005, vol. 5, no. 4, p. 9 pp.-pp.9.
[46] A. Bagnall, A. Hadjer, I. Weeks, and M. Bloy, “Big data : can it reduce the cost of wind turbine operations and maintenance?,” 2016.
[47] “BigDataOcean Website,” 2017. [Online]. Available: http://www.bigdataocean.eu/site/. [Accessed: 01-Apr-2017].
[48] O. E. Systems, “Annual Report 2015,” 2016.
[49] “OceanPlug website,” 2017. [Online]. Available: