Auckland Golf Facility Strategy New Zealand Golf
NOTICES
CopyrightThis publication is copyright and remains the intellectual property of O’Connor Sinclair Ltd. The information contained in this document is confidential and no part of it may be reproduced by any means and/or disclosed to any person without the express written permission of O’Connor Sinclair Ltd.
Report Disclaimer
Although every effort has been made to ensure the accuracy of the material in this report and the integrity of the analysis supporting the report and presented herein, O’Connor Sinclair Ltd accepts no liability for any actions taken on the basis of its content.
TABLE OF CONTENTS
Executive Summary
5
1.
1.1 Strategic Recommendation 1 – HieRarchy of Golf Facilities 6
1.2 Strategic Recommendation 2 – Sustainable Facilities 8
1.3 Strategic Recommendation 3 – Auckland Council 9
Introduction
11
2.
2.1 Project Overview 11 2.2 Project Intent 11 2.2.1 Information Gaps 12 2.2.2 Terminology 12Auckland
14
3.
3.1 Population Growth 143.1.1 Local Board Population & Demographics 15
3.2 Auckland Age Profile 15
3.3 Auckland Ethnic Profile 16
3.4 So Who Is Playing Golf? 17
3.4.1 Active Participation 17
3.4.2 Young Persons Survey 20
3.4.3 Participation & Membership Trends 22
3.4.4 Conclusion 23
3.5 The Future of Auckland – THe Auckland PlaN 24
3.5.1 Sports Hub & Public Space 24
3.5.2 Events - ATEED 25
3.5.3 World’s Most Liveable City 27
3.6 City Growth – The Urban Sprawl 28
3.6.1 Golf & Recreation Land 30
3.7 Climate / Environmental 33
Global Golf
36
4.
4.1 Global Challanges 36
4.2 Future Global Trends 36
4.3 New Products Or Product Trends 38
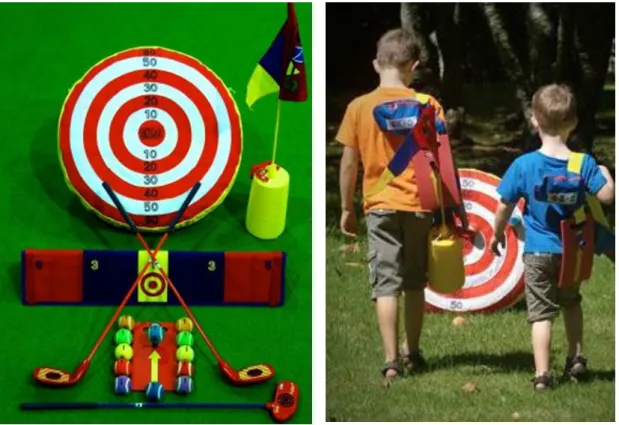
4.3.1 Snag Golf 38
4.3.2 Urban Golf (UK) 38
4.3.3 60 60 Golf 39
4.3.4 Executive 6, 9 or 12 hole Courses 40
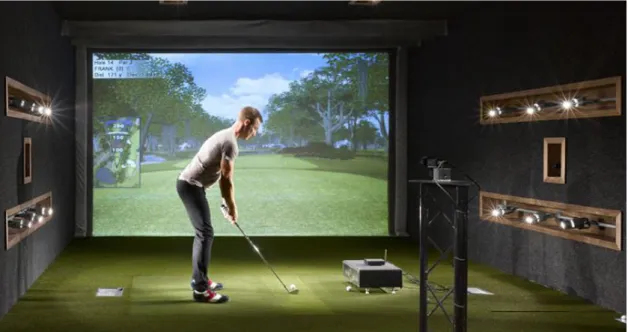
4.3.5 Modern Practice Facilities 40
4.4 Golf Tourism 41
Golf Environment in Auckland
42
6.
6.1 The Survey 42
6.1.1 Financial Sustainability Indicators 51
6.2 Auckland Facility Landscape / Portfolio 56
6.3 Critical Issues in Auckland 74
6.3.1 Lack of Income Diversity 74
6.3.2 Increasing Operational Costs 74
6.3.3 Lack of Diversity in Golf Experiences and Player Pathways 75
6.3.4 Quality of Service 75
6.3.5 Oversupply of rounds in Auckland & Low Utilisation 76
6.3.6 Untapped Markets 76
6.3.8 Summary Long Term Sustainability 76
6.4 Barriers to change 77
Local Government & Golf
78
7.
7.1 Current state 78
7.2 Councils in New Zealand 79
7.3 International councils 80
7.3.1 Common Management Structures 80
7.3.2 International City Examples 81
7.4 Recommendations 82
Strategic Recommendation 1 - Hierarchy of Golf
8.
Facilities
83
8.1 Introductory Course 85
8.2 Development Course 86
8.3 Advanced Course 87
8.4 High Performance Centre 87
Stratetgic Recommendation 2 - Sustainable Facilities in
9.
Auckland
89
9.1 Is there an overSupply? 89
9.2 Retaining Revenue 89
9.3 Diversification of Revenue 90
9.3.1 New Customers/Consumers = New Golf Experiences and Services 90
9.3.2 Facility design 90
Conclusion
92
10.
10.1 Next Steps 92
Appendix 1 RPS Process
93
Auckland Golf Facility Strategy 5
EXECUTIVE SUMMARY
1.
This Report was prepared for New Zealand Golf Inc. (NZ Golf) to provide strategic direction for golf facilities in Auckland. The intent of the project has been to enable NZ Golf to make informed and objective decisions in relation to investing in, or supporting investment in, golf facilities in the Auckland region, such that the following aims can be achieved:
Increased participation in golf and more Aucklanders more active more
often;
Establishment of a financially sustainable network of quality golf facilities in
Auckland;
Increased utilization of golf facilities in Auckland;
Clarity for key stakeholders in golf facilities in relation to their role in owning and operating golf facilities.
The Auckland region has unique challenges and opportunities for golf facilities. While Auckland has the highest density of golf courses in the country, it also has the highest population per club and the largest and fastest growing population (i.e. by number of additional people per annum) in New Zealand.
We note the following:
Forecast sustained high population growth for Auckland (two million people
by 2031);
Consequent increased demand for sport and recreational services;
Trend towards more intense utilisation of land in Auckland;
The number of golf courses and the large land area the sport of golf
commands.
Given the four factors above, it is prudent from a NZ Golf perspective to adopt a considered, planning based process to the future for golf facilities in Auckland.
This project has reviewed the golf facilities in the Auckland region in the context of both the current situation and the desired future aspirations of NZ Golf and key stakeholder in golf facilities.
There are a number of critical issues which the Auckland region needs to address to sustain golf facilities and grow the game of golf. The issues were identified through the national survey, research, data analysis and consultation. The issues identified fall within the following main categories below:
Increasing operational costs: Increasing customer expectations and climate
change effects (increasing scarcity of water) will continually adversely affect the operational expenditure of golf courses.
Lack of income diversity: Golf courses have traditionally relied upon
membership revenue as their main source of income.
Lack of diversity in golf experiences and player pathways: Golf facilities are
Auckland Golf Facility Strategy 6 alongside societal and technological trends or diversifying the golf experience enough to attract new participants.
Quality of Service:20% of clubs in Auckland that rated their main built assets
as “old condition (requires significant future investment; has not had ongoing maintenance)”. This is a significant issue to consider when overlaid with increasing customer expectations and increasing operational costs.
Oversupply of rounds in Auckland and low utilization: Utilisation of golf courses
across Auckland is very low at 23%. There is an oversupply of relatively homogenous golf services and facilities and therefore an oversupply of rounds at these facilities.
Untapped target markets: Golf is currently meeting the needs of a relatively
narrow part of the potential market and there is considerable opportunity for participation growth in new market segments. For example the Children and Young Persons Survey reports the following:
o Golf’s participation ranking of 8th in the Active Participation Survey
(see Figure 2) and that includes at least two activities that would not be classified as sport;
o Golf’s very low regular participation rate among eleven to eighteen
year olds of 1.1% to 3.9%;(see Table 5 above);
o Golf’s sport participation ranking for boys between 13th to 17th place
in Table 7. Note: Golf does not rank as a participation sport for girls. Given this information, and the positive characteristics of golf (safety, accessible to all shapes and sizes, ages and abilities), it would appear there is tremendous potential to develop services and offerings that attract young people to the game.
Communities & Demographics: It is of critical importance that golf clubs
identify their target market and tailor their golf facilities and services to the needs of that market. If the nearby surrounding population comprises a substantial proportion of the club’s target market, the demographics of the club’s Local Board Area needs to be examined and incorporated in all aspects of planning.
Barriers to change: Golf facilities are mainly governed by members, for
members. This represents a significant potential barrier to change.
The issues listed above impact the long term sustainability of golf facilities and need to be addressed if the region is to have a quality network of golf facilities. The greatest risk facing golf identified by Victoria University and supported by the facility survey is the declining membership base across all clubs generally. The lack of members not only affects clubs’ incomes, but also the ability to reinvest and maintain the assets at an acceptable level.
1.1 STRATEGIC RECOMMENDATION 1 – HIERARCHY OF GOLF FACILITIES It is recommended that NZ Golf deploy the Hierarchy of Golf Model for a Metropolitan area, over time as opportunities arise (with Clubs, Auckland Council et
Auckland Golf Facility Strategy 7 al) to influence, and where practical lead, decisions in golf facility capital investment, market segment prioritisation, facility role in the Auckland network of golf facilities and facility services provision.
The aim of the model is to aid the process of designing the desired future network of sustainable golf facilities in Auckland with an emphasis on the need for greater diversification of accessible golf experiences for a greater number of golf customers.
•6 or 9 hole par 3 course •Practice facilities
•Coaching and training programmes •Rental clubs
•Strategic partnerships with schools •Affiliation with Development Course •Inclusive and social atmosphere
•Innovative golf approaches and technologies
Introductory
Course
•9 or 18 hole course of average difficulty •Practice facilities
•Coaching and training programmes •Affiliation with Introductory Course •Social atmosphere
•Innovative golf approaches and technologies •Introduction to friendly competition
•Executive course length options
•Additional facilities and services to meet needs of the target market
Development
Course
•18+ hole championship level course •High quality course and facilities •Onsite PGA pro and proshop •Full club house facilities •Membership based •Training technologies
•National and regional competitions
•Affiliation with NZ Golf High Performance Centre •Additional facilities and services to meet needs of the
target market
Advanced
Course
•Accessibility to high performance and non-high performance support services
•High population base and potential to develop successful commercial and community revenue earning programs and services are important factors for choosing the location of the Centre
•Extensive practice facilities •Meeting rooms
•Strength and conditioning facilities •Club making and repair workshop
•Access and affiliations with a range of advanced courses
High
Performance
Centre
Auckland Golf Facility Strategy 8 1.2 STRATEGIC RECOMMENDATION 2 – SUSTAINABLE FACILITIES
NZ Golf seeks to support the needs of golf in the region and increase the probability of financial sustainability. Sustainability is largely achieved not through reduced costs but through increased revenue.
The population of Auckland is projected to reach approximately two million residents by 2031 and if there were to remain 39 golf clubs at that point, there would be one golf club per 50,464 residents (as of 2011 there were 38,659 Auckland residents per golf course). Additionally the city will become denser with residential housing therefore open space and recreation areas will become of greater importance to the World’s Most Livable City.
Retaining Revenue
The predominant user group in Auckland is members of golf clubs (89%). These members are well catered for; 81% of the facilities for which data was available are
clubs that are classified as Traditional Mid Level Clubs1.
The average Quality of Service offered in Auckland should be improved to assist retaining members.
Golfers primarily play for social reasons and social benefits are valued above all other membership benefits for current members. Therefore the provision of welcoming and social golf facilities for the next generation club member promotes a necessary, positive club culture and encourages socially engaged golfers to play more golf more often.
Diversification of Revenue
Sustainability will be achieved through retaining existing members and through increased and diversified revenue. Increasing and diversifying revenue can be achieved in a number of ways:
• Offering new golfing experiences and products;
• Attracting new customers/consumers to the sport of golf;
• Through functional design the facilities can be used for a variety of
community, well-being and social activities. Facility design
The facility, both green and built assets, need to be designed to reflect their intended use (within the Hierarchy of Golf Facilities), reflect their intended customer and with the aim of maximizing their revenue generating ability.
Built Assets
The built assets, through functional design, need to enable the facilities to be used for a variety of community and social activities for multiple user groups and to reflect the demographic and consumer utilizing the facility whilst creating much needed revenue options.
1 Refer page 44 – Traditional Mid Level Club refers to a club that has open membership, junior
membership, on-site or off-site professional, readily available green fee times, practice putting area, driving range.
Auckland Golf Facility Strategy 9
Green Assets
The design of the green assets should reflect the classification of the facility as described by the hierarchy of facilities and the target market of the golf facility. Additionally the green assets should consider shared spaces including networks of cycle ways and pedestrian pathways through the facility.
The impact of the Auckland Plan, future environmental challenges including water conservation and sun protection, increasing operational costs are critical to facility planning.
It is recommended that NZ Golf use their role as a National Sporting Organisation (NSO) to ensure the retention of the current network of golf facilities in Auckland. However, NZ Golf also needs to lead and influence the transformation of some golf facilities into facilities that meet new and emerging market needs for new golf customers seeking non-traditional golf experiences.
This can be achieved by using the Hierarch of Golf Facility model above, the RPS model (refer to National Facilities Strategy) and by working in collaboration with Clubs.
1.3 STRATEGIC RECOMMENDATION 3 – AUCKLAND COUNCIL
The Local Government Act 2002 (LGA 2002) states that the purpose of local government is in part to promote the social, economic, environmental, and cultural well-being of communities, in the present and for the future.
Local governments should provide networks of accessible, high quality open spaces and sport and recreation facilities, in both urban and rural areas, which meet the needs of residents and visitors, are fit for purpose and economically and environmentally sustainable.
Auckland Council owns the land for 13 golf courses throughout the Auckland region. Of these courses, the lease for one course is managed by Auckland Council Parks and Recreation, the leases for three courses are managed by Auckland Council Property Limited and the leases for the remaining nine courses are managed by the Auckland Council Community Lease Team. All of these golf courses have varying models of contract in operation.
Consultation with eight city councils around New Zealand demonstrated the importance of a Service Level Agreement (SLA) in the lease.
An SLA is mutually beneficial to both parties of the contract. The operators know exactly what is expected of them before entering the agreement and the owners know exactly what services they can expect. Should there be any disputes, the SLA clearly defines what is and is not expected.
Research of international Council-owned golf facilities identified several management structures with potential for hybrids of these structures. Each management structure has its merits for different situations so it is important that Council, when reviewing its role in the management and operation of golf facilities, address the following questions for each facility:
Auckland Golf Facility Strategy 10
• What is Council trying to achieve through this facility? Participation?
Revenue?
• What is the user profile of this facility? Is it a community level facility or is it a
more commercially driven facility?
• What is the extent of involvement that Council wants to have in the
management and governance of the facility? What resources does Council have available/willing to dedicate to management of the facility?
• What tolerance does Council have for financial risk in regards to this facility?
If the chosen structure is anything outside of full self-operation, creating a proper SLA will be of critical importance for Council as well as assigning a Council representative responsible for inspecting the facilities and ensuring contract compliance.
Auckland Golf Facility Strategy 11
INTRODUCTION
2.
2.1 PROJECT OVERVIEW
New Zealand Golf Inc. (NZ Golf) is the governing body for golf in New Zealand and is responsible for fostering and developing the sport.
This report is the result of a NZ Golf commissioned independent review of the golf assets located in the Auckland region. It provides insight into the challenges and opportunities facing those who manage golf facilities in Auckland. For NZ Golf and Auckland Council the report will facilitate and support informed decision making in relation to future golf assets in the region. The aim of this project, in part, has been to identify golf asset profiles that have an increased likelihood of on-going sustainability. The Auckland region has unique challenges and opportunities for golf facilities. While Auckland has the highest density of golf courses in the country, it also has the highest population per club and the largest and fastest growing population (i.e. by number of additional people per annum) in New Zealand.
We note the following:
Forecast sustained high population growth for Auckland (2 million people by
2031);
Consequent increased demand for sport and recreational services;
Trend towards more intense utilisation of land in Auckland;
The number of golf courses and the land area the sport of golf commands.
Given the four factors above, it is prudent from both a NZ Golf and Auckland Council perspective to adopt a considered, planning based process to the future for golf facilities in Auckland.
NZ Golf seeks to increase participation, improve golf experiences and ensure financial sustainability at all levels of the game. Auckland Council is committed to Auckland being the world’s most liveable city and getting more Aucklanders more active more often.
This project has reviewed golf assets in the Auckland region in the context of both the current situation and the desired future aspirations of NZ Golf.
2.2 PROJECT INTENT
The specific aims of this project were to:
Undertake an assessment of Auckland’s golf asset portfolio;
Provide an assessment against the national framework and to identify gaps
and opportunities for Auckland;
Provide recommendations for Auckland Council on options in relation to
ownership and operation of golf assets.
O’Connor Sinclair understands the intent of the project has been to enable NZ Golf to make informed and objective decisions in relation to investing in, or supporting
Auckland Golf Facility Strategy 12 investment in, golf facilities in the Auckland region, such that the following aims can be achieved:
Increased participation in golf and more Aucklanders more active more
often;
Establishment of a financially sustainable network of quality golf facilities in
Auckland;
Increased utilization of golf facilities in Auckland;
Clarity for key stakeholders in golf facilities in relation to their role in owning and operating golf facilities.
2.2.1 Information Gaps
The National Survey was conducted among 393 golf clubs in New Zealand. The results from the National Survey have formed the basis of the analysis of the golf environment in Auckland. Of the 39 golf clubs located within the Auckland region:
31 golf clubs responded to the Survey;
Of the 31 golf clubs, some golf clubs only partially completed the Survey;
The eight golf clubs which did not respond to the Survey included:
Chamberlain Park Golf Club;
Formosa Country Club;
Howick Golf Club;
Pupuke Golf Club;
Whangaparoa Golf Club;
Great Barrier Golf Club;
Royal Navy;
RNZAF.
For purposes of the analysis Royal Navy, RNZAF and Great Barrier have been excluded and considered outliers due to the following;
Great Barrier is isolated from the main Auckland region;
RNZAF Golf Club is managed, administered and resourced as well as primarily
used by a singular organization (RNZAF).
Therefore, it is assumed that Great Barrier and RNZAF Golf Club are not subjected to the same influences as the other clubs in the Auckland region and have been excluded from analysis.
For the five other clubs that did not respond to the Survey and the clubs that only partially completed the Survey, information gathered through clubs websites, DotGolf or averages from the rest of the Auckland region were applied to those clubs.
The data gathered through the Survey is presented in the form of indicators. Indicators were developed in conjunction with NZ Golf in order to compare the clubs in meaningful ways. These indicators are for internal purposes only.
2.2.2 Terminology
Auckland Golf Facility Strategy 13
Golf facility refers to the Golf course and the Club facilities;
o Golf course refers to the green (i.e. grass) assets;
o Club facilities refers to the built assets (i.e. the buildings);
The Golf Club refers to the organisation that operates and utilizes the Golf
Auckland Golf Facility Strategy 14
AUCKLAND
3.
3.1 POPULATION GROWTH
Auckland’s population reached 1.5 million in 2012 and will continue to grow. It is estimated that the population will reach almost 2 million by 2031. Auckland’s unique environment and diverse population provide opportunities for creating unique recreation spaces.
Figure 1 below illustrates Auckland’s forecast population growth rate compared to other New Zealand main cities.
Figure 1: Projected population growth from 2006 to 2031 for Auckland and other main cities.
In the latest census data from 2006, updated in 2012, New Zealand had a population of 4,184,600 people, of which 33% (1,373,000) resided in the Auckland region. It is predicted that by 2031, 38% (1,968,100) of the projected 5,194,600 residents in New Zealand will live in the Auckland region.
Auckland is expected grow by 595,100 people between 2006 and 2031 with an average annual growth rate of 1.5%. By number of additional people per annum, this represents the highest expected growth rate of all regional council areas in New Zealand.
Auckland Golf Facility Strategy 15 3.1.1 Local Board Population & Demographics
As of the 2006 census, Howick, Henderson-Massey and Albert-Eden were the three most populous local board areas while Great Barrier, Waiheke and Papakura had the lowest populations.
By 2031, it is projected that Howick will remain as the most populous local board area, increasing by 65% to 196,800 residents. Henderson-Massey is projected to remain as the second most populous local board area growing 39% to 143,900. Albert-Eden is expected to increase in population by 23% and Waitemata is projected to be the third largest population with an 89% increase to 125,800. In 2031, Great Barrier and Waiheke are expected to remain as the local board areas with the smallest populations.
Franklin and Waitemata have the greatest percentage of residents employed at 70% each. Mangere-Otahuhu has the lowest percentage of residents employed at 55%. Median household incomes range from $22,501 in Great Barrier to $88,714 in Orakei. 3.2 AUCKLAND AGE PROFILE
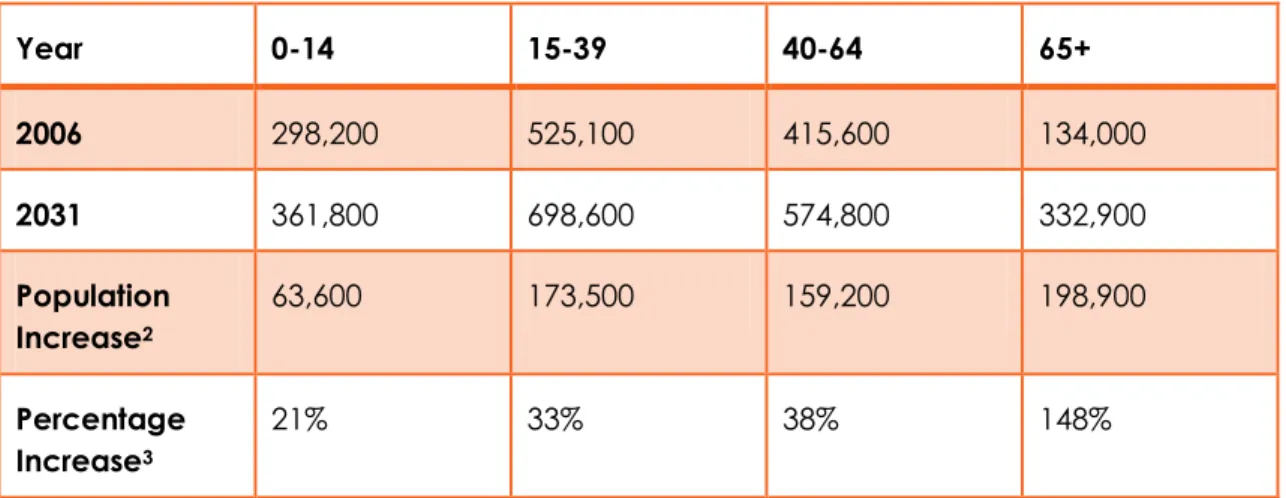
In the 2006 census, more than one third (37.2%) of the Auckland population was under the age of 24 years which equates to 33.8% of young people in New Zealand. Statistics New Zealand data suggests the number of children and young people in New Zealand will double by 2031. The proportion of young people within Auckland’s population is expected to decrease from 37.2% to 32.1% in that period. The median age of Auckland residents is projected to increase from 35.5 in 2006 to 39.8 in 2031. Table 1 below shows the Auckland region projected population increase by age groups.
Table 1: Current and projected age profile of Auckland residents
Year 0-14 15-39 40-64 65+ 2006 298,200 525,100 415,600 134,000 2031 361,800 698,600 574,800 332,900 Population Increase2 63,600 173,500 159,200 198,900 Percentage Increase3 21% 33% 38% 148%
As can be seen from Table 1, the majority of Auckland residents in 2031 will continue to be between the ages of 15 and 39 while the largest percentage increase is expected to be in the 65+ age group.
2 O’Connor Sinclair interpretation 3 O’Connor Sinclair interpretation
Auckland Golf Facility Strategy 16 Natural increases (births minus deaths) are expected to account for 66% of Auckland population growth to 2031 and net migration (external and internal) is expected to
account for 34% of the increase4.
3.3 AUCKLAND ETHNIC PROFILE
As can be seen in Table 2 below, in 2006 residents of European ethnicity represented the largest percentage of Auckland’s population at 56.5%. The second largest ethnicity group was Asians at 18.9% followed by Pacific Peoples at 14.4%.
Europeans in Auckland represent 26.8% of Europeans in New Zealand while Asians and Pacific Peoples in Auckland represent 66.1% and 66.9% of all Asians and Pacific Peoples in New Zealand.
Table 2: Ethnic Composition of Auckland Region Population as at the 2006 census.5
Total response Ethnic group as a % of Auckland population Total Responses New Zealand Auckland population as a % of NZ total European 698,622 56.5 2,609,589 26.8 Mäori 137,133 11.1 565,329 24.3 Pacific Peoples 177,936 14.4 265,974 66.9 Asian 234,222 18.9 354,552 66.1 Middle Eastern/ Latin America/ African 18,555 1.5 34,746 53.4 New Zealander 99,258 8.0 429,429 23.1 'Other' Ethnicity 648 0.1 1,494 43.1 Total People 1,237,239 - 3,860,163 32.1
Table 3: Region of birth, for those aged 15 years and over, of Auckland region residents (2006)6
Number of residents Percentage % New Zealand 552,123 57.6
Australia 16,116 1.7
Pacific Islands 89,976 9.4
United Kingdom and
Ireland 81,765 8.5
Europe (excl. United
Kingdom and Ireland) 23,697 2.5 North America 7,725 0.8
Asia 147,948 15.4
Other 38,781 4.0
4 O’Connor Sinclair interpretation
5 Source -
http://monitorauckland.arc.govt.nz/our-community/ethnicity-and-diversity/ethnic-composition.cfm
6http://www.arc.govt.nz/albany/fms/main/Documents/Auckland/Population%20and%20stats/I
mmigration%20and%20Ethnicity%20in%20the%20Auckland%20region%202006.pdf 2006 Census Series - Immigration and Ethnicity in the Auckland Region
Auckland Golf Facility Strategy 17
Number of residents Percentage % Not Elsewhere Included 56,367
-Total aged 15 years and over
1,014,495 100.0
3.4 SO WHO IS PLAYING GOLF?
Outlined below is summary research information that provides insight into who is playing golf.
3.4.1 Active Participation
Findings from the 2007/08 Active New Zealand Survey – Golf are presented in Figure 2 below. A total of 4,443 adults aged 16 years and over participated in the 2007/08 Active New Zealand Survey.
Figure 2: 2007/2008 Active NZ Survey – Participation in Golf compared to other sports The Active New Zealand Survey highlights the prominence of golf as a participation activity; with nearly 13% of adults aged 16 and over having played at least once in the period covered by the survey.
Other useful data:
Among adults who played golf at least once over 12 months:
37.3 percent (155,242 people) had participated in an organised golf
competition or event;
15.6 percent (64,815 people) had received instruction from a coach,
instructor, trainer or teacher to help improve their golfing performance;
6.6 percent (95% CI: 5.4–7.8) of all New Zealand adults (213,051 people)
played golf at least once during any one month;
86.5% of these adults reported that the most common location for playing golf
Auckland Golf Facility Strategy 18 Table 4 below provides a breakdown of the participants in golf across New Zealand, as recorded in the Active New Zealand Survey.
Table 4: Golf Participant Demographics
Percentage (95% CI) Population
Total Population 12.8% (11.3-14.4) of New Zealanders play golf
416,221
Men 20.4%(17.8-22.9) of men in
New Zealand play golf
317,639
Women 5.8% (4.4-7.2) of women in New Zealand play golf
98,582 16-24 Year 11.0 (7.4-14.5) 60,306 25-34 Years 15.8(12.2-19.3) 85,748 35-49 Years 12.3(9.6-14.7) 115,210 >50 Years 12.5(10.4-14.7) 154,959 Maori 13.1(9.9-16.3) 54,298 Pacific 6.3(2.6-10.0) 11,597 NZ European 14.5(12.6-16.4) 324,024 Asian 7.2(3.7-10.7) 26,803 Quintile 1 – no deprivation characteristics 14.4 (12.4-16.4) 293,096 Quintile 2 – one deprivation characteristic was reported 13.2(10.1-16.3) 85,848 Quintile 3 – two deprivation characteristics were reported; 6.5 (3.3-7.8) 22,463
Quintile 4 – three or four deprivation characteristics were reported;
4.8(1.8-7.8) 12,062
Auckland Golf Facility Strategy 19
Percentage (95% CI) Population Quintile 5 – five or more
deprivation characteristics were reported.
From the perspective of NZ Golf’s goal of increasing participation in golf, and Auckland Council’s aspiration of more people more active more often, findings to
note from Table 4 include the following7:
Nationally, 5.8% of women played golf at least once in the survey period and
of those men and women who participate in golf, women represent approximately 24% of participants;
o Given approximately 51.5%8 of the Auckland 15 years and over
population is female, there may be an opportunity for NZ Golf to provide services that attract more women into golf.
People over 35 years of age represent 65% of participants in golf and 24.8% of
people in this age group played golf at least once in the survey period;
o Given projected increase in the median age of Auckland residents
from 35.5 to 39.8, and significant proportion of population growth in the 40+ age groups, the implications on the golf service offerings may need to be reviewed to retain and further increase participation for older participants.
People aged between 16 and 35 years of age represent 35% of participants
and 26.8% of people in this age group played golf at least once in the survey period;
o Given the largest proportion of the Auckland population is, and will
remain, in the 15 to 39 age group, there may be an opportunity to increase the participation of this age group in golf from the (relatively) low current base.
o We note that due to the physical characteristics of playing golf, it is a
game for life and so successful investment in increasing the participation in the 15 to 39 age group (and indeed younger age groups) should have cumulative beneficial effects.
People of European ethnicity represented 77.84% of participants and 14.5% of
people in this group played golf at least once in the survey period;
o Given the increasingly diverse ethnic make-up of Auckland (43.50%
non-European in 2006) there may be an opportunity for NZ Golf to provide services that attract more non-Europeans into golf.
In terms of deprivation characteristics by Quintile, we note that 70.4% of golf
participants exhibited no deprivation characteristics. Therefore it is logical to conclude that golf is mainly focused on service offerings that satisfy the needs of those people who are, in relative terms at least, financially comfortable;
7 It is recognised the data is based on all of New Zealand, not Auckland specifically.
8 Statistics NZ Dataset: Auckland local board population projections by sex and age,
2006(base)-2031: Projected 30 June 2011, 605,800 are female 15 and over of a total population of 1,1176,300: 51.5%
Auckland Golf Facility Strategy 20
o There may be opportunities to provide service offerings in golf that
meet the needs of a wider audience profile, in terms of income and financial security.
In summary, the data shows that NZ Golf has the opportunity to increase participation by:
Strategies focused on retaining the current player base;
Considering new customer segments and designing services that attract these
segments to the game and that meet their particular needs.
Likewise, Auckland Council has the opportunity to get more people more active through golf.
3.4.2 Young Persons Survey
Over 17,000 young people (5 to 18-year-olds) from over 500 primary, intermediate and secondary schools across New Zealand took part in Sport New Zealand’s 2011 Young People’s Survey. Tables 5 to 7 below present summarised data from the survey as it related to golf participation.
Table 5: Young Persons Survey Data, Frequency of Boys and Girls Participating in Golf.
Years Boys Girls
Not done this year % Done a few times this year % Done regularly* this year % Not done this year % Done a few times this year % Done regularly* this year 7 -10 (mostly 11 to 14-year-olds) 62.5 33.6 3.9 80.5 17.5 2.0 11-13 (mostly 15 to 18-year-olds) 71.0 26.2 2.8 84.0 14.9 1.1
Table 6: Young Persons Survey Data, Boys and Girls Participating in Golf.
Years Boys Girls
Done while “mucking around”* Organised by school (outside of class time) With a club (outside of Done while “mucking around” % Organised by school (outside of class time) With a club (outside of
Auckland Golf Facility Strategy 21
Years Boys Girls
% % school) % % school) % 7 -10 (mostly 11 to 14- year-olds) 24.2 4.6 8.1 12.1 2.2 2.7 11-13 (mostly 15 to 18- year-olds) 20.1 6.4 6.9 10.2 2.4 1.8
Participation rates for almost all sports/ activities are highest when young people are “mucking around”. Athletics, Màori activities and orienteering are three exceptions and these sports/activities have the highest participation rates in the school setting (for boys and girls in both age groups).
Participation rates for most sports/activities are higher in the school setting than with clubs. Golf, martial arts and tennis (for 10 to 14-year-olds) are some exceptions to this pattern.
Table 7: Sport Participation Ranking of Golf by Age and Gender.
Boys Girls
Golf Participation Ranking % Golf Participation Ranking %
5-10 17 2.4 Girls participation does not feature in the results
-
11-14 18 3 Girls participation does not feature in the results
-
15-18 13 2.5 Girls participation does not feature in the results
-
Auckland Golf Facility Strategy 22
Golf’s participation ranking of 8th in the Active Participation Survey (see Figure
2) and that includes at least two activities that would not be classified as sport;
Golf’s very low regular participation rate among eleven to eighteen year olds
of 1.1% to 3.9%;(see Table 5 above);
Golf’s sport participation ranking for boys between 13th to 17th place in Table
7. Note: Golf does not rank as a participation sport for girls.
Given this information, and the positive characteristics of golf (safety, accessible to all shapes and sizes and abilities), it would appear there is tremendous potential to develop services and offerings that attract young people to the game.
Indeed, it could be argued the sport is remiss in not offering accessible experiences that meet the needs of young people. Whereas many other sports place significant emphasis on young people, and tailor programs, competitions, club structures to attract young people to their sport (e.g. netball, football, rugby, athletics), golf is either ignoring this market or is not effective in serving this market.
We also note Sport New Zealand references to the survey confirming its priorities for young people’s sport and active recreation as:
• Providing quality sport experiences for young people and providing guidance
for parents, teachers, coaches and other volunteers encouraging the education sector to provide more organised sport and recreation opportunities in schools;
• Supporting opportunities and investing in sport and recreation activities that
appeal to young people;
• Developing clubs and strengthening links with schools;
• Tackling drop-out by finding more ways to keep young people engaged in
sport and recreation in their teenage years;
• Supporting organisations that provide quality programmes for fundamental
movement and basic sports skills.
Sport New Zealand is a key strategic and funding partner in the delivery of sport and recreation in the community. Clearly it is interested in sports organisations that have commitment to and coherent plans that align with the five priorities above. This represents opportunity for NZ Golf (and Auckland Council). It may also represent future challenges if golf is unable or unwilling to tangibly provide access and services that attract and retain young people.
3.4.3 Participation & Membership Trends
A survey entitled “Increasing Nationwide Golf Club Membership & Participation Survey”, which sought to understand purchasing determinants and attitudes towards club memberships for New Zealand golfers, was conducted in March 2008. Outlined below is a summary of key findings from the survey.
Gender differences
• 10% of casual golfers are women, whereas 25% of members are women.
Auckland Golf Facility Strategy 23
• Women are more attracted to 9-hole golf and 9-hole memberships than men,
yet women report to have more time than men;
• Casual women golfers are more conscious of their golfing ability than men
and more readily seek golf tuition.
It is not evident that the Auckland region is providing sufficient diversity of golf services and facilities to attract female women to the game of golf.
Time is the critical barrier that influences casual golfers playing more golf and committing to membership, and social benefits are the most valued benefits
• Over half (53%) of causal golfers are aged between 25-44, compared to just
15% of members;
• 42% of all casual golfers report that time is the single greatest barrier to gaining
a membership;
• Almost all (87%) casual golfers report they would play more golf if they had
more time;
• Social benefits are valued above all other membership benefits for current
members;
• Casual golfers report social reasons as their strongest motivator for playing
golf.
It is not evident that the Auckland region is providing sufficient diversity of golf services and facilities to attract more people to play golf more often.
3.4.4 Conclusion
The strong theme that emerges from our review of population and survey data is as follows:
Golf is currently meeting the needs of a relatively narrow part of the market
and there is considerable opportunity for participation growth in new market segments for example young people, females, non- Europeans and casual players;
The logical questions that emerge from this conclusion are:
Why is golf serving such a narrow market?
Is this desirable and sustainable in terms of NZ Golf’s aims around participation
growth and Auckland Council’s aims to have ‘more people more active more often?
Are the Golf facilities in Auckland part of the current barrier to (and future
opportunity for) stimulating participation growth in the game of golf in the Auckland region?
Auckland Golf Facility Strategy 24 3.5 THE FUTURE OF AUCKLAND – THE AUCKLAND PLAN
The future of Auckland is guided by the Auckland Plan (30 year plan), adopted by Auckland Council in March 2012. It addresses and guides issues such as:
Transport and housing shortages;
Giving children and young people a better start;
Creating more jobs;
Protecting the environment.
The Auckland Plan articulates through Strategic Direction 5 ‘Promote individual and community wellbeing through participation and excellence in recreation and sport’ the importance of connecting the community with recreation. The Auckland Plan states that Aucklanders ‘will continue to have access to exciting and innovative opportunities to participate and achieve in recreation and sport’.
Auckland Council through this project is seeking to understand and clarify its role in providing golf facilities in Auckland. The Auckland Plan gives direction to encourage all Aucklanders, particularly children and young people, to participate in recreation and sport.
Therefore in Auckland Council’s role as a significant owner of golf facilities, it should aim to ensure that golf facilities in Auckland deliver products, services and experiences that promote increased participation in golf. It would seem logical that Auckland Council supports NZ Golf to prioritise segments of the market that are not currently regular participants in golf while also ensuring retention of those already participating in golf.
The strategic directions within the Auckland Plan which support this are:
Providing a variety of opportunities for participation at all ages is central to
planning for the future;
Quality public open space is a critical component for healthy lifestyles in an
urban environment. Protect and expand on the use of public space. For example, the use of new technologies, such as artificial turf, can improve the usability of sports grounds;
Street connectivity is a key design feature to promote and encourage
physical activity. It creates linkages between our parks and reserves;
Ensure there is a range and type of facilities available to support changing
preferences in recreational activities;
Encourage ethnic communities to participate in existing sporting codes, as
well as support sports which our new migrants enjoy. 3.5.1 Sports Hub & Public Space
The Auckland Plan also outlines the requirement for an improved coordinated Auckland-wide approach to planning clusters of recreational facilities with other amenities such as libraries, town centres, and transport facilities. That is, provide localised and accessible activities within community hubs. The hubs can include multiple sports clubs and facilities as appropriate.
Auckland Golf Facility Strategy 25
Revenue diversification;
Efficiencies in operating the facility through shared services;
Added value to customers.
Golf Clubs, which typically feature relatively large land areas, are usually single use facilities due to health and safety issues (i.e. a hard ball flying through the air). In a high population market, where many other sport facility assets have multiple uses (e.g. fields that have rugby, soccer, league uses) and/or considerable junior participation (e.g. netball) there is a risk for golf that a perception of Golf Clubs as large area, low utilisation facilities emerges.
As Auckland utilises residential areas more intensively, open space will become more important. The Auckland Plan directs that:
Higher residential and commercial density neighbourhoods encourage
walking and cycling through features such as connected street networks with public amenities such as parks, wide footpaths, street lighting, attractive street furniture, street trees and traffic calming;
Access to public open space will be maintained and improved as Auckland
grows, so that recreation remains an easy option. Networks of walkways, cycleways and bridleways can link our public open spaces;
The regional cycling network provides an opportunity for a transformational
shift to connect schools, tertiary facilities, public transport centres and key community infrastructure;
Auckland will strengthen the integrated planning and management of our
outdoor public spaces to develop walking, cycling and bridleway networks. Golf Clubs in Auckland, especially those which are in higher residential and commercially dense metropolitan areas, will need to consider how networks of walkways and cycleways can be incorporated into the layout of the golf course. Rather than a constraint on the facility, it may represent an opportunity. Benefits could include leveraging the large land area characteristic of golf facilities to achieve the following:
Promotion of the sport and the golf facility;
Improved community connection to the golf facility through increased foot
traffic;
Contribution to increased access to and utilisation of the open space and
therefore Golf facility sustainability as a relevant asset. 3.5.2 Events - ATEED
The Auckland Plan also proposes that for Auckland to fulfill its vision, residents need to support the sporting success of Aucklanders at national and international events which helps create a shared sense of identity and pride.
The Auckland Plan directs that Auckland needs to attract high-profile sporting events to New Zealand, with flow-on economic benefits and to build on Auckland’s strengths to attract sporting events of international standing to Auckland.
Auckland Golf Facility Strategy 26 Council Controlled Organisation (CCO) Auckland Tourism Events and Economic Development (ATEED), through its statement of intent, positions Auckland as a major events destination and will:
• Enhance domestic and international marketing of Auckland’s major events
offer;
• Leverage domestic and international recognition of Auckland’s brand
proposition through major events;
• Communicate and promote the outcomes of major events to residents and
ratepayers;
• Leverage RWC2011 as a springboard for future marketing activity.
The aim of Auckland is to be recognized nationally and internationally as having exceptional visitor and event experiences. For Auckland to be recognised as an international events capital, Auckland needs to deliver an array of different events. If Auckland is to deliver major golf event/s it requires investment and support of a golf facility that can host a high profile golf event.
Auckland’s golf clubs that have hosted past major golf events include:
Gulf Harbour - World Cup of Golf in 1999 and the New Zealand Golf Open on
the European Tour in 2005 and 2006;
Formosa Auckland Country Club - New Zealand Golf Open in 1998;
Royal Auckland Golf Club - Many National and International tournaments
have been held on the course including New Zealand Opens, New Zealand Amateurs and the Bonallack Trophy in 2006;
The Grange Golf Club - NZ Open in 2001 and has been used more than any
other course for hosting the New Zealand Open Championship.
Our understanding is that in order to achieve increased participation and other aims and objectives, NZ Golf does not consider being owner, promoter and/or operator of major events (the NZ Open excluded).
Our understanding of Auckland Council and ATEED priorities is that they are increasingly considering strategies that transition Auckland from a gateway city to a destination where visitors stay longer.
The potential role golf can play in these strategies is not clear; nor is the potential role that major golf events can play. What we can say is that should ATEED seek to secure or develop a major golf event, then Auckland Council would need to determine which golf facility in Auckland is most suitable and the extent of investment required to prepare that facility for the event.
Golf events around the globe and in particular Australia do receive significant investment from central and local government given the substantial profile and economic benefits they deliver. New Zealand Tourism is developing a golf tourism and events strategy to attract the quality large spending of golf visitors to New Zealand.
Auckland Golf Facility Strategy 27 3.5.3 World’s Most Liveable City
The Auckland Plan articulates the vision for Auckland as becoming the world’s most livable city.
In 2012, Auckland maintained its position as the world’s third most liveable city in the 2012 Mercer Quality of Living survey, and is the highest ranked city in the Asia-Pacific region.
The Mercer Quality of Life Survey is conducted by the American global human resource and related financial services consulting firm Mercer and releases annually the Quality of Living Survey, comparing 221 cities based on 39 criteria. New York is given a baseline score of 100 and other cities are rated in comparison. Important criteria are safety, education, hygiene, health care, culture, environment, recreation, political-economic stability and public transportation.
The total index is based on the following categories: Consumer goods
Economic environment Housing
Medical and health considerations Natural environment
Political and social environment Public services and transport Recreation
Schools and education Socio-cultural environment The 2012 World Rankings are as follows:
1. Vienna Austria;
2. Zurich Switzerland;
3. Auckland New Zealand;
4. Munich Germany; 5. Vancouver Canada; 6. Düsseldorf Germany; 7. Frankfurt Germany; 8. Geneva Switzerland; 9. Copenhagen Denmark; 10. Bern Switzerland.
Recreation is the 7th category in the Quality of Life Survey. The Recreation category
includes the following criteria and weighting:
Variety of restaurants =10 weighting;
Theatrical and musical performances = 8 weighting;
Cinemas = 9 weighting;
Sport and leisure activities = 10 weighting.
The Quality of Living September 2012 report for Auckland noted that Auckland is renowned for its sport and leisure activities.
In order to retain and improve Auckland’s ranking, in line with the vision of being the world’s most livable city, Auckland should maintain and maximize the offerings and utilisation of its golf facilities. Table 8 on the following page compares golf club per capita indicators across the main cities in the top Quality of Life Rankings. Of the cities
Auckland Golf Facility Strategy 28 listed Auckland has the lowest population per golf course, indicating that Auckland has more golf offerings relative to those other cities.
Table 8: City comparison of golf clubs per capita.
City Number of Golf Courses Golf Course Per Capita*
Auckland 39 38,659
Zurich Switzerland 7 271,429
Melbourne 74
Excludes VGL and VWGL clubs and womens golf network
56,339
Vancouver 44 56,276
Sydney Sydney Metro Area Metro Zone A 31 Metro Zone B 30 Metro Zone C 30
50,850
Perth 38 45,758
*Calculated using 2012 population estimates.
3.6 CITY GROWTH – THE URBAN SPRAWL
The Auckland Plan identifies the need to provide for up to 400,000 additional households and 275,000 employees by 2040. On the basis of moving to a quality compact Auckland, 70% of this future residential growth is intended to be accommodated within the existing urban area over 30 years. At the same time, provision will be made for up to 40% of new homes and new business land to be accommodated outside the existing metropolitan urban area (for example Pukekohe and Warkworth).
The Rural Urban Boundary (RUB) replaces the previous Metropolitan Urban Limit (MUL) and will define the maximum extent of urban development in greenfield land to help meet the growth projected in the Auckland Plan. There are 160,000 new dwellings proposed in rural Auckland and 280,000 new dwellings in urban Auckland. Figure 3 on the following page illustrates the residential expansion across the Auckland region.
Auckland Golf Facility Strategy 29 Figure 3: Auckland residential expansion9.
70% of Auckland future residential growth is intended to be accommodated within existing urban areas. This will create a greater population density and therefore increasing importance in maintaining open space for recreation and play as areas are more intensively utilised (By building up and not out).
Consideration needs to be given to maintaining and protecting the land currently used for golf. Consideration should also be given to making some of the land, currently used exclusively for golf, a shared space environment, for example; footpaths, cycle-ways, multi sports or sports hub environments.
Issues to give consideration to may include:
• Protecting greens;
• Hours of operations;
• Sports that could align or co-habitat with golf clubs due to the community
need or the demographic of the main user group of the golf club.
Figure 4 below illustrates the proposed residential expansion in relation to the location of the existing golf courses (green dots).
Auckland Golf Facility Strategy 30 Figure 4: Proposed Auckland Residential Expansion in relation to existing golf courses. The increase in the Rural Urban Boundary through greenfield areas for future
residential and business land will be a staged release over the next 30 years. 3.6.1 Golf & Recreation Land
The Unitary Plan will be Auckland’s planning ‘rulebook’, setting out where and how Auckland grows in the future, the draft Auckland Unitary Plan issued in March 2013 for consultation is subject to change.
The new Unitary Plan will replace the existing 31 Open Space zones in the existing District Plans with four new Public Open Space zones. The four new Public Open Space zones are:
Informal Recreation;
Sport & Active Recreation;
Civic & Community;
Major Recreation Facilities.
The purpose of zoning public open space is to acquire and develop a high quality network of public open spaces and recreation facilities and will become of greater importance as the city grows. The majority of Golf courses fall within the proposed new Sport & Active Recreation zone. This zone ‘…provides for a range of indoor and outdoor organised sporting and active recreation activities. It applies to open space in which sportsfields, equestrian activities, hard court areas, greens and associated buildings predominate. Most sites will retain an open, spacious character….’
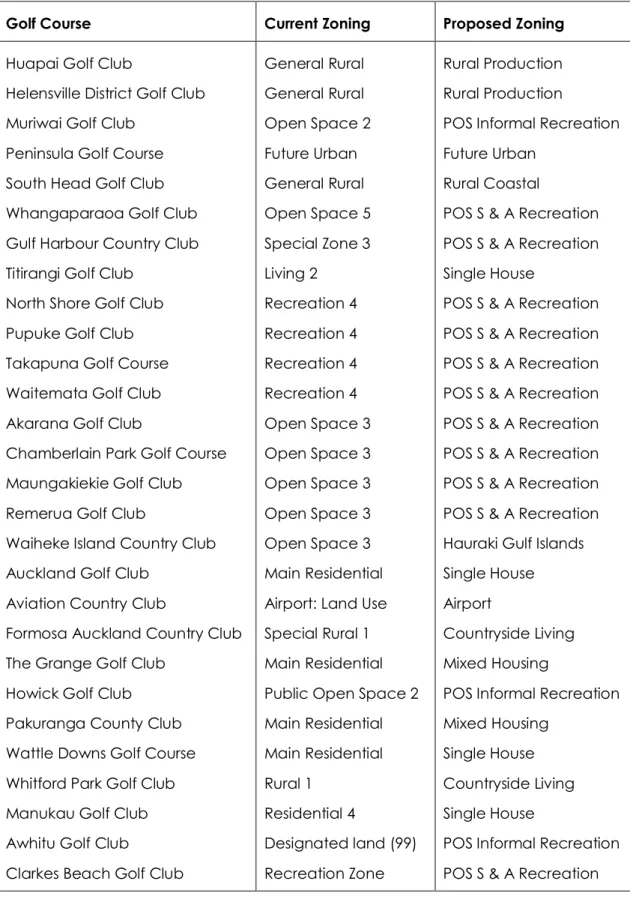
Auckland Golf Facility Strategy 31 Table 9 below lists Auckland golf courses, current zoning and the proposed zoning under the Unitary Plan.
Table 9: Auckland Golf Course Rezoning in the Draft Unitary Plan
Golf Course Current Zoning Proposed Zoning
Huapai Golf Club
Helensville District Golf Club Muriwai Golf Club
Peninsula Golf Course South Head Golf Club Whangaparaoa Golf Club Gulf Harbour Country Club Titirangi Golf Club
North Shore Golf Club Pupuke Golf Club Takapuna Golf Course Waitemata Golf Club Akarana Golf Club
Chamberlain Park Golf Course Maungakiekie Golf Club Remerua Golf Club
Waiheke Island Country Club Auckland Golf Club
Aviation Country Club
Formosa Auckland Country Club The Grange Golf Club
Howick Golf Club Pakuranga County Club Wattle Downs Golf Course Whitford Park Golf Club Manukau Golf Club Awhitu Golf Club
Clarkes Beach Golf Club
General Rural General Rural Open Space 2 Future Urban General Rural Open Space 5 Special Zone 3 Living 2 Recreation 4 Recreation 4 Recreation 4 Recreation 4 Open Space 3 Open Space 3 Open Space 3 Open Space 3 Open Space 3 Main Residential Airport: Land Use Special Rural 1 Main Residential Public Open Space 2 Main Residential Main Residential Rural 1 Residential 4 Designated land (99) Recreation Zone Rural Production Rural Production
POS Informal Recreation Future Urban
Rural Coastal
POS S & A Recreation POS S & A Recreation Single House
POS S & A Recreation POS S & A Recreation POS S & A Recreation POS S & A Recreation POS S & A Recreation POS S & A Recreation POS S & A Recreation POS S & A Recreation Hauraki Gulf Islands Single House Airport
Countryside Living Mixed Housing
POS Informal Recreation Mixed Housing
Single House Countryside Living Single House
POS Informal Recreation POS S & A Recreation
Auckland Golf Facility Strategy 32
Golf Course Current Zoning Proposed Zoning
Maramarua Golf Club Onewhero Golf Club Pukekohe Golf Club Waiuku Golf Club
Rural Zone Rural Zone Rural Zone Recreation Zone
Now outside Auckland Now outside Auckland Rural Production POS S & A Recreation 15 of the golf courses are zoned Public Open Space (either Informal or Sport & Active Recreation); however, another 15 of the golf courses are proposed to be zoned for other use.
It’s noted from this list provided by Auckland Council that a number of golf courses are not included on the list. These clubs are:
Maxwells;
Omaha Beach;
Redwood Park;
Waitakere;
Warkworth.
This list was not comprehensive as the list was prepared to demonstrate the different approaches that the former Councils had to the zoning of golf courses as opposed to a definitive list of golf course zoning.
It is not within the scope of this project to assess and comment upon the potential impacts the proposed Unitary Plan will have on golf facilities in Auckland. However we note the Auckland Council consultation process. We recommend that;
NZ Golf forms a view on the risks and opportunities the Unitary Plan presents
for golf in the region, relative to NZ Golf’s aspirations for the game;
Auckland Golf Facility Strategy 33 3.7 CLIMATE / ENVIRONMENTAL
One of the main costs to golf clubs is the operational and maintenance costs of the green assets. These costs are significantly impacted by climate conditions. An example of this is the 2013 drought where a number of golf courses have had to purchase water to irrigate greens and fairways.
NIWA scientists have prepared New Zealand climate change scenarios for 2040 and 2090 for the "Guidance Manual" for local government organisations. This has been published by the Ministry for the Environment and is an update of the 2004 "Guidance Manual" (Ministry for the Environment, 2008).
Table 10 below qualitatively summarises the main features of the New Zealand climate projections. All estimates in Table 10 represent the best current scientific estimate of the direction and magnitude of change. The degree of confidence placed by NIWA scientists on the projections is indicated by the number of stars in brackets.
Table 10: Main features of New Zealand Climate Change Projections for 2040 and 2090 (Ministry for the Environment, 2008).
Climate
variable Direction of change Magnitude of change Spatial and seasonal variation Mean temperature Increase (****) All-scenario average 0.9°C by 2040, 2.1°C by 2090 (**) Least warming in spring season (*) Daily temperature extremes (frosts, hot days) Fewer cold temperatures and frosts (****), more high temperature episodes (****)
Whole frequency distribution moves right (see Ministry for the
Environment, 2008)
See Ministry for the Environment, 2008
Mean rainfall Varies around country, and with season. Increases in annual mean expected for Tasman, West Coast, Otago, Southland and Chathams; decreases in annual mean in Northland, Auckland, Gisborne and Hawke’s Bay (**)
Substantial variation around the country and with season (see Ministry for the Environment, 2008)
Tendency to increase in south and west in the winter and spring (**). Tendency to decrease in the western North Island, and increase in Gisborne and Hawke’s Bay, in summer and autumn (*)
Extreme rainfall
Heavier and/or more frequent extreme rainfalls (**), especially where mean rainfall increase predicted No change through to halving of heavy rainfall return period by 2040; no change Increases in heavy rainfall most likely in areas where mean rainfall is projected to increase (***)
Auckland Golf Facility Strategy 34
Climate
variable Direction of change Magnitude of change Spatial and seasonal variation
(***) through to fourfold
reduction in return period by 2090 (**) [See note 2]
**** = Very confident, at least 9 out of 10 chance of being correct. Very confident means that it is considered very unlikely that these estimates will be substantially revised as scientific knowledge progresses.
*** = Confident
** = Moderate confidence, which means it is more likely than not to be correct in terms of indicated direction and approximate magnitude of the change.
* = Low confidence, but the best estimate possible at present from the most recent information. Such estimates could be revised considerably in the future.
Figure 5 illustrates the projected annual mean precipitation change for the period from 1990 to 2040.
Figure 5: Projected Annual Mean Precipitation Change for the Period from 1990 to 204010
Auckland Golf Facility Strategy 35 For Auckland the scarcity of water is predicted to become an issue and this could adversely affect the financial situation of golf clubs that need to purchase water to maintain green assets.
Some of the trends observed overseas, that may be useful for course management in Auckland include:
Course design based on sustainable management principles, for example
planting native perennials, increasing the amount of low maintenance vegetation, allowing ponds and wetlands to become more natural;
New technologies becoming mainstream that support more efficient water
use and reduce chemical dependence;
Innovative grassing techniques including the introduction of drought and
disease resistant turf grasses that survive low quality irrigation water.
Water-recycling, unused water reclamation, and improved irrigation technologies will
become more central to course management. 11
Auckland Golf Facility Strategy 36
GLOBAL GOLF
4.
It is generally accepted that modern golf evolved in Scotland during the Middle Ages. The game found international popularity in the late 19th century where it spread to the United Kingdom and then to the British Empire, the United States of America, throughout Europe and Japan. New Zealand golf history indicates that there were attempts to establish a golf course in Otago as early as 1871 and by 1890 the game in New Zealand began to flourish.
Golf is a genuine global game, with the sport in each country influenced by similar global technological, environmental and societal trends albeit with aspects of country unique situations.
4.1 GLOBAL CHALLANGES
There are a number of worldwide trends that have the potential to adversely (or positively) affect the sustainability of Golf Clubs. Three key trends that we observe as potential influencing factors are as follows:
Increasingly varied and diverse sport, recreation and entertainment options
available to people of all ages;
Economic and societal factors that mean people are more selective with the
use of their leisure time and so shorter duration, flexible sport, recreation and entertainment options become attractive (relative to golf’s characteristics of being member based and a typical game involving 18 holes);
Climatic changes that will lead to scarcity of water and so higher cost of
water use/purchase.
Golf specific challenges and trends include:
In many countries where the golf market is mature there is declining
membership;
In the emerging markets, for example China, Brazil and India there is growth in
membership;
Increasing sustainability challenges, the increasing scarcity of water placing
operational demands on golf courses;
Advancing golf technology leading to longer golf courses therefore
increasing the overall cost to deliver and play the game.
One of the relative strengths and points of difference for the sport of golf is that it is steeped in history and tradition. For some market segments this is part of the appeal and experience of playing the game. However this strength can also be an inhibitor to golf organisations propensity to adapt to changing economic, societal and market forces.
4.2 FUTURE GLOBAL TRENDS
The independent HSBC Report: Golf’s 2020 Vision (global), describes the following future trends that will influence the sustainability of golf facilities in the future.
Six and nine hole formats, and other short-forms, will complement the 18-hole