Procedia Engineering 144 ( 2016 ) 1426 – 1434
1877-7058 © 2016 The Authors. Published by Elsevier Ltd. This is an open access article under the CC BY-NC-ND license (http://creativecommons.org/licenses/by-nc-nd/4.0/).
Peer-review under responsibility of the organizing committee of ICOVP 2015 doi: 10.1016/j.proeng.2016.05.174
ScienceDirect
12th International Conference on Vibration Problems, ICOVP 2015
Identification of a Crack in Clamped-Clamped Beam using
Frequency-Based Method and Genetic Algorithm
Mitesh J Mungla
a,*, Dharmendra S Sharma
band Reena R Trivedi
aaInstitute of Technology, Nirma University, Sarkhej-Gandhinagar Highway, Ahmedabad, 382481, India bM S University, Faculty of Technology, Kalabhavan, Vadodara, 390001, India
Abstract
The natural frequencies of cracked and uncracked clamped-clamped beam are measured using single-input multi-output (SIMO) based experimental modal analysis (EMA). The crack present at various locations on the beam is generated using wire cut electro discharge machining process (WEDM). The crack is assumed to be transverse and one dimensional partial cut of a beam and is modeled as equivalent elastic rotational spring. Using Euler-Bernoulli beam theory, a closed form solution of the structural/mechanical member is presented. The measured frequencies of the beam with crack are utilized to identify crack location and its severity by the frequency-based approach as well as genetic algorithm (GA) based intelligent search for the same test points. GA is executed to find global minima of a fitness function that is a function of measured and theoretical frequencies of the cracked beam. The results of predicted crack location and its severity by both the approaches are compared and found to be good agreement with the actual crack parameters.
© 2016 The Authors. Published by Elsevier Ltd.
Peer-review under responsibility of the organizing committee of ICOVP 2015. Keywords:Genetic Algorithm (GA); Rotational Spring; Natural Frequency; Euler-Bernoulli beam theory
1. Introduction
Last few decades, many new non-destructive techniques (NDTs) have been developed for detection of crack location. Especially, development of vibration based NDTs has played important alternatives to a conventional one for many limitations of later.
* Corresponding author. Tel.: +91 990 440 5959.
E-mail address:[email protected]
© 2016 The Authors. Published by Elsevier Ltd. This is an open access article under the CC BY-NC-ND license (http://creativecommons.org/licenses/by-nc-nd/4.0/).
Based on that reference, many researchers attempted to develop a mechanism for detection of single/multiple cracks in last two and half decades. In the beginning, crack was simulated as translation spring [1, 2, 3] and established a base for the detection of crack for longitudinal vibration of the bar. Many researchers, later on, explored the field and modeled crack as rotational spring [4, 5, 6, 7, 8, 9, 10], etc. in beam-like structures, either to study the effect of crack parameters on eigenvalues [6], [11] or detection of crack parameters [4], [7, 8, 9, 10], etc. Later, the field was explored for different components with vivid combinations, a generalization of methodology and applicability to most of all mechanical and civil engineering components, not only for crack detection but also for health monitoring and fault diagnostic purposes. A wide range of literature related to crack modeling and crack detection strategies in various mechanical/structural components like bar, beam, turbine blades, shaft, etc. have been compiled in review papers [12].
Simultaneously, stochastic methods like artificial neural networks (ANN) [13, 14], genetic algorithms (GAs) [8, 15, 16], particle swarm optimization (PSO) [17], etc. have been also utilized to detect crack parameters.
In the present work, crack in the beam-like structure with clamped ends is modeled as rotational spring. Analytical solution of Euler-Bernoulli beam with single crack is presented and also discussed crack identification strategies based on frequency curves and genetic algorithm. Experimental results show close agreement with the prediction by both the methods.
2. Methodology
The governing equation of transverse vibration of the uniform, homogeneous and isotropic Euler-Bernoulli beam without crack can be written as [18],
4 2 2 4 2 ( , ) ( , ) Y x t Y x t c x t (1)
where, c EI ρA, and , E, Ar, L and I are density, Young’s modulus, cross-sectional area, length and
moment of inertia of the beam respectively. Assuming, ( , ) ( ) j t Y x t y x eω (2) We get, 4 4 4 ( ) ( ) 0 y y x α λ α (3) where x L α
is normalized location,xis a distance of beam measured from the left end,
1/ 4 2 4 , r A L EI ω ρ λ
whereωis natural frequency of the beam. The general solution of Eq. (3) is
( ) cos( ) sin( ) cosh( ) sinh( ),
yα A λα B λα C λα D λα (4)
A crack exists in the beam can be modeled with rotational spring (having stiffnessKr) as shown in Fig. 1. The
( ) r EI K hf a h (5)
where aandhare crack depth and beam thickness,
f a h
( / )
is local compliance function,which is computed from strain energy density function,2 3 4 5 6 7 8 9 10 ( / ) 9.9564( / ) 21.12( / ) 87.541( / ) 199( / ) 410.63( / ) -678.41( / ) + 919.512( / ) - 769.66( / ) + 355.83( / ) f a h a h a h a h a h a h a h a h a h a h (6)
If a uniform depth one-dimensional crack exists in the beam, simulated torsional spring separates an intact beam into two segments connected through it shown in Fig. 1.
Figure 1: Clamped-Clamped beam with single crack
The mode of left and right segments of beam can be defined as,
1( ) 1cos( ) 1sin( ) 1cosh( ) 1sinh( )
y α A αλ B αλ C αλ D αλ (7)
2( ) 2cos( ) 2sin( ) 2cosh( ) 2sinh( )
y α A αλ B αλ C αλ D αλ (8)
The boundary conditions of clamped-clamped beam as,
1 0 0 y α & y2α10 (9) 1 0 0 dy dx α & 2 1 0 dy dx α (10)
1 2 y α β y α β (11) 2 2 1 2 2 2 d y d y EI EI dx dx α β α β (12) 3 3 1 2 3 3 d y d y EI EI dx α β dx α β (13)
However, crack in the beam affects the slope pattern of the beam and hence, additional compatibility condition needs to be defined at crack location ( ) as:
2 1 1 2 2 r dy EI d y dy dx α β LK dx α β dx α β λ (14)
Applying boundary conditions (Eq. (9)-(10)) and compatibility conditions (Eq. (11)-(14)) to Eq. (7) and (8) yield eight simultaneous equations. Non-trivial solution yields,
( , , r) 0.
f β λ K (15)
3. Crack Detection Strategy
Two different strategies (frequency and GA based) are adopted to detect crack parameters (crack location and its intensity). Both the strategies contain input as first few natural frequencies. Details of the strategies are discussed below.
3.1. Frequency based methodology
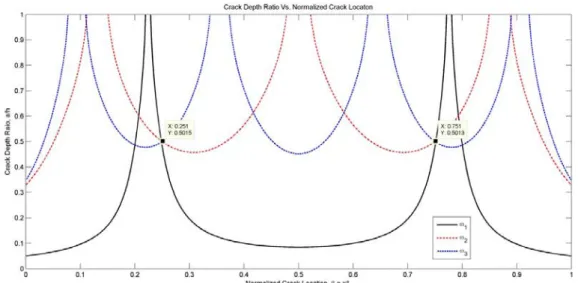
Using a measured natural frequency of the beam with a crack in Eq. (15), crack depth ratio corresponds to crack locations (0 to 1) can be obtained and presented graphically. However, only one curve has multiple possibilities of crack parameters. Hence, to arrive at a unique solution, another measured natural frequency of the same beam can be utilized to obtain the second curve. Using these two sets of data, some convergence in the detection of the crack location and crack depth can be achieved. It is found that still there are a finite number of combinations are possible. Therefore, the third measured natural frequency is also introduced. It is observed that use of three natural frequencies may lead to converging at a unique point (or two points due to symmetric end conditions), estimates the normalized crack location and crack depth ratio.
In the presented work, algorithm initiates with an initial random selection of chromosomes (initial population). Each chromosome constituted with a string of normalized crack location
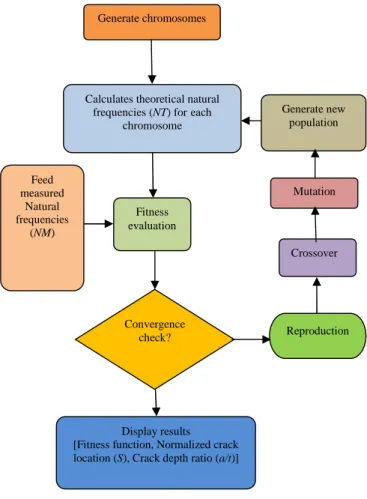
0β1and crack severity0a h/ 1. Using forward method, the theoretical natural frequencies are obtained from Eq. (15) for a chromosome. The flowchart of the algorithm is shown in Fig 2.Algorithm is prepared to minimize the fitness function that is defined as;
where NTi are first five theoretical natural frequencies and NMi are the first five natural
frequencies, measured through experiments .
After first convergence check, the initial population is then operated by three main operators; reproduction, crossover and mutation to create a next generation of chromosomes. The subsequent populations are evaluated and tested till desired convergence reached. A chromosome, obtained after desired convergence criteria are achieved, contains predicted crack parameters.
Figure 2. Flow chart of Algorithm
4. Results and Discussions
To validate the integrity of the methodology, few experiments have been carried out. The geometrical and material parameters for numerical study are adopted as: Length of beam (L) = 1.8 m; Width (b) = 0.05 m; Thickness (h) = 0.0065 m; Mass density of beam ( ) = 2700 kg/m3and Modulus of elasticity (E) = 70 GPa.
Total seven specimens (one uncracked and six having a crack at different locations and uniform crack depth ratio (0.5)) have been taken. Crack in the beam is generated using wire cut electro discharge machining (WEDM). The frequency response functions (FRFs) are generated using FFT analyzer (LMS make). First five measured frequencies for various specimens are given in Table 1.
5
1
i i i
Fitness function abs NT NM
(16) Convergence check? Fitness evaluation Generate chromosomes
Calculates theoretical natural frequencies (NT) for each
chromosome Feed measured Natural frequencies (NM) Reproduction Crossover Mutation Generate new population Display results [Fitness function, Normalized crack location (S), Crack depth ratio (a/t)]
Table 1. First five measured natural frequencies of test specimens with clamped-clamped end conditions
Test Point No.
Normalized Crack Measured Natural Frequency (Hz)
Location Depth First Second Third Fourth Fifth
1 Uncracked 10.45398 28.81702 56.49267 93.38499 139.5010 2 0.10 0.5 10.39814 28.78951 56.48958 93.23444 138.8921 3 0.20 0.5 10.45221 28.73122 56.05834 92.77299 139.2662 4 0.25 0.5 10.45221 28.63201 56.09110 93.27272 139.3009 5 0.30 0.5 10.43940 28.58119 56.32787 93.29583 138.3264 6 0.40 0.5 10.40079 28.69130 56.37867 92.54401 139.4695 7 0.50 0.5 10.38139 28.81702 55.96267 93.38499 138.2267
Using first three measured natural frequencies, frequency curves are obtained and superimposed in a graph (Fig 3, as per methodology discussed in section 3.1) for test point 4.
Figure 3. Prediction of crack parameters ( = 0.25 &a/h= 0.5) using frequency based method
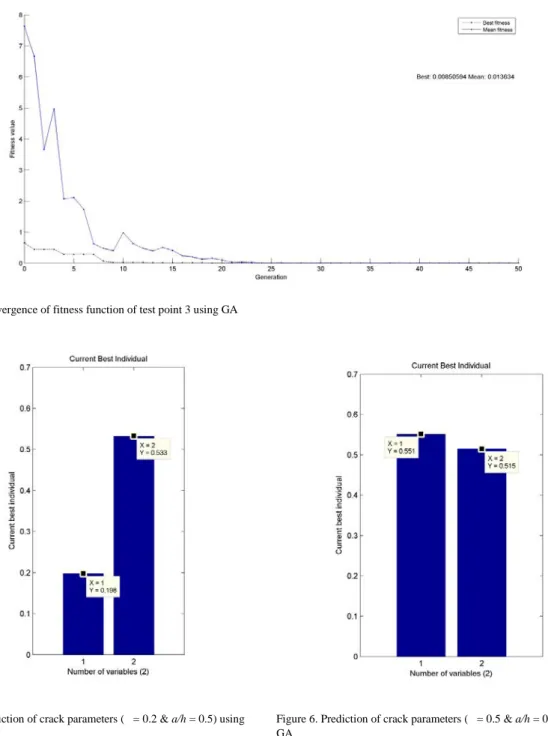
For the prediction of crack parameters using GA, Algorithm is prepared with MATLAB platform; many runs have been executed with combinations of three main operators (discussed in section 3.2). The convergence of fitness function of test point 2 is displayed in Fig. 4 generation-wise. Crack parameters after 50 generations are shown in Fig. 5 and Fig. 6 for test points 3 and 7 respectively.
Figure 4. Convergence of fitness function of test point 3 using GA
Figure 5. Prediction of crack parameters ( = 0.2 &a/h= 0.5) using GA
Figure 6. Prediction of crack parameters ( = 0.5 &a/h= 0.5) using GA
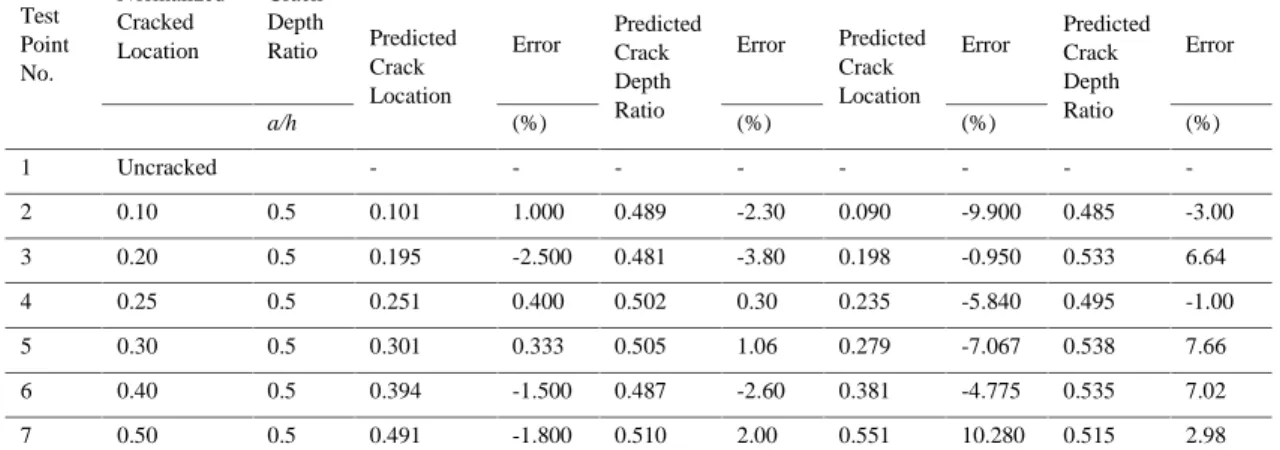
Estimation of crack parameters for all the test points using frequency based method and GA for clamped-clamped boundary conditions are compared with actual data and shown in Table 2.
Table 2. Comparison of actual and predicted crack parameters by both the methods (clamped-clamped end conditions) Test Point No. Normalized Cracked Location Crack Depth Ratio
Frequency Based Method Genetic Algorithm
Predicted Crack Location Error Predicted Crack Depth Ratio Error Predicted Crack Location Error Predicted Crack Depth Ratio Error a/h (%) (%) (%) (%) 1 Uncracked - - - -2 0.10 0.5 0.101 1.000 0.489 -2.30 0.090 -9.900 0.485 -3.00 3 0.20 0.5 0.195 -2.500 0.481 -3.80 0.198 -0.950 0.533 6.64 4 0.25 0.5 0.251 0.400 0.502 0.30 0.235 -5.840 0.495 -1.00 5 0.30 0.5 0.301 0.333 0.505 1.06 0.279 -7.067 0.538 7.66 6 0.40 0.5 0.394 -1.500 0.487 -2.60 0.381 -4.775 0.535 7.02 7 0.50 0.5 0.491 -1.800 0.510 2.00 0.551 10.280 0.515 2.98
Formulation of the clamped-clamped cracked beam is only applicable to isotropic and homogeneous materials with only open and single crack.
5. Conclusions
The theoretical formulation of clamped-clamped Euler-Bernoulli beam having single crack is presented. One dimensional and uniform depth crack can be modeled as rotational spring.
Errors in the prediction of crack location and crack depth ratio using natural frequency-based method are within 2.5 % and 3.8 % as well as by genetic algorithm 10.28 % and 7.66 % respectively. It has been observed that % error for the prediction of crack parameters using frequency based method is less compared to genetic algorithm method.
References
[1] Adams RD, Cawley P, Pye CJ, Stone BJ. A vibration technique for non-destructively assessing the integrity of structures. Journal of Mechanical Engineering Science. 1978; 20(2): p. 93-100.
[2] Adams RD, Walton D, Flipcroft JE, Short D. Vibration testing as a non-destructive test tool for composite materials. American Society for Testing and Material. 1975; 580: p. 159-175.
[3] Chondros TG, Dimarogonas AD, Yao J. Longitudinal vibration of a continuous cracked bar. Engineering Fracture Mechanics. 1998; 61: p. 593-606.
[4] Rizos PF, Aspragathos AD, Dimaragonas AD. Identification of crack location and magnitude in a cantilever beam from the vibration modes. Journal of Sound and Vibration. 1990; 138(3): p. 381-388.
[5] Liang RY, Choy FK, Hu J. Theoretical study of cracked-induced eigen-frequencies changes on beam structures. ASCE Journal of Engineering Mechanics. 1992; 118(2): p. 384-396.
[6] Khiem NT, Lien TV. A simplified method for natural frequency analysis of multiple cracked beam. Journal of Sound and Vibration. 2001; 245(4): p. 737-751.
[7] Mungla MJ, Sharma DS, Makwana HM, Bhavsar RR. Inverse dynamics of cracked cantilever beam. In International Conference in Advanced Design and Manufacturing; 2014; Tiruchirapalli, India: National Institute of Technology. p. 331-336.
[8] Mungla MJ, Sharma DS, Trivedi RR. Detection of crack using genetic algorithm. In International Conference in Advanced Design and Manufacturing; 2014; Tiruchirapalli, India: National Institute of Technology. p. 224-228.
[9] Barad KH, Sharma DS, Vyas VN. Crack detection in cantilever beam by frequency based method. In Procedia Engineering; 2013. p. 770-775.
[10] Sharma DS, Mungla MJ, Barad KH. Vibration based non-destructive technique to detect crack in multi-span beam. Nondestructive Testing and Evaluation. 2015;: p. In Print (DoI:- 10.1080/10589759.2015.1029475).
[11] Ostachowicz WM, Krawcauk M. Vibration analysis of a cracked beam. Computers and Structures. 1990; 36(2): p. 245-250.
[12] Dimaragonas AD. Vibration of cracked structures: A state of the art review. Engineering Fracture Mechanics. 1996; 55(5): p. 831-857. [13] Shahin M, Shenoi RA. Quantification and localisation of damage in beam-like structures by using artificial neural networks with
experimental validation. Engineering Structures. 2003; 25: p. 1785-1802.
[14] Shahin M, Shenoi RA. Vibration-based damage identification in beam-like composite laminates. Procedding of institute of mechanical engineers, Part-C, Journal of Mechanical Engineering Science. 2003; 217(6): p. 661-676.
[15] Vakil-Baghmisheh MT, Peimani M, Sadeghi MH, Ettefagh MM. Crack detection in beam-like structures using genetic algorithm. Applied Soft Computing. 2008; 8: p. 1150-1160.
[16] Xiang J, Zhong Y, Chen X, He Z. Crack detection in a shaft by combination of wavelet-based elements and genetic algorithm. Internation Journal of Solids and Structures. 2008; 45: p. 4782-4795.
[17] Vakil-Baghmishesh MT, Peimani M, Sadeghi MH, Ettefagh MM, Tabrizi AF. A hybrid particle Swarm-Nelder-Mead optimization for crack detection in cantilever beams. Applied Soft Computing. 2012; 12: p. 2217-2226.
[18] Rao SS. Vibration of Continuous Systems New Jersey: John Wily & Sons Publication; 2007.