2016
An investigative analysis of an advanced trim and
respond control strategy for variable air volume
HVAC systems
Nicholas Haberl
Iowa State University
Follow this and additional works at:https://lib.dr.iastate.edu/etd
Part of theMechanical Engineering Commons, and theOil, Gas, and Energy Commons
This Thesis is brought to you for free and open access by the Iowa State University Capstones, Theses and Dissertations at Iowa State University Digital Repository. It has been accepted for inclusion in Graduate Theses and Dissertations by an authorized administrator of Iowa State University Digital Repository. For more information, please [email protected].
Recommended Citation
Haberl, Nicholas, "An investigative analysis of an advanced trim and respond control strategy for variable air volume HVAC systems" (2016).Graduate Theses and Dissertations. 15710.
An investigative analysis of an advanced trim and respond control strategy for variable air volume HVAC systems
by
Nicholas Haberl
A thesis submitted to the graduate faculty
in partial fulfillment of the requirements for the degree of MASTER OF SCIENCE
Major: Mechanical Engineering Program of Study Committee: Song-Charng Kong, Co-major Professor
Gregory Maxwell, Co-major Professor Soumik Sarkar
Iowa State University Ames, Iowa
2016
DEDICATION
To my parents, Scott and Kirsten Haberl,
iii
TABLE OF CONTENTS
Page
DEDICATION ... ii
LIST OF FIGURES ... v
LIST OF TABLES ... viii
NOMENCLATURE ... x ACKNOWLEDGMENTS ... xii ABSTRACT ... xiii CHAPTER 1 INTRODUCTION ... 1 1.1 Background ... 1 1.2 Literature Review ... 2 1.3 Research Objectives ... 4
CHAPTER 2 EXPERIMENTAL SETUP ... 5
2.1 Experimental Procedure ... 5 2.2 Technology Description ... 6 2.3 Facility Descriptions ... 10 2.4 Custom TTR Programming ... 22 2.5 Data Collection ... 28 2.6 Data Analysis ... 36
CHAPTER 3 PRELIMINARY TESTING & OBSERVATIONS ... 38
3.1 Testing and Verification ... 38
3.2 Initial Demonstration ... 42
CHAPTER 4 RESULTS... 50
4.1 Fan Performance ... 50
4.2 Temperature Control Performance ... 80
4.3 Lessons Learned ... 81
CHAPTER 5 CONCLUSION ... 83
5.1 Summary ... 83
5.2 Future Work ... 85
REFERENCES ... 87
APPENDIX B TEMPERATURE CONTROL PERFORMANCE RESULTS ... 134 APPENDIX C OCCURRENCE LOGS ... 140 APPENDIX D POWER VERIFICATION RESULTS ... 156
v
LIST OF FIGURES
Page
Figure 2.1 Damper position vs airflow rate for a typical VAV box. ... 9
Figure 2.2 Most open damper position selection from DDC system #4. ... 23
Figure 2.3 Most open damper position selection from DDC system #4. ... 24
Figure 2.4 Static pressure setpoint calculation, TM tiers, from DDC system #5. ... 25
Figure 2.5 Static pressure setpoint calculation, RP tiers, from DDC system #4. ... 26
Figure 2.6 Limit check section, from DDC system #4. ... 27
Figure 2.7 DAS installation details, typical. ... 33
Figure 2.8 Installed CTs on RTU-1 at Muscatine Armed Forces Reserve Center. ... 34
Figure 2.9 HOBO data logger installed in RTU-1 at Waterloo Readiness Center. ... 35
Figure 3.1 Static pressure oscillation from initial TTR parameters, 5/25/2015. ... 45
Figure 3.2 Static pressure ramp up from initial TTR parameters, 6/2/2015. ... 45
Figure 3.3 Static pressure oscillation from initial TTR parameters, 7/8/2015. ... 46
Figure 3.4 Static pressure oscillation from initial TTR parameters, 6/5/2015. ... 46
Figure 3.5 Static pressure oscillation from initial TTR parameters, 6/5/2015. ... 47
Figure 4.1 TTR strategy static pressure control, 10/21/2015. ... 54
Figure 4.2 FSP strategy static pressure control, 12/1/2015. ... 54
Figure 4.3 TTR strategy static pressure control, 7/22/2015... 55
Figure 4.4 FSP strategy static pressure control, 12/3/2015. ... 55
Figure 4.5 TTR strategy static pressure control, 5/17/2016... 57
Figure 4.7 FSP strategy static pressure control, 1/19/2016. ... 58
Figure 4.8 TTR strategy static pressure control, 10/22/2015. ... 62
Figure 4.9 FSP strategy static pressure control, 11/10/2015. ... 62
Figure 4.10 TTR strategy static pressure control, 3/17/2016. ... 63
Figure 4.11 FSP strategy static pressure control, 11/11/2015. ... 63
Figure 4.12 TTR strategy static pressure control, 5/12/2016. ... 64
Figure 4.13 FSP strategy static pressure control, 9/11/2016. ... 64
Figure 4.14 TTR strategy static pressure control, 9/24/2015. ... 65
Figure 4.15 FSP strategy static pressure control, 9/15/2015. ... 65
Figure 4.16 TTR strategy static pressure control, 4/18/2016. ... 68
Figure 4.17 FSP strategy static pressure control, 4/4/2016. ... 68
Figure 4.18 TTR strategy static pressure control, 4/22/2016. ... 69
Figure 4.19 FSP strategy static pressure control, 4/5/2016. ... 69
Figure 4.20 TTR strategy static pressure control, 4/20/2016. ... 70
Figure 4.21 FSP strategy static pressure control, 4/6/2016. ... 70
Figure 4.22 TTR strategy static pressure control, 11/18/2015. ... 73
Figure 4.23 FSP strategy static pressure control, 11/28/2015. ... 73
Figure 4.24 TTR strategy static pressure control, 5/4/2016. ... 76
Figure 4.25 TTR strategy static pressure control, 5/5/2016. ... 76
Figure 4.26 TR strategy static pressure control, 4/27/2016. ... 77
Figure 4.27 TR strategy static pressure control, 4/28/2016. ... 77
vii
Figure 4.29 TTR strategy static pressure control, 12/23/2015. ... 78 Figure 4.30 TR strategy static pressure control, 12/10/2015. ... 79 Figure 4.31 TR strategy static pressure control, 12/9/2015. ... 79
LIST OF TABLES
Page
Table 2.1 Illustration of the TTR strategy. ... 8
Table 2.2 Boone Readiness Center AHU details. ... 13
Table 2.3 Des Moines Military Entrance Processing Station AHU details. ... 14
Table 2.4 Joint Forces Headquarters AHU details... 17
Table 2.5 Muscatine Armed Forces Reserve Center RTU details. ... 18
Table 2.6 Waterloo Readiness Center RTU details. ... 20
Table 2.7 Site investigation results, facility details. ... 21
Table 2.8 Site investigation results, HVAC equipment details. ... 21
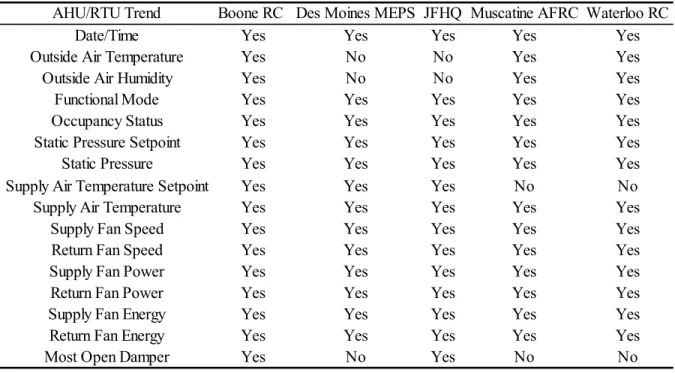
Table 2.9 AHU/RTU trends available at each site. ... 28
Table 2.10 VAV box trends available at each site. ... 29
Table 2.11 Installed data logging equipment. ... 31
Table 2.12 Installed data logging equipment (continued). ... 32
Table 3.1 Power verification results from JFHQ AHU-2 supply fan. ... 41
Table 3.2 Initial functional mode comparison and TTR parameters. ... 42
Table 3.4 Refined TTR strategy used during the official demonstration. ... 48
Table 3.6 Temperature control strategy and static pressure setpoints used during official demonstration. ... 49
Table 4.1 Average fan energy savings per unit per day. ... 50
Table 4.2 Average fan energy savings of TTR over FSP per unit per day by VAV zones. ... 51
Table 4.3 Average Boone RC fan energy savings per unit per day, FSP vs TTR. ... 53
Table 4.4 Average Des Moines MEPS fan energy savings per unit per day. ... 56
ix
Table 4.6 Average Muscatine AFRC fan energy savings per unit per day. ... 67
Table 4.7 Average Waterloo RC fan energy savings per unit per day. ... 72
Table 4.8 Average Waterloo RC fan energy savings without exhaust fan operation. ... 74
Table 4.9 Average JFHQ fan energy savings per day per unit. ... 75
NOMENCLATURE
“ WC Inches water column
AFRC Armed Forces Readiness Center
Ahr Amp hour
AHU Air handling unit
BACnet Building Automation and Control network
CBECS Commercial Buildings Energy Consumption Survey
CPL Custom programming language
cfm Cubic feet per minute
CT Current transformer
DAS Data acquisition system
DDC Direct digital control
DX Direct expansion
EER Energy efficiency ratio
ERV Energy recovery ventilation
ESTCP Environmental Security Technology Certification Program
FSP Fixed static pressure
HRV Heat recovery ventilator
HVAC Heating ventilation and air conditioning
IAARNG Iowa Army National Guard
IEC Iowa Energy Center
xi
kW Kilowatt
kWh Kilowatt-hour
LEED Leadership in Energy & Environmental Design
MAU Make-up air unit
MBH Mega British thermal unit per hour
MDP Most open damper position
MEPS Military Entrance Processing Station
RC Readiness Center
RP Respond rate
RTU Rooftop unit
SPmax Static pressure maximum
SPmin Static pressure minimum
SPset Static pressure setpoint
TAB Terminal air box
TM Trim rate
TTR Tiered trim and respond
TR Trim and respond
VAC Volts of alternating current
VAV Variable air volume
ACKNOWLEDGMENTS
I would like to thank my major professors, Dr. Song-Charng Kong and Dr. Gregory Maxwell, and my committee member, Dr. Soumik Sarkar, for their guidance and support throughout the course of this research.
I would also like to thank Iowa Energy Center staff, Dr. Xiaohui Zhou and Troy Barker, Iowa Army National Guard staff, Kimberly Dickey, Jeff Hedens, Dave Umland, David Shea, Scott Repp and Eric Challen, and Taylor Engineering Inc. staff, Hwkong Cheng and Jeff Stein for their guidance, discussions and cooperation without whom, this thesis would not have been possible.
xiii
ABSTRACT
Energy efficiency, particularly HVAC energy use in buildings, offers a large potential of reducing overall energy consumption. By optimizing fan controls in variable air volume (VAV) HVAC systems, up to 30 to 50% of fan energy can be saved using trim and respond (TR) strategies compared to constant pressure strategies. The tiered trim and respond (TTR) strategy has shown promise in realizing significant fan energy savings in real buildings without issues of static pressure oscillation.
This study proposed the demonstration of the TTR strategy at five Iowa Army National Guard facilities comparing against fixed static pressure (FSP) and traditional TR strategies over a ten-month period. The DDC and HVAC systems at each site were equipped with the necessary hardware and software needed to properly test and record all data needed. Functional mode and power verification testing were conducted to confirm the correct implementation of the TTR method and fan power readings from the DDC system and installed data logging systems.
After a ten-month period, the fan energy savings results for the TTR and FSP comparison were as follows: Boone RC AHU-1 20.86% and AHU-2 10.69%, Des Moines MEPS AHU-1 27.30%, JFHQ AHU-1 4.73%, AHU-4 12.83%, AHU-9 59.92% and AHU-12 15.83%, Muscatine AFRC RTU-1 18.91%, RTU-3 29.46%, RTU-4 36.54% and Waterloo RC RTU-1 33.80%. The fan energy savings results of the TTR and TR comparisons are as follows: JFHQ AHU-2 -25.90% and AHU-3 -47.27%. The temperature control comparisons results on the TTR and TR comparison air handling units (AHUs) are as follows: JFHQ AHU-2 4.35% and AHU-3 7.76%.
While the original proposal of 30 to 50% of fan energy savings is possible, a value closer to 20 to 30% fan energy savings is more realistic. Numerous instances of mechanical failure, setpoint alterations, scheduling errors and other issues that while hindered the capabilities of the TTR strategy, reflected the true nature of a real building. The study showed that the TTR strategy is most successful with less number of VAV zones and proper control of AHU supply air temperature. One recommendation is to recommission heating or cooling airflow setpoints so the VAV zone damper is not left wide open when under the control of the TTR strategy.
Static pressure control was as expected on 3 of the 5 sites studied. The TTR strategy was able to respond to building loads while minimizing or eliminating issues with static pressure oscillation. However, the TTR strategy displayed numerous instances of frequent static pressure oscillation, especially at sites that had difficulty in controlling zone
temperatures from inactive boiler or chiller service. The results from the TTR and TR comparison showed that temperature control with a radiant in-floor heating system was difficult for both static pressure reset strategies studied.
In future studies, boiler and chiller data including: operation, temperature, setpoints, etc. should be trended. A comparison of the TTR strategy with fixed supply air temperature and an outside air based supply air temperature reset strategy would be insightful. Parameters such as the TM and RP rates, Step Timer and damper position thresholds could be refined to maintain a quick response to changing building loads. Lastly, as industries and professional standards progress with improved building standards, the focus of future studies should shift from comparing against fixed static pressure strategies to existing static pressure reset strategies in not only fan energy savings, but whole building energy savings as well.
1
CHAPTER 1 INTRODUCTION
1.1 Background
With rising awareness of the United States’ growing demand for energy and the resulting carbon emissions, strong steps have been taken to improve areas in energy
efficiency, grid distribution and power generation. One area in particular, energy efficiency, has shown to be one of the most cost effective ways of reducing our carbon footprint by directly reducing energy consumption. However, much more work is needed within the broad field of energy efficiency.
In 2012, the commercial sector comprised of 18% of the total energy consumed by the US (EIA, 2016). This includes primary and electrical energy, providing a great potential for reducing overall energy consumption. Within the commercial sector, energy consumption tied to HVAC systems resulted in 44% of the total use in commercial buildings in 2012. Ventilation alone accounted for 16% of electricity use and 10% of total energy use in commercial buildings (EIA, 2016).
Energy efficiency tied to HVAC systems provides a large potential to reduce overall energy use and must be effective in not only buildings of varying function and size, but in age as well. From the 2012 Commercial Building Energy Consumption Survey (CBECS), over half of the US commercial building stock was constructed before 1980 (EIA, 2016).
In a typical commercial building’s HVAC system with a variable air volume (VAV) system, each room or zone’s airflow is controlled by a VAV terminal air unit or box. As a VAV zones temperature deviates from its temperature setpoints, the VAV box “requests” for
either cooling or heating airflow. Providing this airflow is a supply fan within the HVAC system’s air handling unit (AHU) that is controlled by a variable frequency drive (VFD). The VFD controls the speed of the supply fan and therefore the static pressure rise needed to alleviate building load demand. The direct digital control (DDC) system controls the VFD via speed command signal. In many commercial facilities the command signal to the VFD is controlled to maintain a constant static pressure, or a fixed static pressure (FSP). This
setpoint is usually meant to satisfy the most critical building loads during cold, winter or warm, summer days.
However, this setpoint is not needed during most days, creating excessive static pressure rise in the supply fan and wasting energy. One way to improve energy efficiency, particularly within HVAC systems, is to optimize the fan control in VAV air handling and rooftop units. This can be achieved by minimizing the static pressure rise in supply fans needed to meet building load demands.
1.2 Literature Review
According to both the ASHRAE Standard 90.1 2004 and California Building Title 24 Section 140.4-(c), commercial buildings with VAV systems that have direct digital controls (DDC) at the zone level must implement strategies to reset static pressure to meet the demand of the most open damper; “i.e. the [static pressure] setpoint is reset lower until one
zone damper is nearly wide open.” (ASHRAE 2004, CEC 2013).
Academic and professional studies have shown that resetting the static pressure in VAV systems can significantly reduce fan energy use from 30 to 50% compared to existing constant pressure strategies (Taylor, 2007). Control strategies resetting static pressure from
3
zonal based demand also outperformed other reset control strategies based on system wide and outside air temperature based demand in energy savings (Kimla, 2009). Not only does resetting the static pressure reduce fan energy use, but other benefits are observed as well. Liu (2010) demonstrated that noticeable savings in thermal energy and reduction in duct leakage occur in air handlers using static pressure reset strategies. As such, reducing static pressure in HVAC systems based on zonal demand has taken a foothold in many professional industries.
One zonal demand based reset strategy, the tiered trim and respond (TTR) strategy, has shown promise in saving fan energy while minimizing static pressure oscillation that typically plague traditional trim and respond (TR) static pressure reset strategies. The TTR strategy showed significant energy savings over other tested PID and TR strategies, while minimizing static pressure oscillation in a laboratory setting (Nelson & Housholder, 2011). When demonstrated in a real building on the campus of Iowa State University, the TTR strategy showed fan energy savings of 37% and improved thermal comfort over an existing FSP strategy. Additionally, the TTR strategy did not display any issues concerning “hunting” or excessive damper oscillation.
The research from Nelson and Housholder (2011) introduced the TTR strategy in a building that was recently constructed and proposed that 30 to 50% fan energy savings could be realized with the TTR strategy over existing fixed static pressure control methods.
However, as stated earlier, many commercial facilities installed today are at least 35 years of age or older. The facility originally tested was of relatively newer construction, contained 51 VAV boxes, and a DDC system capable of collecting data every five seconds. The functions of the facility mainly pertained to offices, conference rooms and computer labs. To improve
upon this new strategy, a study is needed to compare the fan energy savings performance involving a wide breadth of commercial building functions, age, DDC system manufacturers, VAV system complexities and AHU sizes.
1.3 Research Objectives
This study proposes the demonstration of the TTR strategy at multiple facilities under the Iowa Army National Guard over a ten month period. In doing so, these facilities will be sampled to reflect a wide variety of typical functions, DDC systems, age, floor space and HVAC equipment installed in commercial buildings across the nation. The objective of this study is to determine the viability of the TTR strategy, and achieve a more thorough
understanding of its performance. Key quantitative metrics include fan energy savings and temperature control performance based on comparisons from existing FSP and TR strategies. It is predicted that fan energy savings of at least 30% are achievable over conventional FSP strategies implemented in many commercial facilities. Qualitative results will be observed in determining the overall performance of the static pressure control from the TTR strategy as well. Lastly, a summary of discovered issues throughout the study will be logged to better understand the system wide effects of the TTR strategy.
5
CHAPTER 2 EXPERIMENTAL SETUP
2.1 Experimental Procedure
In this study, fan energy consumption and zone temperature control of the TTR strategy was compared to existing FSP and TR strategies that are common throughout many commercial and Iowa Army National Guard facilities. By alternating between two static pressure control strategies every two weeks while recording fan energy use, zone
temperature, VAV box damper positions and other relevant HVAC data, a comparative study mitigating the effects of abnormal weather, occupant usage, and other factors can be
achieved. To obtain an accurate depiction of the potential fan energy savings of the TTR strategy, a selection criterion was used in determining which Iowa Army National Guard facilities were adequate for the study.
Once a number of facilities were chosen, a site investigation was conducted to determine the viability and any additional equipment and software that would be needed at each site. HVAC and DDC system equipment and software were inspected to affirm the capabilities needed to complete the study. The facilities’ technical documents regarding construction drawings, mechanical specifications, and HVAC equipment layouts were also reviewed. After the appropriate investigations were completed and technical documents reviewed, it was decided to either install any necessary equipment or software to properly conduct the study or select another Iowa Army National Guard facility.
After the installation of any necessary equipment and software, local HVAC contractors and technicians were hired to implement their own custom TTR program to fit
the specific DDC system installed at each site. While each custom TTR program is unique in language and DDC system, the TTR strategy itself was the same across all sites. To ensure this, a standardized functional mode test was conducted at each site, confirming the correct implementation of the TTR strategy. At the same time, fan power readings from the DDC system, VFD display, and installed data logging equipment were verified with a reference power meter to ensure the accuracy of their readings.
Once the functional mode tests and power reading verifications were completed, an initial demonstration period began. During this period, functional modes alternated daily. Data collection and analysis was more frequent with the intent to discover and resolve any issues relating to hardware or HVAC equipment as soon as possible. If it was discovered the TTR program was not operating as originally intended, changes were made to alleviate issues. After enough time had passed without issues related to the functional modes, the official demonstration period began.
The official demonstration period would begin with the TTR and FSP or TR
strategies alternating every two weeks. As data was continuously trended and logged by the DDC systems at each site, local facility engineers would download data weekly. Data analysis was used to compile results and confirm the correct operation of the functional modes and associated HVAC equipment. Again, any issues discovered during data analysis were dealt with accordingly.
2.2 Technology Description
The TTR strategy is an advanced static pressure reset strategy developed by Nelson and Housholder in 2011. The strategy had a profound effect on fan energy savings in a
7
facility not dissimilar to a wide number of existing commercial buildings. The strategy works by resetting the static pressure setpoint to a minimal value based on the most open damper position of all the VAV boxes attached to a particular AHU or RTU. By using damper position information, either feedback or command signal, of all attached VAV boxes the TTR strategy is able to maintain appropriate thermal comfort at the zone level using controls information available in most conventional HVAC DDC systems. The strategy was built upon many other previously developed trim and respond strategies; however few strategies have achieved similar energy savings with minimal static pressure oscillation using this type of controls information at the zone level (Nelson & Housholder, 2011).
The TTR strategy is comprised of three functional blocks: the Most Open Damper
Position Selection, Static Pressure Setpoint Calculation and Limit Check Section. First, in
the Most Open Damper Position Selection, the most open damper position value is selected
from all VAV boxes attached to a particular AHU or RTU. This value is labeled as the most open damper position (MDP).
Next, in the Static Pressure Setpoint Calculation, the MDP is compared to a set of specified ranges of [Low1, Low2, Low3] and [High1, High2, High3]. The deadband [Low1, High1] is a range where the static pressure setpoint (SPset) will remain unchanged if the MDP is between these two values. If the MDP deviates above the specified deadband [High1, High2, High3], the SPset is raised by a summation of the respond rates [RP1, RP1+RP2, RP1+RP2+RP3], respectively. Similarly, if the MDP deviates below the deadband [Low1, Low2, Low3] the SPset is reduced by a summation of trim rates [TM1, TM1+TM2,
TM1+TM2+TM3], respectively. Table 2.1 provides a summary of conditions and responses of the TTR strategy.
Table 2.1 Illustration of the TTR strategy.
Condition Response
If MDP > High3 SPSet = SPSet + RP1 + RP2 + RP3
If MDP > High2 SPSet = SPSet + RP1 + RP2
If MDP > High1 SPSet = SPSet + RP1
If High1> MDP > Low1 No change
If MDP < Low1 SPSet = SPSet - TM1
If MDP < Low2 SPSet = SPSet - TM1 - TM2
If MDP < Low3 SPSet = SPSet - TM1 - TM2 - TM3
High3>High2>High1>Low1>Low2>Low3
(values of 95%, 92%, 90%, 85%, 83%, 80%, respectively)
MDP Maximum Damper Position (Feedback or Command Signal)
SPSet Static Pressure Setpoint
TM1,2,3, RP1,2,3 Trim and response rates. All positive numbers.
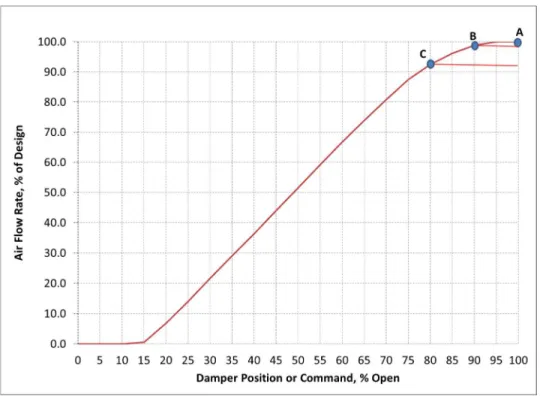
In Table 2.1, suggested values for the deadband [Low1, High1] are provided. These values have been altered from the suggested values of 90% and 98% from the ASHRAE Application Handbook for the traditional TR strategy to 85% and 90% (Nelson & Housholder, 2011). Figure 2.1 displays the expected airflow percentage compared to the damper position of a typical VAV box.
9
The TTR strategy attempts to minimize issues concerning instability by shifting the deadband [Low1, High1] down the damper position axis while maintaining the relatively flat slope of the damper position vs airflow curve.
The appropriate TM and RP rates are calculated using a formula developed by Nelson and Housholder (2011), provided in Equation 2.1. The remaining TM and RP rates are
provided in Equation 2.2 and 2.3.
TM1, RP1 = SPmax-SPmin × Step Timer
900 (2.1)
TM2=2 TM1 and RP2=2 RP1 (2.2)
TM3=3 TM1 and RP3=3 RP1 (2.3)
Equation 2.1 provides the suggested TM1 and RP1 rate using the maximum and minimum allowable static pressure setpoints (SPmax and SPmin, respectively) and the Step Timer of
the TTR strategy. The denominator value comes from the rule of thumb that the supply fan should be able to traverse the entire static pressure range within 15 minutes at the lowest TM or RP rate (Nelson & Housholder, 2011).
Lastly, in the Limit Check Section, the strategy calculates a new SPset using the conditions and response provided in Table 2.1. The SPset is then compared to the SPmax and SPmin specified in the DDC system. If the new SPset is below the SPmin, the resulting setpoint is reverted to the SPmin. For example, if the new SPset value equals 0.36” WC and the SPmin value is 0.40” WC, the new SPset value will revert to the SPmin value of 0.40” WC. Likewise, if the SPset is above the maximum allowed static pressure setpoint, SPset is reverted to the SPmax.
All of the functional blocks described occur at a predefined interval, known as the Step Timer. This interval, typically every 1 to 5 minutes, is dependent on the capabilities of the DDC system, as many calculations have to be completed at the defined rate, and the HVAC equipment, as the supply fan and VFD must react quickly enough to achieve the new SPset value before the next Step Timer interval.
2.3 Facility Descriptions
Several demonstration sites were assessed to determine their viability to study the performance of the TTR strategy. The sites used for this study were selected based on the following criteria:
• Geographic location
• Facility function, floor space, and representativeness
11
• Commercial DDC system manufacturer
Given Iowa’s climate, many commercial facilities nationwide endure similar weather. Data collected on the performance of the TTR strategy during cold winter and warm summer days are vital to the success of this study. Because the TTR strategy controls the static pressure from the zone level, the HVAC and DDC system at the facility must have the necessary control points and hardware available. This includes a forced-air mechanical system with the ability to control the static pressure setpoint command via supply fan speed by VFD and damper position feedback or command signal across all applicable VAV zones. The selected facilities must also be representative of typical commercial installations by its physical characteristics and daily functions. Lastly, a variety of commercial DDC system platforms provide a wider range of data as vendor offerings vary across the nation.
Once the demonstration sites were selected from the listed criteria, a site investigation was conducted. The objective of the investigation was to closely inspect HVAC equipment and hardware, DDC system software and their capabilities. Key items include:
• Building use and typical occupant functions
• Installed AHU/RTU specifications, setpoints, size, rating, etc.
• Supply and return fan VFD specifications, physical location
• AHU/RTU electrical panel layouts and physical locations
• DDC system capabilities, available data points, trends, history logs, memory, etc.
• Emergency power strategies, installed backup systems
• Cellular reception for potential data logging systems
Site #1: Boone Readiness Center
Originally constructed in 1963, the Boone Readiness Center (RC) is a 77,321 sq. ft., single floor facility that serves various functions and zones: maintenance areas, kitchens, storage areas, drill halls, latrines, class rooms and administrative offices. Major remodel projects occurred in 1986 and 2005, involving VAV zone alterations, new ductwork, HVAC equipment and DDC system. This building serves as a representative sample of hundreds of National Guard buildings nationwide that are of similar construction and function. The building lies in a north – south orientation, with the north and south portions of the building containing classrooms and offices, and the center portion containing a large drill hall.
The building is served by three AHUs, two of which are VAV systems, AHU-1 and AHU-2. AHU-1 serves the northern zones of the facility, while AHU-2 serves the southern zones. The drill hall located in the center of the building is served by AHU-3, a constant air volume system, and was constructed with radiant in-floor heating. A total of 67 single-duct reheat VAV boxes are served from AHU-1 and AHU-2, 29 and 38 boxes respectively. For the purposes of this study, only AHU-1 and AHU-2 are studied as both are VAV systems.
AHU-1 is a factory built, mixed air unit with a 15 MHP supply fan and 10 MHP return fan. The unit is rated for 12,000 cfm at a max external static pressure of 2.20” WC with heating and cooling coils serving 29 pressure independent VAV boxes, each with heating coils for reheat service. The zones attached to this unit consist of classrooms, several offices, latrines, a fitness room and a kitchen.
AHU-2 is a factory built, mixed air unit with a 15 MHP supply fan and 10 MHP return fan. This unit is rated for 12,000 cfm at a max external static pressure of 1.70” WC with heating and cooling coils serving 38 pressure independent VAV boxes all with heating
13
coils for reheat service. The zones attached to this unit are several offices, classrooms, storage rooms, vault spaces, mechanical zones, a boiler room and conference rooms.
In addition to these AHUs, the Boone RC facility has numerous exhaust fans, hoods, outside dampers, and a single make-up air unit (MAU). These primarily serve areas to alleviate indoor air quality concerns of latrines, kitchen areas, and mechanical rooms. For the purposes of this study, this equipment was not trended within the DDC system, or provided input to the TTR programs installed at this facility. Table 2.2 provides a summary of the specifications of the two AHUs studied.
Table 2.2 Boone Readiness Center AHU details.
Along with the AHUs, the facility also contains a shared boiler, chiller and an economizer. Both the boiler and chiller were not trended for this study. However, data from the supply air temperature were used to confirm normal operation of the boiler and chillers.
The DDC system for this facility was installed in 2005 and incorporated a fixed supply air temperature setpoint and FSP strategy for both AHUs. Occupancy schedules were often altered due to the nature of the building’s functions. During the site investigation, it was determined that a 3rd party export utility and additional computer hardware were needed to trend the data points needed for this research. Many VAV boxes and their associated equipment were found to be in need of repair or replacement such as space temperature sensors, damper actuators and fire safety dampers.
ID Tag VAVs Fans CFM MHP Ext. SP Fans CFM MHP Ext. SP
AHU-1 28 1 12,000 15 2.20" 1 12,000 10 1.75"
AHU-2 38 1 12,000 15 1.70" 1 12,000 10 1.75"
Supply Fan Return Fan
Boone RC
Unit Site
Site # 2: Des Moines Military Entrance Processing Station
The Des Moines Military Entrance Processing Station (MEPS), constructed in 2008, is a 28,200 sq. ft., single floor facility. The building lies in a north – south orientation, with main entrances facing the east. The Des Moines MEPS is served by one AHU, AHU-1, located in the mechanical room, serving 34 pressure independent VAV boxes. The type of zones served our administrative offices, medical testing labs, classrooms, storage rooms and a kitchen.
AHU-1 is a factory built, mixed air unit with a 20 MHP supply fan and a 10 MHP return fan. The unit is rated to supply 22,000 cfm of air at a max external static pressure of 2.00” WC. Serving 34 pressure independent VAV boxes, each with reheat coils, the unit also contains cooling and heating coils with a humidifier and heat recovery ventilator unit (HRV). The HRV has a 5 MHP fan with a max supply of 3,000 cfm and a sensible effectiveness of 71%. 2 boilers serve AHU-1 and VAV heating coils, while a single 72 ton chiller serves the cooling coils of AHU-1. Both the boiler and chiller are controlled from a separate DDC system and were not trended for this study. However, data from the supply air temperature were used to confirm normal operation of the boiler and chillers. Table 2.3 provides the specifications for the AHU at the Des Moines MEPS.
Table 2.3 Des Moines Military Entrance Processing Station AHU details.
Along with AHU-1, the facility contains 3 exhaust fans serving mechanical rooms. For the purposes of this study, this equipment was not trended within the DDC system, nor provided input to the TTR programs installed at this facility.
ID Tag VAVs Fans CFM MHP Ext. SP Fans CFM MHP Ext. SP
Des Moines MEPS AHU-1 34 1 22,000 20 2.00" 1 22,000 10 0.90"
Supply Fan Return Fan
Unit Site
15
The DDC system at this site incorporated a fixed supply air temperature strategy and form of static pressure reset strategy. Occupant zone temperature control had since been removed. Additional software was needed to properly export the data for this study.
Site #3: Joint Forces Headquarters
The Joint Forces Headquarters (JFHQ) is the largest of the 5 facilities at 237,126 sq. ft. The multi-use, four-floor facility constructed in 1994 contains IAARNG Executive
Leadership Offices, high-level offices, service bays, classrooms, training areas, drill halls and Iowa Homeland Security & Emergency Management. This emergency response and
readiness support facility is similar to those in every other U.S. state. This particular facility utilizes radiant in-floor heating for a majority of the zones and a mix of VAV boxes that are cooling only, or have electric reheat.
JFHQ contains a total of 12 AHUs, 6 of which meet the criteria for this study. The ID tags for these units are as follows: AHU-1, AHU-2, AHU-3, AHU-4, AHU-9 and AHU-12. AHUs 1, 2, 3, 4 and 9 are factory built units with supply fans of 20 MHP or less. Each of these units is located on the upper most floors in separate penthouses. The following paragraphs provide a summary of these units.
AHUs 1, 2, 3, and 4 are each factory built, mixed air units with a 20 MHP supply fan. These units each contain a heating and cooling coil and are rated to supply 16,000 cfm of air at a max external static pressure of 3.00” WC. Each unit is in their own penthouse above the 2nd floor of the facility. AHU-1 serves 40 pressure independent VAV boxes with cooling only service and 2 pressure independent VAV boxes with electric reheat. AHU-2 serves 49 pressure independent VAV boxes with cooling service only and a single pressure
independent VAV box with electric reheat. AHU-3 serves 37 pressure independent VAV boxes with cooling service only and a single pressure independent VAV box with electric reheat. AHU-4 serves 37 pressure independent VAV boxes with cooling service only and 4 pressure independent VAV boxes with electric reheat.
AHU-9 is a factory built, mixed air unit with a 7.5 MHP supply fan. The unit contains heating and cooling coils and can supply 5,800 cfm of air at a max external static pressure of 2.25” WC. AHU-9 serves 5 pressure independent VAV boxes with cooling service only.
AHU-12 is a custom built-up, mixed air unit with four 30 MHP supply and four 7.5 MHP return fans located in the basement of the facility. The supply fans are paired to 2 VFDs that operate in parallel, i.e. supply fans ES-1 and ES-2 are controlled by one VFD and supply fans ES-3 and ES-4 are controlled by another. This configuration also follows for the four return fans. The unit contains heating and cooling coils and is rated to deliver a total of 87,000 cfm of air at a max external static pressure of 6.00” WC. The unit also serves 29 pressure independent VAV boxes with cooling service only and 18 pressure independent VAV boxes with electric reheat coils. Table 2.4 provides the specifications of the penthouse AHUs and AHU-12.
17
Table 2.4 Joint Forces Headquarters AHU details.
All AHU and VAV box heating coils and the radiant in-floor heating are served from a single gas fired boiler, rated to deliver 2343 MBH. The penthouse AHUs cooling coils are served by 2 125 ton chillers with evaporative cooling. AHU-12 cooling coils are served by a 300 ton chiller with an attached cooling tower. While this equipment was not directly trended, data from the AHUs supply air temperature were used to confirm normal operation of the boiler and chillers.
In 2014, the JFHQ received major upgrades to the DDC system, installing a web-based multi-protocol Building Automation and Energy Management Platform. The AHUs supply air temperature are typically controlled using reset strategies based on outside air temperature, while the AHUs static pressure are controlled with request-based TR strategies.
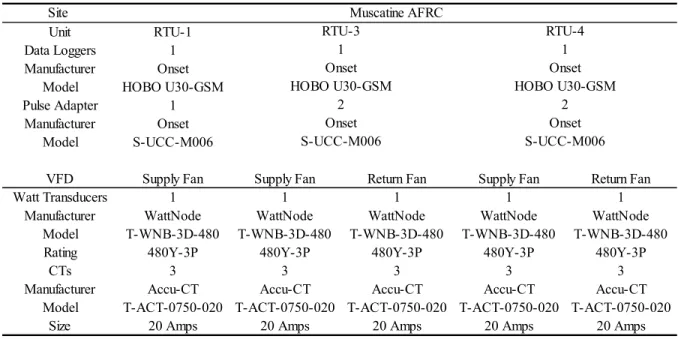
Site #4: Muscatine Armed Forces Reserve Center
The Muscatine Armed Forces Reserve Center (AFRC) is a 37,392 sq. ft., single floor LEED Silver certified facility. Constructed in 2011, the facility contains kitchens,
classrooms, fitness training areas, vehicle service bays, and administrative offices. Hundreds of similar facilities are located across the country, serving several agencies. The facility contains a total of 5 RTUs; 3 of which meet the criteria of this study. The first RTU, RTU-1
ID Tag VAVs Fans CFM MHP Ext. SP Fans CFM MHP Ext. SP
AHU-1 42 1 16,000 20 3.00" - - - -AHU-2 50 1 16,000 20 3.00" - - - -AHU-3 38 1 16,000 20 3.00" - - - -AHU-4 41 1 16,000 20 3.00" - - - -AHU-9 5 1 5,800 7.5 2.25" - - - -AHU-12 47 4 21,750 30 6.00" 4 19,500 7.5 0.50"
Supply Fan Return Fan
JFHQ
Unit Site
serves the kitchen area while RTU-3 and RTU-4 serve the east and west portions of the facility.
RTU-1 is a packaged rooftop, mixed air unit with a 3 MHP supply fan. The unit contains direct expansion (DX) cooling with an EER of 11.1 and a refrigeration capacity of 15 nominal tons and hot water heating coils. The unit is rated to supply 2,235 cfm of air at a max external static pressure of 2.10” WC. RTU-1 serves 3 hot water reheat only pressure independent VAV boxes in the kitchen area of the facility. The kitchen area is also served by several exhaust fans and MAUs that are not trended for this study.
RTU-3 is a packaged rooftop unit with a 10 MHP supply fan and 2 MHP exhaust fan. The mixed air unit contains a DX cooling coil with an EER of 10.7and a refrigeration
capacity of 30 nominal tons, hot water heating coil and an ERV wheel. The unit is rated to supply 10,250 cfm of air at a max external static pressure on 2.20” WC. RTU-3 serves 17 hot water reheat only, pressure independent VAV boxes.
RTU-4 is a packaged rooftop unit with a 10 MHP supply fan and 2 MHP exhaust fan. The mixed air unit contains a DX cooling coil with an EER of 10.7 and a capacity of 30 nominal tons, hot water heating coil and an ERV wheel. The unit is rated to supply 9,610 cfm of air at a max external static pressure on 2.20” WC. RTU-4 serves 16 hot water reheat only, pressure independent VAV boxes. Table 2.5 provides the specifications of the 3 RTUs studied.
Table 2.5 Muscatine Armed Forces Reserve Center RTU details.
ID Tag VAVs Fans CFM MHP Ext. SP Fans CFM MHP Ext. SP
RTU-1 3 1 2,235 2 2.10" - - -
-RTU-3 17 1 10,250 15 2.20" 1 2,335 2 1.20"
RTU-4 16 1 9,610 10 2.20" 1 1,830 2 1.20"
Muscatine AFRC
Supply Fan Return Fan
Unit Site
19
2 boilers rated to deliver 940 MBH each serve the building heating water supply, including the hot water coils for RTU-1, RTU-3 and RTU-4. A fan coil unit also serves the mail room, however it was not trended for this study.
The Muscatine AFRC facility utilizes a building automation system with a BACnet interface. Typically this facility uses a form of static pressure reset strategy along with a supply air temperature reset strategy. It was discovered that due limitations of the network controllers and cost constraints of the study, data collection of the VAV box trends were limited to 30 minute intervals.
Site #5: Waterloo Readiness Center
The Waterloo Readiness Center (RC) is part of a two floor, 34,185 sq. ft. Army Aviation Support Facility originally constructed in 1974. The facility consists of classrooms and administration offices (Readiness Center) and an aviation hangar with maintenance bays and mechanical shops (Army Aviation Support Facility). For this study, only the Readiness Center portion of the facility was studied. The Readiness Center was part of major addition in 1999 that added offices, a kitchen, classrooms, a library, administration spaces, and various training spaces to the existing aviation hanger, maintenance bays, and armory. The Readiness Center is a single floor attachment with a north-south orientation. The facility also serves as a representative sample of other aviation support sites for the National Guard that are installed nationwide.
The Waterloo Readiness Center is served by a single RTU, RTU-1, serving a total of 14 pressure independent VAV boxes. RTU-1 is a rooftop packaged unit with a 3 MHP supply fan and two 2 MHP return fans. The mixed air unit contains DX cooling and gas fired heating
coils and can deliver 5,220 cfm of air at a max external static pressure of 1.60” WC. RTU-1 serves 14 VAV boxes, 12 of which have electric reheat. In addition, the facility has hoods and motor operated dampers serving various rooms such as kitchens, lockers, supply storage and mechanical areas that are not trended for this study. Table 2.6 provides specifications of the packaged rooftop unit.
Table 2.6 Waterloo Readiness Center RTU details.
The Waterloo RC facility utilizes a building automation system with a BACnet interface. The existing system already uses a form of static pressure reset and a reset strategy for supply air temperature. It was discovered that because the rooftop is a packaged unit, some trends were internal to the RTU and not able to be trended. This mainly pertained to the supply air temperature setpoint that is internal to the packaged unit.
All of the sites investigated were found to have viable HVAC and DDC systems for this study. Each site is a representative sample of National Guard and commercial facilities nationwide that experience similar weather, functions, and static pressure control strategies. Tables 2.7 and 2.8 summarize the facility, HVAC and DDC system information and
specifications collected from the site investigations.
ID Tag VAVs Fans CFM MHP Ext. SP Fans CFM MHP Ext. SP
Waterloo RC RTU-1 14 1 5,220 3 1.60" 2 2,610 1 0.70"
Supply Fan
21
Table 2.7 Site investigation results, facility details.
Table 2.8 Site investigation results, HVAC equipment details.
During the site investigations, many of the facilities required additional equipment and software to properly conduct the study. Many of the VFDs were too old to record power use, or existing DDC software was unable to trend data reliably. Calibrations, repairs and replacements were needed on numerous sensors, fire safety dampers, damper actuators, etc. Another prevalent issue was the need to reset airflow setpoints for some VAV zones as the
Facility Details Boone RC Des Moines MEPS JFHQ Muscatine AFRC Waterloo RC
Date Constructed 1963 2008 1994 2011 1974
Climate Zone 5A 5A 5A 5A 6A
Size 77,321 ft2 28,200 ft2 237,126 ft2 37,392 ft2 34,185 ft2
# of Floors 1 1 4 1 2
# of Units 2 AHUs 1 AHU 6 AHUs 3 RTUs 1 RTU
# of VAV boxes 64 34 223 36 14
DDC System #1 #2 #3 #4 #5
Control Strategy
Pressure Fixed Reset Reset Reset Fixed
Temperature Fixed Reset Reset Reset Fixed
ID Tag VAVs Fans CFM MHP Ext. SP Fans CFM MHP Ext. SP
AHU-1 28 1 12,000 15 2.20" 1 12,000 10 1.75"
AHU-2 36 1 12,000 15 1.70" 1 12,000 10 1.75"
Des Moines MEPS AHU-1 34 1 22,000 20 2.00" 1 22,000 10 0.90"
AHU-1 42 1 16,000 20 3.00" - - - -AHU-2 50 1 16,000 20 3.00" - - - -AHU-3 38 1 16,000 20 3.00" - - - -AHU-4 41 1 16,000 20 3.00" - - - -AHU-9 5 1 5,800 7.5 2.25" - - - -AHU-12 47 4 21,750 30 6.00" 4 19,500 7.5 0.50" RTU-1 3 1 2,235 2 2.10" - - - -RTU-3 17 1 10,250 15 2.20" 1 2,335 2 1.20" RTU-4 16 1 9,610 10 2.20" 1 1,830 2 1.20" Waterloo RC RTU-1 14 1 5,220 3 1.60" 2 2,610 1 0.70" Boone RC JFHQ Muscatine AFRC
existing static pressure setpoints were vastly reduced from design static pressure setpoints from when the facilities were first commissioned. This was done mostly due to noise complaints or units tripping from high static pressure alarm faults.
2.4 Custom TTR Programming
To implement the TTR strategy at all 5 sites, local HVAC contractors were hired to implement the strategy on their respective DDC system. In doing so, the custom
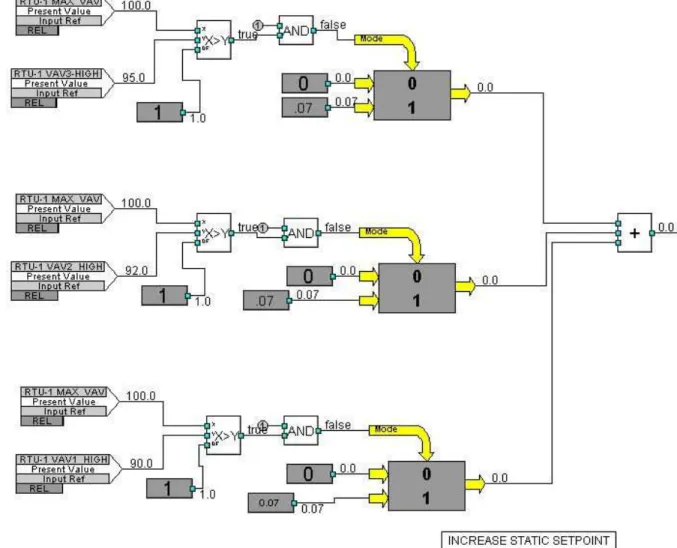
programming languages (CPLs) created across all sites are unique, but contain the same components of the TTR strategy as stated earlier: the most open damper position selection, static pressure setpoint calculation and limit check section. Overall, each CPL for the TTR strategy will contain these three functions. The TTR strategy begins with the most open damper position selection. A series of logic statements are used to determine the maximum damper position, from either feedback or command signal, within the VAV system. Figures 2.2 and 2.3 illustrate how this section was implemented in some DDC systems.
23
2
4
25
The CPLs shown, Figure 2.2 and 2.3, are unique in the steps taken, but achieve the same effect. The damper position values are selected from the DDC system, and then compared in a “Max” functional block that passes on the greatest value. After a series of steps using the “Max” functional block, the MDP is selected from all VAV box dampers.
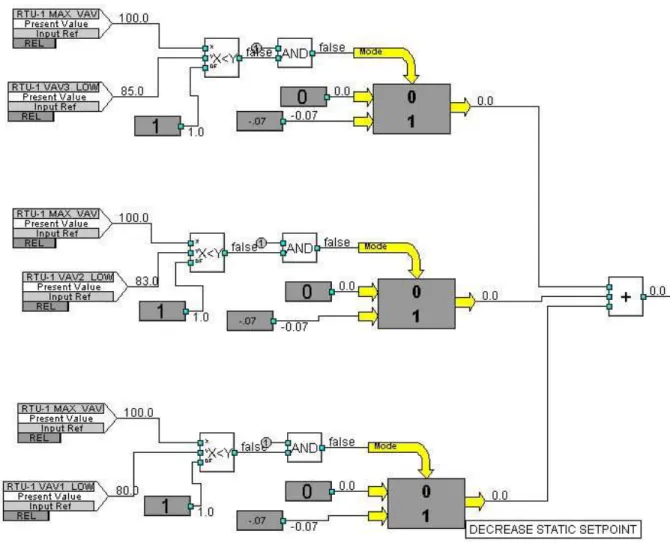
Once the MDP is selected, the CPL then determines the new static pressure setpoint using the TTR strategy. Again, this is achieved by a second set of logic statements, leading to the summation of TM or RP values based on the max damper position. Figures 2.4 and 2.5 show an example of functional blocks used for calculating the new static pressure setpoint.
In Figure 2.4 an example of the static pressure calculation is provided. Here the MDP is compared to the set of ranges [High1, High2, High3]. If the MDP is greater than the listed ranges, a true signal is carried on to the TM summation. A true or false logic function is used to determine which TM tiers are summed. For example, if the MDP equals 96, all three tiers will be summed as 96 is greater than High1, High2 and High3 (90, 92 and 95, respectively). Figure 2.5 provides an example of the static pressure calculation when the MDP value is greater than Low1, Low2 and Low3, where the RP values would not be summed. Note the TTR strategy was disabled at the time of capturing Figures 2.4 and 2.5.
27
Just as in Figure 2.4, the steps taken in Figure 2.5 are similar, only summing the RP values to decrease the static pressure setpoint rather than increase the setpoint if the MDP value is less than Low1, Low2, or Low3.
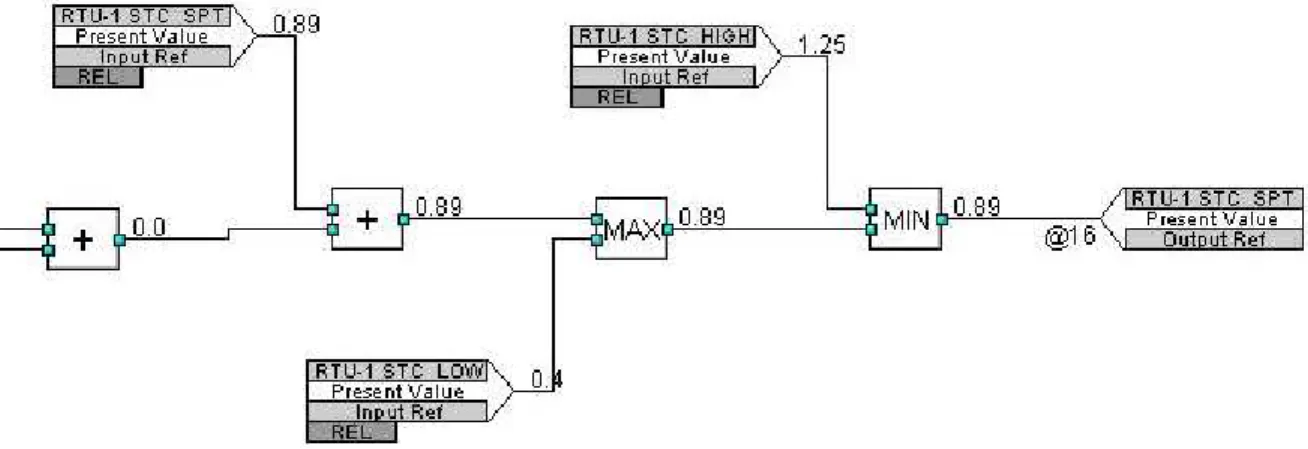
Lastly, the newly calculated static pressure setpoint is compared to the facility operator defined limits of the static pressure range. These are the maximum and minimum setpoints the static pressure setpoint is allowed to traverse. If the calculated value is above the established maximum static pressure setpoint, or below the minimum static pressure setpoint, the value is reverted to the established maximum static pressure setpoint or minimum static pressure setpoint, respectively. The Figure 2.6 shows the logic statements used for the limit check section.
Figure 2.6 Limit check section, from DDC system #4.
In Figure 2.6, the summed TM or RP values are added to the previous static pressure
setpoint. Next, the new static pressure setpoint is compared to the predefined minimum static pressure setpoint. The greater of the two values is carried on to a comparison with the
predefined maximum static pressure setpoint. The lesser of the two values is the new static pressure setpoint.
2.5 Data Collection
Due to the scope of this research, a wide array of data points were collected. A number of hardware and software installations were required at each site to fulfill the data collection needs of the study, including a breadth of HVAC data, collection intervals at 1 or 2 minutes, and history logs lasting several weeks. Table 2.9 below provides the AHU/RTU trends and Table 2.10 provides the VAV trends. Trends were recorded and analyzed in 1 or 2 minute intervals unless stated otherwise.
Table 2.9 AHU/RTU trends available at each site.
AHU/RTU Trend Boone RC Des Moines MEPS JFHQ Muscatine AFRC Waterloo RC
Date/Time Yes Yes Yes Yes Yes
Outside Air Temperature Yes No No Yes Yes
Outside Air Humidity Yes No No Yes Yes
Functional Mode Yes Yes Yes Yes Yes
Occupancy Status Yes Yes Yes Yes Yes
Static Pressure Setpoint Yes Yes Yes Yes Yes
Static Pressure Yes Yes Yes Yes Yes
Supply Air Temperature Setpoint Yes Yes Yes No No
Supply Air Temperature Yes Yes Yes Yes Yes
Supply Fan Speed Yes Yes Yes Yes Yes
Return Fan Speed Yes Yes Yes Yes Yes
Supply Fan Power Yes Yes Yes Yes Yes
Return Fan Power Yes Yes Yes Yes Yes
Supply Fan Energy Yes Yes Yes Yes Yes
Return Fan Energy Yes Yes Yes Yes Yes
29
Table 2.10 VAV box trends available at each site.
*Trended at 30 minute intervals.
**Trends reversed from hardware replacement during study.
From Table 2.9, the weather related trends at the Des Moines MEPS and JFHQ were unavailable but were deemed close enough (~30 miles) to the Boone RC facility. The most open damper trends for Des Moines MEPS, Muscatine AFRC and Waterloo RC were calculated during the data analysis.
As the main objective of this study is to demonstrate the fan energy savings using the TTR strategy, the trends involving functional mode, static pressure, static pressure setpoint, most open damper position and fan motor power were key measurements. VAV trends pertaining to space temperature and space temperature setpoints were also important to demonstrate temperature control performances between TTR and TR strategies. The
remaining trends are intended to reveal underlying issues pertaining to HVAC/DDC systems and any flaws within the TTR strategy.
To achieve the collection of the data points listed above, local HVAC contractors were hired to also setup their respective DDC system with the capability to trend and export these data. Many sites had this capability already, while others required the installation of additional hardware and/or 3rd party export utilities.
VAV Trend Boone RC Des Moines MEPS JFHQ Muscatine AFRC Waterloo RC
Airflow NA NA Yes NA NA
Damper Position Command Feedback Feedback Command* Command
Space Temperature Setpoint Yes No** No Yes* No
Space Temperature Yes Yes Yes Yes* Yes
Heating Setpoint No Yes** Yes No Yes
Cooling Setpoint No Yes** Yes No Yes
Many of the alterations were software based as the existing DDC systems were configured only to trend live data without recording any history. Some supply and return fan VFDs required communication cards to be installed by local HVAC contractors to record power use, while others did not have this option available. For these VFDs, data logging systems were procured and installed to record the fan motor power from the input side of the respective VFD.
VFD Communication Card Installation
Several VFDs within the JFHQ site had the option for a communication card installation to fulfill the power data logging requirements. This option was chosen over the installation of data logging systems due to cost constraints. The installation was later verified with a reference power meter, comparing the power readings from the VFD display, DDC system and power meter. This pertained to all JFHQ AHUs except AHU-2.
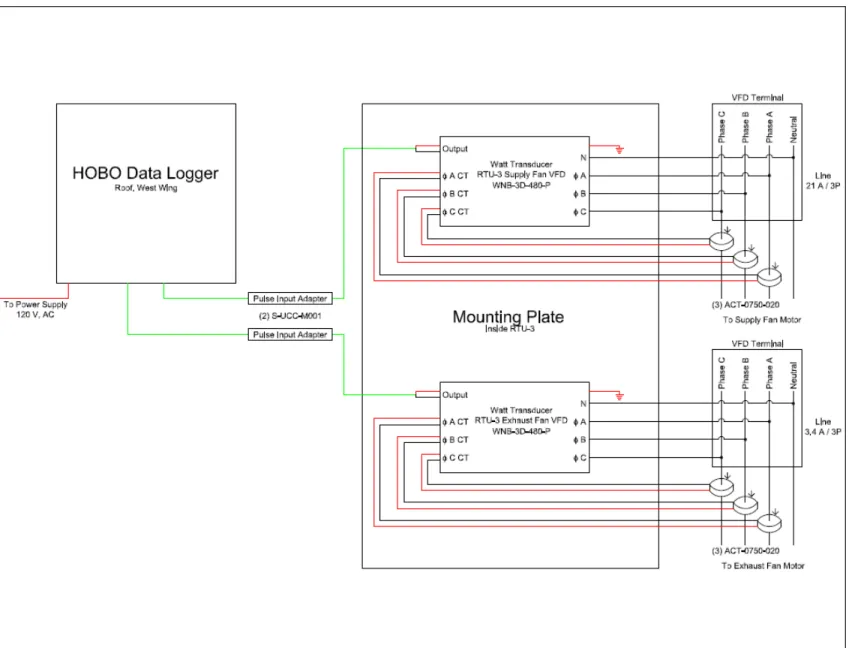
Data Logger Installation
For the VFDs that did not have optional communication cards to record power and energy data within the DDC system, 3rd party data logging systems were designed, procured and installed. A typical system installation contained Accu-CT split-core current
transformers (CTs), WattNode Pulse Output watt transducers, Onset pulse adapters, and a HOBOTM data logger from Onset with cellular network connectivity. Due to the capabilities
of the CT’s and watt transducers, the data logging system could only record power use on the input side of the VFDs. The purchased equipment came with certification from the
31
were rated ± 0.75% from 1% to 120% of rated primary current (listed in Table 2.11). The listed accuracy of the watt transducers from WattNode were rated to at most ±3% of reading given the conditions expected during the study. The pulse adapter from Onset provides a resolution of 1 pulse, resulting in a variable resolution that is dependent on the size of the connected CTs. For this study, the resolution with the 20A rated CTs attached is .06924808 kW and with the 50A rated CTs attached is 0.17312520 kW. Table 2.11 and 2.12 specify the sites and AHUs/RTUs that required data logging hardware and Figure 2.7 illustrates a wiring diagram of a typical data acquisition system (DAS) installation found at these sites.
Table 2.11 Installed data logging equipment.
*Equipment was installed later on during the study.
Site JFHQ Waterloo RC
Unit AHU-2 RTU-1
Data Loggers 1 1
Manufacturer Onset Onset
Model HOBO U30-GSM HOBO U30-GSM
Pulse Adapter 1 2
Manufacturer Onset Onset
Model S-UCC-M006 S-UCC-M006
VFD Supply Fan Return Fan Supply Fan Supply Fan
Watt Transducers 1 1 1 1
Manufacturer WattNode WattNode WattNode WattNode
Model T-WNB-3D-480 T-WNB-3D-480 T-WNB-3D-480 T-WNB-3D-480
Rating 480Y-3P 480Y-3P 480Y-3P 480Y-3P
CTs 3 3 3 3
Manufacturer Accu-CT Accu-CT Accu-CT Accu-CT
Model T-ACT-0750-050 T-ACT-0750-020 T-ACT-0750-050 T-ACT-0750-020
Size 50 Amps 20 Amps 50 Amps 20 Amps
Des Moines MEPS* AHU-1 S-UCC-M006 1 Onset HOBO RX3000 2 Onset
Table 2.12 Installed data logging equipment (continued).
Site
Unit RTU-1
Data Loggers 1
Manufacturer Onset
Model HOBO U30-GSM
Pulse Adapter 1
Manufacturer Onset
Model S-UCC-M006
VFD Supply Fan Supply Fan Return Fan Supply Fan Return Fan
Watt Transducers 1 1 1 1 1
Manufacturer WattNode WattNode WattNode WattNode WattNode
Model T-WNB-3D-480 T-WNB-3D-480 T-WNB-3D-480 T-WNB-3D-480 T-WNB-3D-480
Rating 480Y-3P 480Y-3P 480Y-3P 480Y-3P 480Y-3P
CTs 3 3 3 3 3
Manufacturer Accu-CT Accu-CT Accu-CT Accu-CT Accu-CT
Model T-ACT-0750-020 T-ACT-0750-020 T-ACT-0750-020 T-ACT-0750-020 T-ACT-0750-020
Size 20 Amps 20 Amps 20 Amps 20 Amps 20 Amps
RTU-4 RTU-3 Muscatine AFRC S-UCC-M006 Onset 2 HOBO U30-GSM Onset 1 S-UCC-M006 Onset 2 HOBO U30-GSM Onset 1
3
3
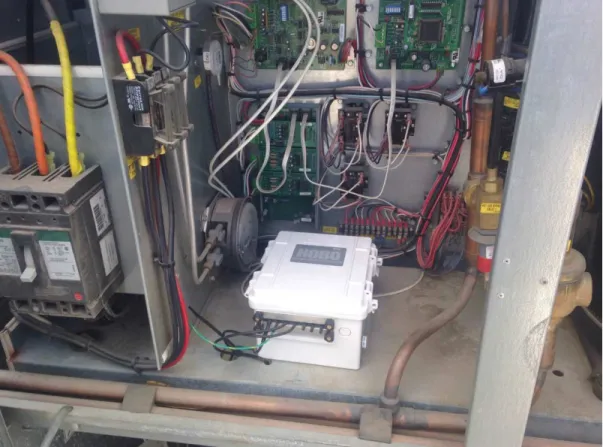
With the watt transducer tied into the voltage line of the VFD input and the attached CTs measuring the current in each phase, the input power, in kW, was outputted in the form of “pulses” by the pulse adapter. The pulse adapter would then count the amount pulses in a user defined interval, 1 minute for this study, and relay the pulse counts to the data logger at that defined interval. Figure 2.8 shows the CTs clamped around the input power of the RTU-1 supply fan VFD at Muscatine AFRC.
35
Figure 2.9 HOBO data logger installed in RTU-1 at Waterloo Readiness Center.
The data logger (Figure 2.8) would then upload the pulse count data at a predefined interval, every 15 minutes, to a private server account over cellular network. The server would then convert the pulse counts from each watt transducer to units of kW, and display live readings and data logger status on the server’s webpage. Here the kW data were exported in a .csv or text file by direct download or email. To ensure continuous operation in cases such as power loss, surge, etc., the data logger was plugged into a standard 110VAC outlet, and in-line fuses were installed on the voltage side of the watt transducers. The data logger also contained a 4 Ah lead-acid battery that would last approximately 2 weeks with the data collection and upload rates used during this study.
Along with the additional hardware and software installed at each site, strategies to mitigate interruptions regarding power loss were implemented. For most sites, this included
an uninterruptable power supply (UPS) to be installed to the DDC system and computer interface. This would allow the DDC system/hardware adequate time to safely shutdown in the event of power loss. Most sites had existing onsite emergency generators that would provide power within minutes, requiring the installed UPS to provide power during the lapse between a power outage and the startup of emergency generators.
Data Collection Procedure
Throughout the demonstration period of the research, data were collected every two weeks. This would provide a full set of completed TTR, FSP or TR data to process and analyze. Data were downloaded from the DDC system computer and sent through email or USB drive. During the CPL installation by local HVAC contractors, data download functions were implemented to the DDC system software. This allowed the data trends to be placed into standardized formats and downloaded as .csv or .xlsx files to be easily exported and processed.
2.6 Data Analysis
As data were collected throughout the study, data analysis was used to verify the correct operation of the functional modes and associated HVAC equipment. To accomplish this, several computer scripts were written in MATLAB, and standardized templates were constructed in Microsoft Excel. Because the collected data were in a .csv or .xlsx file format, data were processed using MATLAB and exported into a preformatted Microsoft Excel spreadsheet.
37
After the raw data collected from each site were processed and exported to a
preformatted Excel file, the data were analyzed with several charts that displayed the various data trends. Most importantly for the AHUs and RTUs, most open damper position and static pressure setpoint was inspected to ensure the ongoing correct operation of the TTR strategy. The static pressure trend was used to ensure the AHU or RTU was able to maintain the static pressure setpoint and to confirm or adjust the TM and RP rates and formula of the TTR strategy during preliminary testing. Supply air temperature setpoint and supply air
temperature were also observed to ensure operations of the boilers and chillers or if the AHU or RTU had the capability to properly serve the demands of their VAV zones.
VAV zone trends were closely inspected to determine normal operation, or deduce any probable causes of incorrect operations that would adversely affect the TTR strategy such as a stuck open damper. These trends made up the bulk of the processed data file as the AHUs and RTUs contained numerous VAV boxes with several trends per box.
Once all trends were inspected, a report based on the performance and issues was created. Depending on the severity of the performance or issues, the findings would be relayed to facility engineers or appropriate HVAC contractors. The reports were also used to update National Guard staff on the progress of the study.
CHAPTER 3
PRELIMINARY TESTING & OBSERVATIONS
3.1 Testing and Verification
Before the official demonstration could begin, various testing and verification processes were needed in order to validate the correct implementation of all software and hardware installed for this study. To do so, functional tests were needed for the installed TTR logic and the power readings of the VFD display, DDC system, and installed communication cards needed to be verified. Also, refinement of TM and RP calculations was needed due to observations of static pressure oscillation during initial testing.
Functional Mode Testing
With a variety of custom TTR programs installed by local contractors at the selected Iowa Army National Guard sites, a standardized functional test for the TTR control logic was implemented. The objective of the functional test was to verify the correct operation of the custom TTR programs in each of the DDC systems used. The test was provided by Taylor Engineering, Inc. and was performed on a dynamic, macro-enabled excel sheet, with the recommended TTR formula and settings installed in background functions. To complete the functional test, the DDC system and spreadsheet would run side by side in a live comparison. Using the test inputs provided from the spreadsheet, the response from the DDC system and the expected response from the spreadsheet were compared. Any discrepancies found were noted and resolved as soon as possible.
39
The functional test began with the entering of site and AHU specific data: Date, Time, maximum and minimum static pressure setpoint limits, initial static pressure setpoint, TTR cycle time, and VAV boxes to test the most open damper position and static pressure setpoint calculation of the TTR programs. With these entries, the functional test spreadsheet would generate the recommended TM and RP rates, and asked the operator to verify if the results matched what was observed from the DDC system.
The functional test then progressed through several scenarios. This required manually overriding the test VAV box damper positions from the DDC system. With this information, the custom TTR program in the DDC system would output the newly calculated static pressure setpoint and send the appropriate command signal to the supply fan VFD. This was compared to the expected static pressure setpoint from the test spreadsheet and used to verify the supply fan response to the changing static pressure setpoints. The static pressure setpoint was first compared to the initial static pressure setpoint value from Step 1. In the proceeding steps, the test VAV box damper positions were altered to achieve an expected response from the DDC system. For example, with all VAV box damper positions at 85%, the static
pressure setpoint should remain unchanged the next following TTR step time cycle. If one of the VAV box damper positions was then adjusted to 92%, the static pressure setpoint should increase by an amount equal to TM1.
Along with the setpoint comparison, the functional test included a comparison for the limit check section of the custom TTR programs. By adjusting the test VAV box damper positions to 99%, this would increase the static pressure setpoint calculation by an amount equal to TM1+TM2+TM3. However, the resulting static pressure setpoint could not be greater than the predefined maximum static pressure setpoint.
For the remaining steps, the test VAV box damper positions were then decreased in order to simulate a reduction in building demand. This was to verify the correct summation of the RP1, RP2 and RP3 values and the limit check of the minimum static pressure setpoint. Once the testing was completed, the test forms were submitted for review.
Power Measurement Verification
To ensure proper readings of the VFDs studied during this study, a standardized testing procedure was created to verify the accuracy of the VFD display and DDC system trends and the accuracy of the VFD display and data logging systems. Using a Fluke 41B Power Harmonics Analyzer with a Fluke 80i-500s AC current probe, the VFDs at Des Moines MEPS, Boone RC and JFHQ were tested and verified.
The Fluke 41B had a listed accuracy for watt measurements of ± 1% + 4 digits and a resolution of 0.01 kW in the 1 kW range used for testing. The reference power meter was certified by the manufacturer to be properly calibrated during the time of the testing. The current probe had a listed accuracy for AC current from 1 to 20A of 10% + 0.3A for 10 to 45 Hz and 5% + 0.3A for 45 to 60 Hz. For AC current from 20 to 100A, the accuracy was 10% for 10 to 45 Hz and 5% for 45 to 60 Hz. The AC current probe was certified by the
manufacturer to be properly calibrated during the time of the testing.
To collect test readings from the VFDs using the reference power meter, the VFD panel control was selected to “hand” operation to freely adjust the speed command signal. Starting at the minimum allowed speed, typically 20 Hz or 30% and then rising by 10 Hz or 15% each interval to the maximum allowed speed, typically 60 Hz or 100%. The power
41
readings were recorded after the VFD speed had stabilized, typically after one or two minutes. Table 3.1 provides sample results from JFHQ AHU-2 supply fan VFD.
Table 3.1 Power verification results from JFHQ AHU-2 supply fan.
In Table 3.1, the “VFD Efficiency” column is a comparison of the “Power Meter” input power readings and the “VFD Display” output power. The “Error” column is a comparison of the trended power data and the actual power data. For the JFHQ AHU-2 supply fan, this was a comparison of the data logger input power readings and the “VFD Display” output power.
While the tests included the full allowable range of speed of the VFDs, larger errors at low frequencies were acceptable as the supply and return fans do not normally operate in this range. All tested VFDs had limits of 18 Hz to 20 Hz as the minimum setting, while the maximum was either 60 Hz or indirectly limited by an external high static pressure alarm within the DDC system or AHU that tripped the unit if faulted. VFDs also inherently have losses resulting in error due to internal workings; a portion of the error was also attributed to the resolution of the VFD displays, typically ±.05 kW.
Output
Speed Frequency Power Meter Data Logger VFD Display Data Logger Reading
% Hz kW kW kW % % 30.00% 18 0.465 0.519 0.41 11.61% 21.00% 45.00% 27 1.33 1.38 1.3 3.76% 5.80% 60.00% 36 2.6 2.77 2.65 6.54% 4.33% 75.00% 45 3.85 3.98 3.8 3.38% 4.52% 90.00% 54.2 5.95 5.54 5.9 6.89% 6.50% 100.00% 60 - - - - -Error Input AHU-2 SF
3.2 Initial Demonstration
After the TTR programs and power reading equipment were installed and verified, an initial demonstration was conducted to ensure the parameters used such as TM, RP and Step Timer values were adequate. During this time, functional modes alternated daily between TTR and FSP or TTR and TR. Table 3.2 provides the initial parameters and the functional mode comparisons and Table 3.3 provides temperature control strategies and setpoints used.
Table 3.2 Initial functional mode comparison and TTR parameters.
Site Unit Functional
Mode TTR Parameters Step Timer TM1/RP1 TM2/RP2 TM3/RP3 Boone RC AHU-1 TTR FSP 0.036" 0.072" 0.108" 90 AHU-2 TTR FSP 0.030" 0.060" 0.090" 90 Des Moines MEPS AHU-1 TTR FSP 0.038" 0.076" 0.114" 60
JFHQ AHU-1 TTR FSP 0.060" 0.120" 0.180" 120 AHU-2 TTR TR 0.050" 0.100" 0.150" 120 AHU-3 TTR TR 0.060" 0.120" 0.180" 120 AHU-4 TTR FSP 0.050" 0.100" 0.150" 120 AHU-9 TTR FSP 0.040" 0.080" 0.120" 120 AHU-12 TTR FSP 0.020" 0.040" 0.060" 120 Muscatine AFRC RTU-1 TTR FSP 0.030" 0.060" 0.090" 120 RTU-3 TTR FSP 0.080" 0.160" 0.240" 120 RTU-4 TTR FSP 0.070" 0.140" 0.210" 120 Waterloo RC RTU-1 TTR FSP 0.090" 0.180" 0.270" 90