Research Paper
Lockdown timing and ef
fi
cacy in controlling COVID-19 using mobile
phone tracking
Marco Vinceti
a,b,*, Tommaso Filippini
a, Kenneth J. Rothman
b,c, Fabrizio Ferrari
d, Alessia Gof
fi
d,
Giuseppe Maffeis
d, Nicola Orsini
ea
Environmental, Genetic and Nutritional Epidemiology Research Center (CREAGEN), Section of Public Health, Department of Biomedical, Metabolic and Neural Sci-ences, University of Modena and Reggio Emilia, Via Campi 287, 41125 Modena, Italy
b
Department of Epidemiology, Boston University School of Public Health, 715 Albany St, Boston, MA 02118, United States
cRTI Health Solutions, 3040 E Cornwallis Rd, Research Triangle Park, NC 27709, United States dTerraria, Via Melchiorre Gioia, 132, 20125 Milan, Italy
e
Department of Global Public Health, Karolinska Institutet, Solnav€agen 1 E, 11365 Stockholm, Sweden
A R T I C L E I N F O
Article History:
Received 18 May 2020 Revised 20 June 2020 Accepted 25 June 2020 Available online 13 July 2020
A B S T R A C T
Background:Italy’s severe COVID-19 outbreak was addressed by a lockdown that gradually increased in
space, time and intensity. The effectiveness of the lockdown has not been precisely assessed with respect to the intensity of mobility restriction and the time until the outbreak receded.
Methods:We used processed mobile phone tracking data to measure mobility restriction, and related those
data to the number of new SARS-CoV-2 positive cases detected on a daily base in the three most affected Ital-ian regions, Lombardy, Veneto and Emilia-Romagna, from February 1 through April 6, 2020, when two subse-quent lockdowns with increasing intensity were implemented by the Italian government.
Findings:During the study period, mobility restriction was inversely related to the daily number of newly
diagnosed SARS-CoV-2 positive cases only after the second, more effective lockdown, with a peak in the curve of diagnosed cases of infection occurring 14 to 18 days from lockdown in the three regions and 9 to 25 days in the included provinces. An effective reduction in transmission must have occurred nearly immedi-ately after the tighter lockdown, given the lag time of around 10 days from asymptomatic infection to diag-nosis. The period from lockdown to peak was shorter in the areas with the highest prevalence of the infection. This effect was seen within slightly more than one week in the most severely affected areas.
Interpretation:It appears that the less rigid lockdown led to an insufficient decrease in mobility to reverse an
outbreak such as COVID-19. With a tighter lockdown, mobility decreased enough to bring down transmission promptly below the level needed to sustain the epidemic.
Funding:No funding sources have been used for this work.
© 2020 The Authors. Published by Elsevier Ltd. This is an open access article under the CC BY-NC-ND license. (http://creativecommons.org/licenses/by-nc-nd/4.0/) Keywords: COVID-19 SARS-CoV-2 Outbreak Epidemiology Cellphone Lockdown Peak Time trend 1. Introduction
As SARS-CoV-2 spread rapidly, the inability to control COVID-19 through contact tracing left few options to public-health officials. The major approach has been the adoption of strict rules to decrease indi-vidual mobility and increase social distancing, accompanied by use of personal protective measures such as masks and gloves[1]. When these measures were sufficiently tight, they have been described as a ‘lockdown’. These lockdowns were implemented in varying degrees and at different times, and while they appeared to be effective in
interrupting transmission [2,3], details of their efficacy are yet to be elaborated and are currently under active investigation [2,4 9].
Northern Italy was affected early and severely by SARS-CoV-2. Lockdowns across Italy and elsewhere were implemented in stages amid intense sociopolitical and scientific debate [7,10 13]. Here we report on how effective these restrictions in Italy have been in reduc-ing individual mobility and controllreduc-ing spread of SARS-CoV-2. In response to suggestions to use mobile phone data to study and curb COVID-19 [12,14,15], we assessed mobility through cellphone track-ing data as a proxy for individual mobility and lockdown efficacy, and examined the relation of the mobility data to SARS-CoV-2 positivity, obtained from nationwide open access data[16].
* Corresponding author.
E-mail addresses:[email protected],[email protected](M. Vinceti).
https://doi.org/10.1016/j.eclinm.2020.100457
2589-5370/© 2020 The Authors. Published by Elsevier Ltd. This is an open access article under the CC BY-NC-ND license. (http://creativecommons.org/licenses/by-nc-nd/4.0/) Contents lists available atScienceDirect
EClinicalMedicine
2. Methods
This study used data available without cost from publicly available sources. We focused on the Lombardy, Veneto and Emilia-Romagna regions of Italy, which were in early March the most highly affected areas of Italy, with 82% of cases[17].
We used cellphone mobility data during the period February 1-March 27 (the latest date available) as a proxy for individual mobility. We then examined, within provinces, the relation of these mobility data to daily positive tests for SARS-CoV-2. We also examined the influence of Italian national rules adopted to counteract the COVID-19 outbreak. Thefirst rule was a nationwide lockdown decreed on February 23, 2020 following the detection of thefirst case of SARS-CoV-2 infection in Italy on February 20, 2020[18]. Thisfirst‘soft’lockdown included among other measures the closure of all schools and universities in the country, and all non-essential industrial and commercial activities; limiting the activities of public offices; prohibiting any gathering of people in churches, museums, and leisure areas; and decreasing public transpor-tation. In addition, on the same day (February 23, 2020), an integrative rule[19]imposed a tighter, nearly complete lockdown on two hot spots with the highest COVID-19 incidence in Italy (so called‘red zones’): ten municipalities in the Lodi province in Lombardy and one in the Padua province in Veneto. The second rule established a tight lockdown on March 8, 2020 for most of the population of the Veneto and Emilia-Romagna regions and the entire Lombardy region, and extended to the rest of Italy one day later[20]. The rule prohibited any kind of mobility apart from certain health or professional needs.
To track mobile phone movements, we used anonymous data from the subscriber identification module (SIM) cards of 27 million people processed and made available by Teralytics[21-23]. Through call detail records, information on the position of mobile phones within the car-rier network can be used in conjunction with transport models to con-struct people’s movements based on a daily trip counter. Mobility for a community was expressed as the number of journeys made per capita during the period February 1, 2020 to March 27, 2020. Journeys included all trips into, out of, and within each province. A trip was con-sidered to end when the cellphone remained in place for at least one hour. Journeys shorter than 2 kms were not captured by the model. All data made available to us were entirely anonymous, pursuant to cur-rent data protection rules in Italy. These rules allow personal phone calls to be divulged only to the judicial system[24], whereas anony-mous processed data are available to public and private entities for monitoring and research purposes. As no individuals were identified, the study was exempt from ethical review[25].
Our health endpoint was the diagnosis of newly diagnosed infec-tions from SARS-CoV-2 as reported and publicly available in the web-site of the Italian Ministry of Health / Civil Protection [16] from February 24 up to April 6, 2020. It corresponded to the number of positive tests of infection based on quantitative reverse transcription polymerase chain reaction[26], by date and province as reported to the National Civil Protection Agency by the Health Services of the Ital-ian regions[16]. No municipality-specific data were available from that source or other sources. All such positive SARS-CoV-2 cases were laboratory-confirmed by an officially accredited laboratory and by the National Institute of Health in Rome[26]. It was mandatory for all regions of Italy, and the two independent provinces of Bolzano and Trento, to communicate this information daily[27].
We modeled the province- and region-specific time trends of daily residents’mobility based on time-series of mobile phone move-ments, using a linear regression taking into account heteroskedastic-ity and autocorrelation up to 7 days using a Newey West estimator [28]. In modeling the mean number of movements, we used calendar time in days with a mix constant and linear splines to allow shift in both level and trend at the two major intervention dates, February 23, 2020 and March 8, 2020.
Using the same statistical methodology, we also modeled the time trends in SARS-CoV-2 infection based on the mean number of newly diagnosed cases reported on a daily basis to the Ministry of Health from each province and region. To do that, we used calendar time in days with restricted cubic splines using 5 knots atfixed percentiles (5th, 27¢5th, 50th, 72¢5th and 95th) of its distribution to estimate the day of peak occurrence. In the second stage, we examined the relation between the proportional reduction in daily movements during lock-down compared with the period before restrictions were imposed, before thefirst lockdown. Percentiles of time to peak, censored for provinces that did not reach the peak by April 6, 2020, were derived from the Kaplan-Meier method. We used a Laplace regression model [29]to assess the association between proportional reduction in daily movements and SARS-CoV-2 infection prevalence (per 1000 inhabi-tants) on March 8, 2020 with median time to peak, adjusting for the population of the province. We used Stata 16¢1 software to perform all analyses (codes available on request from TF and NO).
Role of funding: no funding sources have been used for this work. 3. Results
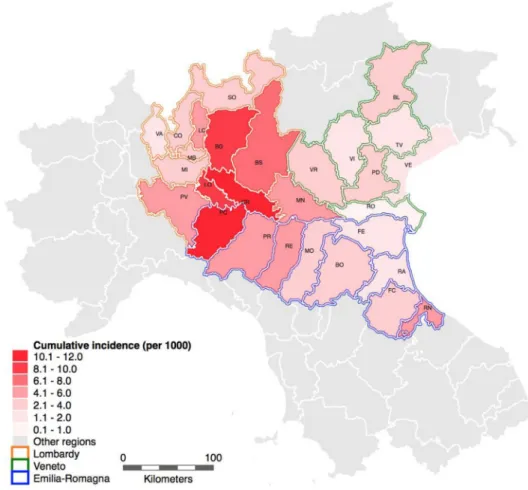
Fig. 1is a map of the three study regions, indicating the comparative cumulative incidence of newly diagnosed SARS-CoV-2 infected cases by province up to April 6, 2020. During the study period, the mean reduction of cellphone movements after the March 8, 2020 lockdown compared with thefirst week of February was 52% overall, with a range of 44% 63%, and by region, 58% in Lombardy, 49% in Veneto and 52% in Emilia-Romagna, with movements decreasing over time.
Research in context Evidence before this study
The COVID-19 outbreak severely affected Northern Italy, prompting two successive lockdowns, the second more stringent than thefirst. However, little data are available about effective compliance of the population with these mobility restrictions, and their effect on curbing the outbreak. We used publicly avail-able processed data about cellphone movements and spread of SARS-CoV-2 infection in the three most affected Italian regions, Lombardy, Veneto and Emilia-Romagna, to examine the effect of each lockdown on mobility and the outbreak.
Added value of this study
Based on mobile phone tracking data, we found that the second lockdown produced a considerably greater decrease in individual mobility, which stemmed the outbreak. The peak in new cases occurred 14 to 18 days after the tighter lockdown in the three study regions and 9 to 25 days in the included provinces. Reduced transmission must have occurred much earlier, given the lag time between asymptomatic infection and result of the testing. Greater reduction in cellphone mobility and a higher prevalence of SARS-CoV-2 infection at time of lockdown implementation were associ-ated with a shorter lag in curbing the outbreak.
Implications of all the available evidence
In this highly industrialized and mobile Western population, the milder lockdown had little effect on individual mobility. However, after the near total lockdown there was a substantial reduction in individual mobility that promptly stemmed the outbreak, with a peak of new diagnoses of infections ranging from 9 to 25 days after its implementation. A higher intensity of mobility reduction and a higher prevalence of the infection are associated with larger effectiveness of the intervention.
InFig. 2, we report the day-specific absolute numbers of mobile phone tracking movements and new positive tests of SARS-CoV-2 infection from February 24, 2020 through April 6, 2020 within the Lombardy, Veneto and Emilia-Romagna regions. In Lombardy, the region with the highest spread of the outbreak, the peak of new infected cases came 14 days after the second lockdown, following a 58% reduction in mobile phone tracking daily movements, while in Veneto and Emilia-Romagna the peak came after 18 days, with a movement reduction of 49% and 52%, respectively.
InFigs. 3,4we report the corresponding analysis for the province of Lodi, where thefirst and largest‘red area’was located, and in the six provinces closest to this area (Bergamo, Brescia, Cremona, Milan, Pavia and Piacenza). In particular less than 25% of Lodi province was tightly locked down on February 23. The remainder was subject to the national light lockdown on February 23 and the tight one on March 8, resulting in a‘mixed’pattern of lockdown: in this province the peak of SARS-CoV-2 infected cases was reached 13 days after (on March 7, 2020) the begin-ning of its‘mixed’lockdown. Bordering Lodi, Milan had the highest num-ber of cases (11,538 on April 6), followed by Bergamo (9815 on April 6), which experienced a severe spread of the outbreak immediately before the March 8 lockdown. All but one of these Lodi-bordering provinces (i.e. Bergamo, Brescia, Cremona, Milan, and Piacenza) showed aflattening and then a drop in new cases after a period ranging from 9 to 18 days from the lockdown (shorter for the three provinces with the highest infection prevalence, Cremona, Bergamo and Brescia, and longer for the remaining Piacenza and Milan provinces). Conversely, Pavia showedfl at-tening of the curve 9 days after the lockdown (on March 17, 2020), but instead of a decline, new cases plateaued and then resumed climbing. This province, however, had fewer cases than the other provinces. Data about all the remaining provinces of Lombardy and Emilia-Romagna
regions, and of the Veneto region, are reported in Supplemental Figures 1 3. The number of days from the tight lockdown to the peak ranged from 9 to 25 days among these provinces, omitting the four that did not reach a peak within the study period (Pavia, Varese, Rovigo, and Ferrara).
Table 1shows the estimated number of days from the March 8, 2020 lockdown to the peak occurrence, according to province. It also lists for each of the study areas the number of positive cases of SARS-CoV-2 and their prevalence, the day of peak infection, and days after the March 8 lockdown to the peak (except for Lodi, which had an ear-lier lockdown). The median days from lockdown to peak (after exclu-sion of Lodi) was 18 days, with a minimum of 9, a 25th and 75th percentiles of 15 and 21, respectively. The shortest period from tight lockdown to peak was generally typical of the provinces (and the Lom-bardy region) having the highest prevalence of the infection. As noted, in Lodi the peak number of cases occurred one day before the March 8, 2020 lockdown, as an earlier lockdown was already in place as of Feb-ruary 23, 2020. In the four small provinces generally characterized by the lowest prevalence the number of cases was still increasing at the latest date available, April 6, 2020. The intensity of the mobility reduc-tion in the provinces and a higher virus prevalence on March 8, 2020 were inversely associated with the time from lockdown to the peak of the infection, with this interval being as short as 9 12 days in the provinces located at the center of the outbreak (Fig. 5). In a time to peak analysis, after exclusion of Lodi province and adjusting for popu-lation size, a 10% decrease in cell phone mobility was associated with a reduction of 3.3 days in the median time to peak until the peak occur-rence (95% confidence interval: 7.1 to 1.1). Further, an increase of 1/ 1000 in prevalence rate of SARS-CoV-2 infections on March 8, 2020 was associated with a reduction of 5.7 days of the median time to peak (95% confidence interval: 8.3 to 3.1).
Fig. 1.Northern Italy study area with the cumulative incidence (per 1000) of SARS-CoV-2 infected cases diagnosed through April 6, 2020 in the provinces of the Lombardy, Veneto
4. Discussion
Italy has extremely high penetration of cellphone ownership, and ranks among the highest countries in the world in mobile phone use [30]. Thus, localization information and mobility based on cellphone positioning should be a reliable proxy for individual mobility. Cell-phone location has been also recently used to assess population
mobility and associate it with spatial-temporal COVID-19 distribution [22,23], and it has been proposed as a tool to assess compliance with lockdown rules in a population[15].
Our data indicate that the imposed lockdowns were followed by a peak in case occurrence about 14 days later in the most affected region, and in some heavily affected provinces as early as 9 10 days later. This peak followed a continuous reduction over time of per-sonal mobility, presumably due to increasing compliance with the restrictions, as awareness of the health emergency grew and law enforcement intensified. Greater compliance with the mobility restrictions was associated with a swifter and more marked decrease in SARS-CoV-2 positive tests, particularly among medium-to-large provinces with rapid spread of the virus. The limited effect of the ‘light’ lockdown imposed by the partial nationwide restrictions issued by the national government on February 23, mainly as a conse-quence of the‘Codogno’hot spot in Lodi linked to patient-1 detection on February 20[31], is evidenced by the subsequent steep increase in new SARS-CoV-2 positive cases. While limited in scope, the data appear consistent with the hypothesis that within the range of inter-ventions enacted, the intensity of the mobility restrictions was related to the timing and effectiveness of the epidemic control. Our results are also consistent with preliminary data from the US, also based on cellphone movements, that have identified a lag time of 11 days, with a range of 9 to 12 days, since the beginning of social dis-tancing to the onset of COVID-19 case growth reduction[22].
Unlike the majority of provinces, four of them, Pavia, Varese, Rovigo and Ferrara, did not reach a peak in incidence of the infection through the end of the investigated period. This delay might be related to the relatively low incidence and prevalence of the infection in these provinces. In those circumstances, small outbreaks in hospi-tals, retirement homes and other restricted environments may play a relatively larger role in the spread of the infection, and be less suscep-tible to the beneficial effects of the lockdown.
The lag observed between lockdown and epidemic peak should be interpreted in relation to what is known about the natural history of the disease and the incubation period. The median/mean incubation period untilfirst symptoms appears to be slightly more than 5 days
Fig. 2.Day-specific absolute numbers of people movements (blue dots) and
SARS-CoV-2 positive cases (red dots) in the Lombardy, Veneto and Emilia-Romagna regions from February 1, 2020-April 6, 2020. Blue line shows the predicted mean number of movements obtained with a mix of constant and linear splines of calendar days with two knots at the major events of interest in determining lockdowns of different inten-sity (February 23, 2020 dashed gray line, and March 8, 2020 solid gray line). Red line shows the predicted mean number of new COVID-19 cases obtained with restricted cubic splines of calendar days with 5 knots to identify the maximum pre-dicted value (i.e. day of peak occurrence red triangle). The two series were modeled using the Newey West estimator.
Fig. 3.Day-specific absolute numbers of people movements (blue dots) and
SARS-CoV-2 positive cases (red dots) in Lodi province (Lombardy region) during February 1, 2020-April 6, 2020. Blue line shows the predicted mean number of movements obtained with a mix of constant and linear splines of calendar days with two knots at the major events of interest in determining lockdowns of different intensity (February 23, 2020 dashed gray line for the light lockdown in most of the province, solid gray line for the tight lockdown in the‘red zone’, around one quarter of the province; and March 8, 2020 solid gray line extended to the entire province). Red line shows the predicted mean number of new COVID-19 cases obtained with restricted cubic splines of calendar days with 5 knots to identify the maximum predicted value (i.e. day of peak occurrence red triangle). Wefitted time-series data using Newey West regres-sion models.
[32,33]. There was an additional lag, estimated in Italy to be 5 6 days [34], until test results led to a diagnosis. These intervals imply that the effect of the tight lockdown on transmission of virus was consid-erably shorter than our computed estimates of time to peak, because the peak of the infection curve would have occurred around 10 days earlier than the peak in official diagnoses. Therefore, the tight lock-down presumably reduced transmission within 5 days or less in the most affected regions and nearly immediately in the most affected provinces. Potential environmental sources of exposures and trans-mission, such as viral spread through air pollutants (particulate mat-ter) [35,36], or drinking water[37], were likely unimportant.
Other important public health measures also help to curb an outbreak such as this. These measures include swift identification and quarantine of new infections, tracking and quarantine of close contacts of infected cases, and use of personal protective equipment such as face masks [38 41]. All these measures were adopted in the study area from the beginning of the outbreak i.e. February 20, pursuant to national and regional regulations and general awareness of the population. While these steps presumably reduced transmission, it is impossible to say to what extent they contributed to the containment of the Italian outbreak.
An important limitation of these results is that patterns of the infec-tion and disease spread may influence testing and consequently the number of positive tests. For example, the detection of case clusters in hospitals or nursing homes may affect the daily pattern of positive test results. Thesefluctuations should be expected to be more apparent in smaller communities. On the other hand, these admissions for COVID-19 were not independently validated and therefore their completeness is unknown. Changes in testing eligibility over time or space would have influenced our results about the time to peak period, but these changes were minor, as testing followed guidance from the National Institute of Health. Testing was restricted to symptomatic individuals who had suspected contact with an infected person. An exception was Veneto, which expanded testing also to some asymptomatic individu-als since the beginning of the outbreak[42].
Thesefindings should be considered specific for the SARS-CoV-2 outbreak in Italy and may not necessarily apply to outbreaks based on other viruses, having different transmission features, or occurring in other places characterized by a different social structure, family struc-ture, culstruc-ture, and work habits. Finally, we acknowledge that the time to peak endpoint we computed following the implementation of a
Fig. 4.Day-specific absolute numbers of people movements (blue dots) and SARS-CoV-2 positive cases (red dots) in the provinces bordering Lodi i.e. Bergamo, Brescia, Cremona,
Milan, Pavia (Lombardy region) and Piacenza (Emilia-Romagna region) during February 1, 2020-April 6, 2020. Blue line shows the predicted mean number of movements obtained with a mix of constant and linear splines of calendar days with two knots at the major events of interest in determining lockdowns of different intensity (February 23, 2020 dashed gray line, and March 8, 2020 solid gray line). Red line shows the predicted mean number of new COVID-19 cases obtained with restricted cubic splines of calendar days with 5 knots to identify the maximum predicted value (i.e. day of peak occurrence red triangle). Wefitted time-series data using Newey West regression models.
Table 1
Number of total SARS-CoV-2 positive cases and tests (available only by region) through April 6, 2020, peak of the curve after the tight lockdown date (March 8, 2020), percent reduction in people daily movements at peak date, and interval between lockdown and peak date (days).
Population at Jan 1, 2019a
Total cases, March 8, 2020
Infection Prevalence March 8, 2020 (per 1000)
Total cases, April 6, 2020 Cumulative Incidence as of April 6, per 1000 COVID-19 tests implemented through April 6, 2020 (n/1000 residents)
Peak date (spline regression analysis) Movement% reduction after lockdown Interval between lockdown and outbreak peak (days) Lombardy 10,060,574 4189 0¢42 51,534 5¢12 154,989 (15¢4) March 22 58 14 Bergamo (BG) 1,114,590 997 0¢89 9815 8¢81 March 18 57 10 Brescia (BS) 1,265,954 501 0¢40 9477 7¢49 March 19 53 11
Como (CO) 599,204 27 0¢05 1473 2¢46 March 29 55 21
Cremona (CR) 358,955 665 1¢85 4260 11¢87 March 17 58 9
Lecco (LC) 337,380 53 0¢16 1712 5¢07 March 23 49 15
Lodi (LO) 230,198 853 3¢71 2278 9¢90 March 7 55 1 /13b
Mantua (MN) 412,292 56 0¢14 2084 5¢05 March 25 51 17
Milan (MI) 3,250,315 406 0¢12 11,538 3¢55 March 26 63 18
Monza/Brianza (MB)
873,935 59 0¢07 3157 3¢61 March 27 58 19
Pavia (PV) 545,888 243 0¢45 2700 4¢95 NA 53 NA
Sondrio (SO) 181,095 6 0¢03 614 3¢39 March 27 49 19
Varese (VA) 890,768 32 0¢04 1293 1¢45 NA 58 NA Veneto 4,905,854 670 0¢14 11,588 2¢36 146,288 (29¢8) March 26 49 18 Belluno (BL) 202,950 23 0¢11 558 2¢75 March 26 45 18 Padua (PD) 937,908 255 0¢27 2863 3¢05 March 27 54 19 Rovigo (RO) 234,937 5 0¢02 203 0¢86 NA 46 NA Treviso(TV) 887,806 126 0¢14 1726 1¢94 March 23 47 15
Venice (VE) 853,338 126 0¢15 1487 1¢74 March 23 55 15
Verona (VR) 926,497 63 0¢07 2755 2¢97 March 27 47 19
Vicenza (VI) 862,418 50 0¢06 1704 1¢98 March 30 45 22
Emilia-Romagna 4,459,477 1180 0¢26 17,556 3¢94 72,163 (16¢2) March 26 52 18
Bologna (BO) 1,014,619 62 0¢06 2617 2¢58 March 28 54 20
Ferrara (FE) 345,691 6 0¢02 510 1¢48 NA 49 NA
Forlì-Cesena (FC) 394,627 15 0¢04 1015 2¢57 April 2 46 25
Modena (MO) 705,393 97 0¢14 2691 3¢81 March 26 53 18
Parma (PR) 451,631 276 0¢61 2317 5¢13 March 24 58 16
Piacenza (PC) 287,152 528 1¢84 2936 10¢22 March 22 55 14
Ravenna (RA) 389,456 13 0¢03 510 1¢31 March 25 44 17
Reggio Emilia (RE) 531,891 70 0¢13 3167 5¢95 March 27 54 19
Rimini (RN) 339,017 113 0¢33 1575 4¢65 March 20 54 12
Italy 60,359,546 7375 0¢12 132,547 2¢20 721,732 (12¢0)
NA: not available, cases still increasing at April 6;.
a
Most recent data available from Italian National Institute of Statistic[43].
b
Lodi province, the one from which the Italian outbreak started, had already experienced its tight lockdown in a part of its territory (‘red zone’) on February 23, 2020 from which thefigure of 13 is computed, while the remainder of the territory implemented the lockdown on March 8, 2020.
6 M. Vinceti et al. / EClinicalMedicine 25 (2020) 100457
tight lockdown is not the only endpoint suitable to assess lockdown benefits. Another endpoint of interest would be the total number of infections occurring in a specific area. It is conceivable that a commu-nity might have a longer time to peak with fewer infections. Unfortu-nately, we lacked municipality-specific incidence data to assess this possibility in the only two provinces where there was differential tim-ing of the lockdown, in Lodi province (for the Codogno hot spot) and Padua province (for the hot spot within the tiny Vo municipality).
In conclusion, our study provides evidence that the intended effects of the mobility restrictions adopted in Italy to counteract spread of SARS-CoV-2 infection were generally seen within 14 to 18 days after the implementation of tight lockdown measures. In the areas having the highest prevalence of the infection, the effect was seen as early as 9 days, implying little lag between imposing decreased mobility and slowing person-to-person transmission. Declaration of Competing Interest
The authors have no conflict of interests to disclose. Funding
None
Author contributions
MV and TF designed the original study, and with KJR analyzed and interpreted the data, and wrote the manuscript. NO designed and carried out data analysis with TF. FF, AG and GM downloaded and processed cellphone movements. All authors read and approved the final manuscript.
Supplementary materials
Supplementary material associated with this article can be found in the online version at doi:10.1016/j.eclinm.2020.100457.
References
[1] WHO. Coronavirus disease (COVID-19) advice for the public, 2020.https://www. who.int/emergencies/diseases/novel-coronavirus-2019/advice-for-public
(accessed 12 June 2020).
[2]Kraemer MUG, Yang CH, Gutierrez B, et al. The effect of human mobility and control measures on the COVID-19 epidemic in China. Science 2020;368:493–7.
[3]Zhang J, Litvinova M, Liang Y, et al. Changes in contact patterns shape the dynam-ics of the COVID-19 outbreak in China. Science 2020;368:1481–6.
[4]Acuna-Zegarra MA, Santana-Cibrian M, Velasco-Hernandez JX. Modeling behav-ioral change and COVID-19 containment in Mexico: a trade-off between lock-down and compliance. Math Biosci 2020;325:108370.
[5] Ji T, Chen HL, Xu J, et al. Lockdown contained the spread of 2019 novel coronavi-rus disease in Huangshi city, China: early epidemiologicalfindings. Clin Infect Dis In press. doi:10.1093/cid/ciaa390.
[6]Lau H, Khosrawipour V, Kocbach P, et al. The positive impact of lockdown in Wuhan on containing the COVID-19 outbreak in China. J Travel Med 2020;27: taaa037.
[7]Pulla P. Covid-19: India imposes lockdown for 21 days and cases rise. BMJ 2020;368:m1251.
[8]Sjodin H, Wilder-Smith A, Osman S, Farooq Z, Rocklov J. Only strict quarantine measures can curb the coronavirus disease (COVID-19) outbreak in Italy, 2020. Eu Surveill 2020;25:2000280.
[9]Villela DAM. The value of mitigating epidemic peaks of COVID-19 for more effec-tive public health responses. Rev Soc Bras Med Trop 2020;53:e20200135.
[10]Iacobucci G. Covid-19: UK lockdown is "crucial" to saving lives, say doctors and scientists. BMJ 2020;368:m1204.
[11]Karnon J. A simple decision analysis of a mandatory lockdown response to the COVID-19 pandemic. Appl Health Econ Health Policy 2020;18:329–31.
[12]McKendry RA, Rees G, Cox IJ, et al. Share mobile and social-media data to curb COVID-19. Nature 2020;580:29.
[13]Mitja O, Arenas A, Rodo X, et al. Experts’request to the Spanish Government: move Spain towards complete lockdown. Lancet 2020;395:1193–4.
[14]Buckee CO, Balsari S, Chan J, et al. Aggregated mobility data could helpfight COVID-19. Science 2020;368:145–6.
[15]Sheikh A, Sheikh Z, Sheikh A. Novel approaches to estimate compliance with lock-down measures in the COVID-19 pandemic. J Glob Health 2020;10:010348.
[16] CPD. Italian civil protection department: COVID-19 data, 2020.https://github. com/pcm-dpc/COVID-19(accessed 12 June 2020).
[17] Ministry of Health. Official Italian statistics on SARS-CoV-2, March 8, 2020, 2020.
http://www.salute.gov.it/imgs/C_17_pagineAree_5351_0_file.pdf (accessed 12 June 2020).
[18] Italy. [Decreto-Legge 23 febbraio 2020, n. 6. Misure urgenti in materia di conteni-mento e gestione dell'emergenza epidemiologica da COVID-19. (20G00020) GU Serie Generale n.45 del 23-02-2020], 2020.https://www.gazzettaufficiale.it/eli/ id/2020/02/23/20G00020/sg(accessed 12 June 2020).
[19] Italy. [Decreto del Presidente del Consiglio dei Ministri 23 febbraio 2020. Disposi-zioni attuative del decreto-legge 23 febbraio 2020, n. 6, recante misure urgenti in materia di contenimento e gestione dell'emergenza epidemiologica da COVID-19. (20A01228) GU Serie Generale n.45 del 23-02-2020], 2020. https://www.gazzet-taufficiale.it/eli/id/2020/02/23/20A01228/sg(accessed 12 June 2020).
[20] Italy. [Decreto del Presidente del Consiglio dei Ministri 8 marzo 2020. Ulteriori dis-posizioni attuative del decreto-legge 23 febbraio 2020, n. 6, recante misure urgenti in materia di contenimento e gestione dell'emergenza epidemiologica da COVID-19. (20A01522) GU Serie Generale n.59 del 08-03-2020], 2020. https://www.gaz-zettaufficiale.it/eli/id/2020/03/08/20A01522/sg(accessed 12 June 2020). [21] Polzer G. [La mappa della nostra era glaciale: così il coronavirus ha congelato l’
Ita-lia]. Italy, 2020. https://lab.gedidigital.it/repubblica/2020/cronaca/coronavirus- mappa-italia-impatto-sulla-mobilita/?ref=RHPPLF-BH-I252606083-C8-P3-S1.8-T1(accessed 12 June 2020).
[22] Badr H.S., Du H., Marshall M., Dong E., Squire M., Gardner L.M.Social distancing is effective at mitigating COVID-19 transmission in the United States, 2020.https:// www.medrxiv.org/content/10.1101/2020.05.07.20092353v1.full.pdf(accessed 12 June 2020).
[23]Bartscher AK, Seitz S, Siegloch S, Slotwinski M, Wehrh€ofer N. Social capital and the spread of COVID-19: insights from European countries. IZA Discussion Papers 2020;13310:1–53.
Fig. 5.Days until the peak of the SARS-CoV-2 positive cases and percent reduction of
people movements for provinces within the three investigated regions (A); days until the peak of SARS-CoV-2 positive cases and SARS-CoV-2 infection prevalence on March 8, 2020 in the study provinces (B). Area of circles reflects total number of cases on April 6, 2020. Provinces without a peak within the study period (Pavia, Varese, Rovigo and Ferrara) and the province with a mixed lockdown (Lodi) were not included in the
[24] Italy. [Legge 20 novembre 2017, n. 167. Disposizioni per l'adempimento degli obblighi derivanti dall'appartenenza dell'Italia all'Unione Europea - Legge europea 2017. (17G00180) GU Serie Generale n.277 del 27-11-2017], 2017.
https://www.gazzettaufficiale.it/eli/id/2020/03/08/20A01522/sg (accessed 12 June 2020).
[25]Ienca M, Vayena E. On the responsible use of digital data to tackle the COVID-19 pandemic. Nat Med 2020;26:463–4.
[26] ISS. National surveillance system, 2020. https://www.epicentro.iss.it/en/corona-virus/sars-cov-2-national-surveillance-system(accessed 12 June 2020). [27] Italy. [Ordinanza 27 febbraio 2020. Ulteriori interventi urgenti di protezione civile
in relazione all'emergenza relativa al rischio sanitario connesso all'insorgenza di patologie derivanti da agenti virali trasmissibili. (Ordinanza n. 640). (20A01348) GU Serie Generale n.50 del 28-02-2020], 2020.https://www.gazzettaufficiale.it/ eli/id/2020/02/28/20A01348/sg(accessed 12 June 2020).
[28]Newey WK, West KD. A simple, positive semi-definite, heteroskedasticity and autocorrelation consistent covariance matrix. Econometrica 1987;55: 703–8.
[29]Bottai M, Orsini N. A command for Laplace regression. Stata J 2013;13:302–14.
[30] Wikipedia. List of countries by number of mobile phones in use, 2020.https://en. wikipedia.org/wiki/List_of_countries_by_number_of_mobile_phones_in_use
(accessed 12 June 2020).
[31] D'Elia C. [Coronavirus: non reagiva alle cure, così ho scoperto il paziente 1]. Italy, 2020. https://www.ilgiorno.it/lodi/cronaca/coronavirus-paziente-1-1.5067600
(accessed 12 June 2020).
[32]Lauer SA, Grantz KH, Bi Q, et al. The incubation period of Coronavirus disease 2019 (COVID-19) from publicly reported confirmed cases: estimation and appli-cation. Ann Intern Med 2020;172:577–82.
[33]Ye Q, Wang B, Mao J, et al. Epidemiological analysis of COVID-19 and practical experience from China. J Med Virol 2020;92:755–69.
[34] ISS. [Epidemia COVID-19 - Aggiornamento nazionale], 2020. https://www.epicen- tro.iss.it/coronavirus/bollettino/Bollettino-sorveglianza-integrata-COVID-19_6-aprile-2020.pdf(accessed 12 June 2020).
[35]Coccia M. Factors determining the diffusion of COVID-19 and suggested strategy to prevent future accelerated viral infectivity similar to COVID. Sci Total Environ 2020;729:138474.
[36]Domingo JL, Rovira J. Effects of air pollutants on the transmission and severity of respiratory viral infections. Environ Res 2020;187:109650.
[37]La Rosa G, Bonadonna L, Lucentini L, Kenmoe S, Suffredini E. Coronavirus in water environments: occurrence, persistence and concentration methods - a scoping review. Water Res 2020;179:115899.
[38]Chu DK, Akl EA, Duda S, et al. Physical distancing, face masks, and eye protection to prevent person-to-person transmission of SARS-CoV-2 and COVID-19: a sys-tematic review and meta-analysis. Lancet 2020;S0140-6736:31142–9.
[39]Kleinman RA, Merkel C. Digital contact tracing for COVID-19. CMAJ 2020;192: E653–6.
[40]Nussbaumer-Streit B, Mayr V, Dobrescu AI, et al. Quarantine alone or in combina-tion with other public health measures to control COVID-19: a rapid review. Cochrane Database Syst Rev 2020;4:CD013574.
[41]Tsatsakis A, Petrakis D, Nikolouzakis TK, et al. COVID-19, an opportunity to reeval-uate the correlation between long-term effects of anthropogenic pollutants on viral epidemic/pandemic events and prevalence. Food Chem Toxicol 2020;141:111418.
[42] Pasqualetto A. [Coronavirus, Crisanti: «Così ho violato le regole sui tamponi e ho fatto bene»]. Italy, 2020. https://www.corriere.it/cronache/20_giugno_01/corona- virus-crisanti-cosi-ho-violato-regole-tamponi-ho-fatto-bene-16713208-a36d-11ea-8193-03ffea7ed6db.shtml??(accessed 12 June 2020).
[43] ISTAT. Data from the Italian National Institute of Statistic, 2020.https://www. istat.it/it/popolazione-e-famiglie(accessed 12 June 2020).