Article (Published Version)
Boruah, Dibakor, Thakur, Pintu Kumar and Baruah, Dipal (2016) Artificial neural network based
modelling of internal combustion engine performance. International Journal of Engineering
Research & Technology (IJERT), 5 (3). pp. 568-576. ISSN 2278-0181
This version is available from Sussex Research Online: http://sro.sussex.ac.uk/60380/
This document is made available in accordance with publisher policies and may differ from the
published version or from the version of record. If you wish to cite this item you are advised to
consult the publisher’s version. Please see the URL above for details on accessing the published
version.
Copyright and reuse:
Sussex Research Online is a digital repository of the research output of the University.
Copyright and all moral rights to the version of the paper presented here belong to the individual
author(s) and/or other copyright owners. To the extent reasonable and practicable, the material
made available in SRO has been checked for eligibility before being made available.
Copies of full text items generally can be reproduced, displayed or performed and given to third
parties in any format or medium for personal research or study, educational, or not-for-profit
purposes without prior permission or charge, provided that the authors, title and full bibliographic
details are credited, a hyperlink and/or URL is given for the original metadata page and the
content is not changed in any way.
Internal Combustion Engine Performance
Dibakor Boruah
Department of Engineering and Design University of Sussex
Brighton, BN1 9TQ, UK
Pintu Kumar Thakur
Department of Mechanical Engineering GIMT - Tezpur
Tezpur, Assam : 784501, India
Dipal Baruah
Assistant Professor
Department of Mechanical Engineering GIMT -Tezpur
Tezpur, Assam : 784501, India
Abstract—The present study aims to quantify the applicability of artificial neural network as a black-box model for internal combustion engine performance. In consequence, an artificial neural network (ANN) based model for a four cylinder, four stroke internal combustion diesel engine has been developed on the basis of specific input and output factors, which have been taken from experimental readings for different load and engine speed circumstances. The input parameters that have been used to create the model are load, engine speed (RPM), fuel flow rate (FFR) & air flow rate (AFR); contrariwise the output parameters that have been used are brake power (BP), brake thermal efficiency (BTE), volumetric efficiency (VE), brake mean effective pressure (BMEP) and brake specific fuel consumption (BSFC). To begin with, databank has been alienated into training sets and testing sets. At that juncture, an ANN based model has been developed using training dataset which is based on standard back-propagation algorithm. Subsequently, performance and validation of the ANN based models have been measured by relating the predictions with the experimental results. Correspondingly, four different statistical functions have been used to examine the performance and reliability of the ANN based models. Moreover, Garson equation has been used to estimate the relative importance of the four different input variables towards their specific output. The results of the model suggests that, ANN based model is impressively successful to forecast the performance parameters of diesel engines for different input variables with a greater degree of accurateness and to evaluate relative impact of input variables.
Keywords— Artificial Neural Networks, Internal Combustion Engine, Engine Performance Parameters, Back Propagation Algorithm, Gradient Descent Algorithm, Architecture, Garson Equation, Modelling, Simulation, Validation and Relative Importance.
I. INTRODUCTION
Artificial neural network (ANN) is a very potent technique amongst black-box modelling methods which has been extensively used in numerous engineering applications [1]. Owing to exceedingly complex and nonlinear behaviour of internal combustion engine operations, artificial neural network is an apposite modelling technique to optimize several operating parameters and process simulation or prediction of different operating variables of internal combustion engine
[1-3]. This technique intends to significant diminution of experimental test requirements, cost, effort and time for the optimization and simulation of operating variables of engine thru generating mathematical models of the engine. Many scholars used artificial neural network with the intention of predicting power, torque, specific fuel consumption, air fuel ratio, soot formation with speed, injection pressure etc. [4-9], and it is manifest that the artificial neural network model offers greater degree of exactness and simplicity while analysing the performance of internal combustion engine [1]. The objectives of this study is to create ANN based models for the five different performance parameters of the engine (BP, BTE, VE, BMEP an BSFC) by using values from the same experimental database, to evaluate the performance of the ANN based model by using four standard statistical approaches and to compute relative importance of input variables (load, RPM, fuel flow rate & air flow rate) towards their respective performance parameters by using Garson equation.
II. METHODOLOGY A. Experimental setup
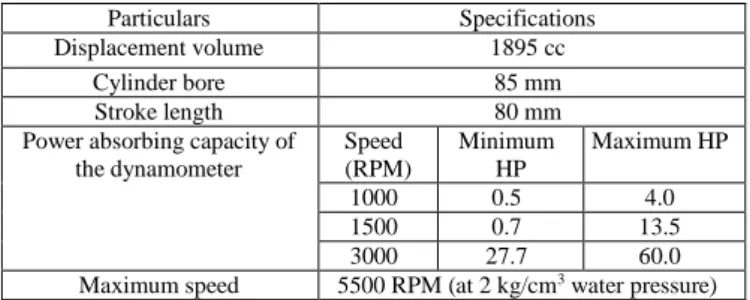
The internal combustion engine chosen to perform this research is a Mahindra & Mahindra make diesel engine. The engine is a four stroke, four cylinder, water cooled diesel engine. The engine is coupled to a hydraulic dynamometer. Technical specification of the engine is shown in the table 1.
TABLE 1: Basic technical specifications of the test engine Particulars Specifications Displacement volume 1895 cc
Cylinder bore 85 mm Stroke length 80 mm Power absorbing capacity of
the dynamometer Speed (RPM) Minimum HP Maximum HP 1000 0.5 4.0 1500 0.7 13.5 3000 27.7 60.0 Maximum speed 5500 RPM (at 2 kg/cm3 water pressure)
Artificial Neural Network based Modelling of
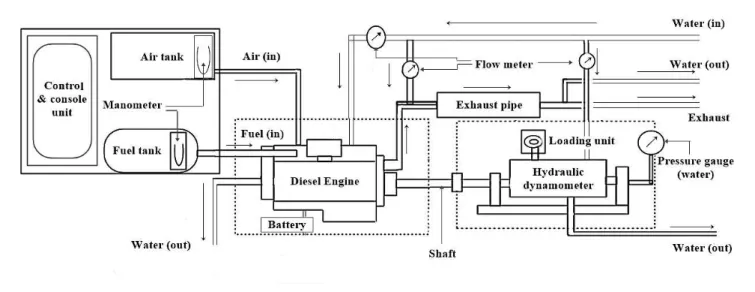
With the intention of assessing engine performance, the fuel consumption of the engine has been recorded together with speed and shaft load. The measuring arrangement of the engine testing rig has been provided so that all the essential engine performance parameters could be chronicled with minimal errors. Temperature and pressure of fluids, volume flow rate of fuel air and water are some of the elementary measurements that has been done during engine testing. The measuring devices viz. calorimeter, orificemeter, rotameter, fuel flow meter etc. have been provided with the standard test engine. A schematic illustration of the engine test rig is shown in the figure 1.
B. Artificial Neural Network
The conception of Artificial Neural Network (ANN) originates from Natural Neural Network i.e. from the principles of Biological Neurons. The biological nervous system comprises of a huge number of interrelated processing entities baptized neurons which are functioning in parallel. Hence, the human brain could be considered as an extremely complex, highly non-linear and enormously parallel supercomputer. An ANN is an architecture containing a huge quantity of neurons systematized in different layers and the neurons of one layer are linked to those of another layer of by dint of weights, and it can be prepared or trained to accomplish a specific duty via creating accurate alteration of its linking weights, bias and architecture [10, 11].
C. Development of artificial neural network model
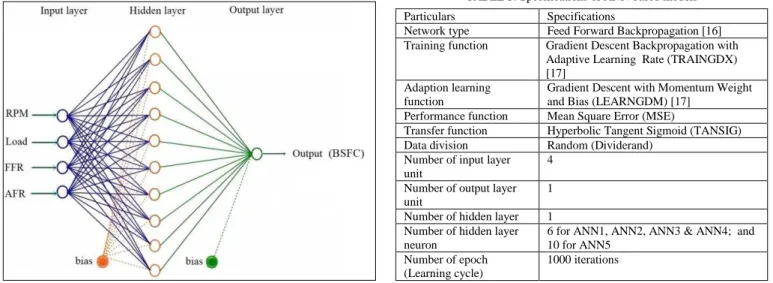
In this study, ANN based models have been developed in the MATLAB environment using the Neural Network toolbox. The proposed ANN model consist in five discrete ANNs, one for each output (BP, BTE, VE, BMEP and BSFC). Where, ANN1 is used to delineate BP, ANN2 is used to delineate BTE, ANN3 is used to delineate VE, ANN4 is used to delineate BMEP, and ANN5 is used to delineate BSFC. Each ANN has one input layer with four variables (Load, RPM, Fuel floe rate and Air flow rate), one hidden layer and one output.
Since there is no precise rule to determine the number of hidden layers and the number of neurons in the hidden layer. Therefore, the trial and error method has been applied to find the number of hidden layers and the number of neurons in the hidden layer. In order to decide the most appropriate or best solution a large number of different ANN models have been developed with different number of hidden layers and different number of neurons for each hidden layer. The optimum solution has been selected by minimalizing the Mean Square Error (MSE). The preeminent obtained results have been considered as one hidden layer with six neurons in hidden layer for ANN1, ANN2, ANN3 & ANN4, and one hidden layer with ten neurons in hidden layer for ANN5.
Figure 2 illustrates the architecture of the four ANNs models viz. ANN1, ANN2, ANN3 & ANN4 and figure 3 illustrates the architecture of the ANN5 model for the diesel engine of above mentioned specifications.
Fig. 1: Schematic layout of the engine testing rig
In order to check the sturdiness, validation and to predict the capability of the ANN based models, the database obtained from the experiment (1200 runs of the engine) have been divided into two parts as training (77%) and validation-testing (23%) sub-sets. In the present study, 928 data from the database have been selected for training and 272 data have been selected for validation-testing. Maximum and minimum values of input and output parameters are shown in the Table 2. Training and validation-test subsets have been arbitrarily chosen from the available database. Standard Back Propagation algorithm with Gradient Descent algorithm have been used for training of the chosen database to generate the ANN based models [12-15]. Detailed information of the each ANN model that has been established in the present study is shown in the Table 3.
TABLE 2: Ranges of parameters in the database
Particulars Minimum Maximum
Input parameters
Load (kg) 2.0 14.7
Engine speed (RPM) 812 2224 Air flow rate (kg/sec) 0.00226 0.00529 Fuel flow rate (kg/sec) 0.00021 0.00121
Output parameters
Brake power (kW) 0.67846 5.22453 Brake thermal efficiency (%) 10.48971 26.55620 Volumetric efficiency (%) 45.58345 67.51815 Brake mean effective pressure (kPa) 194.36793 1428.60431 Brake specific fuel consumption
(kg/kWhr)
0.30023 1.52608
After the accomplishment of training process with an optimum result, the inputs of testing database have been used for simulation i.e. to predict the corresponding outputs for each ANN model. Then and there, outputs of each ANN have been compared with target values obtained from experimental data in order to confirm the reliability of estimation or simulation. Afterwards, performance of the different ANNs have been measured statistically via Root mean square error (RMSE), Absolute fraction of variance (R2), Mean error percentage
(MEP)and Sum of square error (SSE).
TABLE 3: Specifications of ANN based models Particulars Specifications
Network type Feed Forward Backpropagation [16] Training function Gradient Descent Backpropagation with
Adaptive Learning Rate (TRAINGDX) [17]
Adaption learning function
Gradient Descent with Momentum Weight and Bias (LEARNGDM) [17]
Performance function Mean Square Error (MSE)
Transfer function Hyperbolic Tangent Sigmoid (TANSIG) Data division Random (Dividerand)
Number of input layer unit
4 Number of output layer unit
1 Number of hidden layer 1 Number of hidden layer neuron
6 for ANN1, ANN2, ANN3 & ANN4; and 10 for ANN5
Number of epoch (Learning cycle)
1000 iterations
D. Evaluation of statistical performance
In order to appraise the statistical performance of the ANN based models, four different statistical analysis have been done by means of different statistical approaches viz. RMSE, R2,
MEP and SSE. These statistical methods are often used to make comparisons. The RMSE denotes the standard deviation i.e. the difference between predicted results and experimental results, R2 designates how well the data fit in a mathematical model,
MEP is a measure of exactness of prediction of a simulation model, and the SSE represents the measure of the discrepancy between predicted values and target values [12, 13, 15, 18-20]. These values are determined by following equations –
RMSE = p ∑ |Tj − Oj| (1) R = 1 − (∑ T −O∑ O ) (2) MEP = ∑ T −O T × p (3) SSE = ∑ (�� �− ��) (4)
Where, p = Number of samples, Tj = Target value,
Oj = Output value
E. Relative importance index
Relative prominence of input variables have been weighed with the help of Garson equation which is based on neural net weight matrix. Garson proposed this equation in 1991 which is based on the partitioning of linking weights. Where, numerator represents the sums of absolute products of weights for each input, instead the denominator denotes the sum of all weights feeding into hidden entity, taking the absolute values. The Garson equation, adapted to the present ANNs topology is given below - [14, 21-24] I = ∑ (∑ |IW , | |IW , | =4 = ).|LW,| =n = ∑ {∑ ( |IW , | ∑=4= |IW , |).|LW,| =n = } =4 = (5)
Where, i = Input variables (= 4, since four number of input variables have been considered), j = Hidden layer neurons, Ii = Relative influence of the ith input variable on the
output variable, IWj,i = Weight to jth neuron of hidden layer
from ith input variable, LW
j,i = Weight to output layer from jth
neuron, n = 6 for ANN1, ANN2, ANN3 & ANN4; and 10 for ANN5.
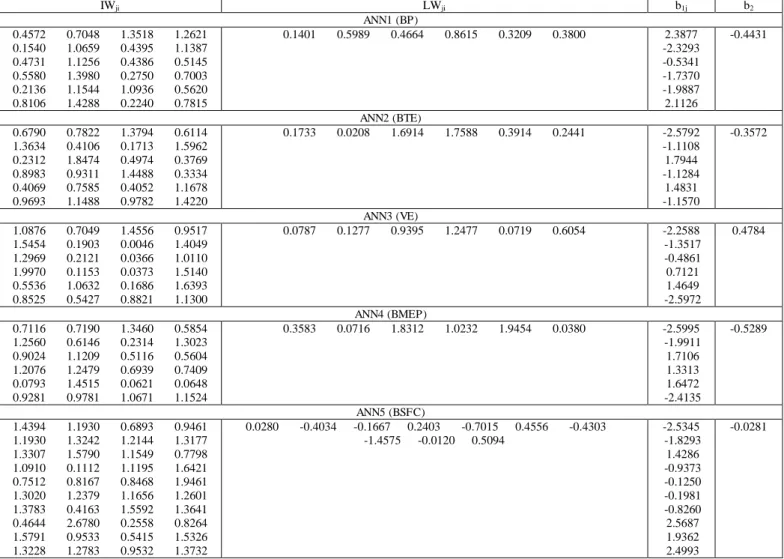
Table 4 shows the values that have been obtained for IWji,
LWji, b1j, and b2 (biases) during simulation for each ANN
created for five different engine performance parameters.
IWji LWji b1j b2 ANN1 (BP) 0.4572 0.7048 1.3518 1.2621 0.1540 1.0659 0.4395 1.1387 0.4731 1.1256 0.4386 0.5145 0.5580 1.3980 0.2750 0.7003 0.2136 1.1544 1.0936 0.5620 0.8106 1.4288 0.2240 0.7815 0.1401 0.5989 0.4664 0.8615 0.3209 0.3800 2.3877 -2.3293 -0.5341 -1.7370 -1.9887 2.1126 -0.4431 ANN2 (BTE) 0.6790 0.7822 1.3794 0.6114 1.3634 0.4106 0.1713 1.5962 0.2312 1.8474 0.4974 0.3769 0.8983 0.9311 1.4488 0.3334 0.4069 0.7585 0.4052 1.1678 0.9693 1.1488 0.9782 1.4220 0.1733 0.0208 1.6914 1.7588 0.3914 0.2441 -2.5792 -1.1108 1.7944 -1.1284 1.4831 -1.1570 -0.3572 ANN3 (VE) 1.0876 0.7049 1.4556 0.9517 1.5454 0.1903 0.0046 1.4049 1.2969 0.2121 0.0366 1.0110 1.9970 0.1153 0.0373 1.5140 0.5536 1.0632 0.1686 1.6393 0.8525 0.5427 0.8821 1.1300 0.0787 0.1277 0.9395 1.2477 0.0719 0.6054 -2.2588 -1.3517 -0.4861 0.7121 1.4649 -2.5972 0.4784 ANN4 (BMEP) 0.7116 0.7190 1.3460 0.5854 1.2560 0.6146 0.2314 1.3023 0.9024 1.1209 0.5116 0.5604 1.2076 1.2479 0.6939 0.7409 0.0793 1.4515 0.0621 0.0648 0.9281 0.9781 1.0671 1.1524 0.3583 0.0716 1.8312 1.0232 1.9454 0.0380 -2.5995 -1.9911 1.7106 1.3313 1.6472 -2.4135 -0.5289 ANN5 (BSFC) 1.4394 1.1930 0.6893 0.9461 1.1930 1.3242 1.2144 1.3177 1.3307 1.5790 1.1549 0.7798 1.0910 0.1112 1.1195 1.6421 0.7512 0.8167 0.8468 1.9461 1.3020 1.2379 1.1656 1.2601 1.3783 0.4163 1.5592 1.3641 0.4644 2.6780 0.2558 0.8264 1.5791 0.9533 0.5415 1.5326 1.3228 1.2783 0.9532 1.3732 0.0280 -0.4034 -0.1667 0.2403 -0.7015 0.4556 -0.4303 -1.4575 -0.0120 0.5094 -2.5345 -1.8293 1.4286 -0.9373 -0.1250 -0.1981 -0.8260 2.5687 1.9362 2.4993 -0.0281
III. RESULTS AND DISCUSSION
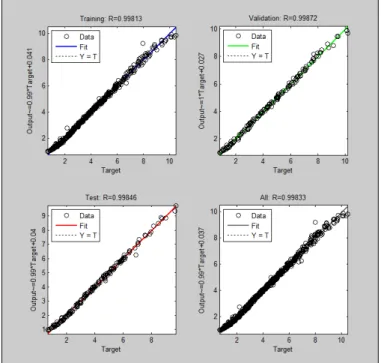
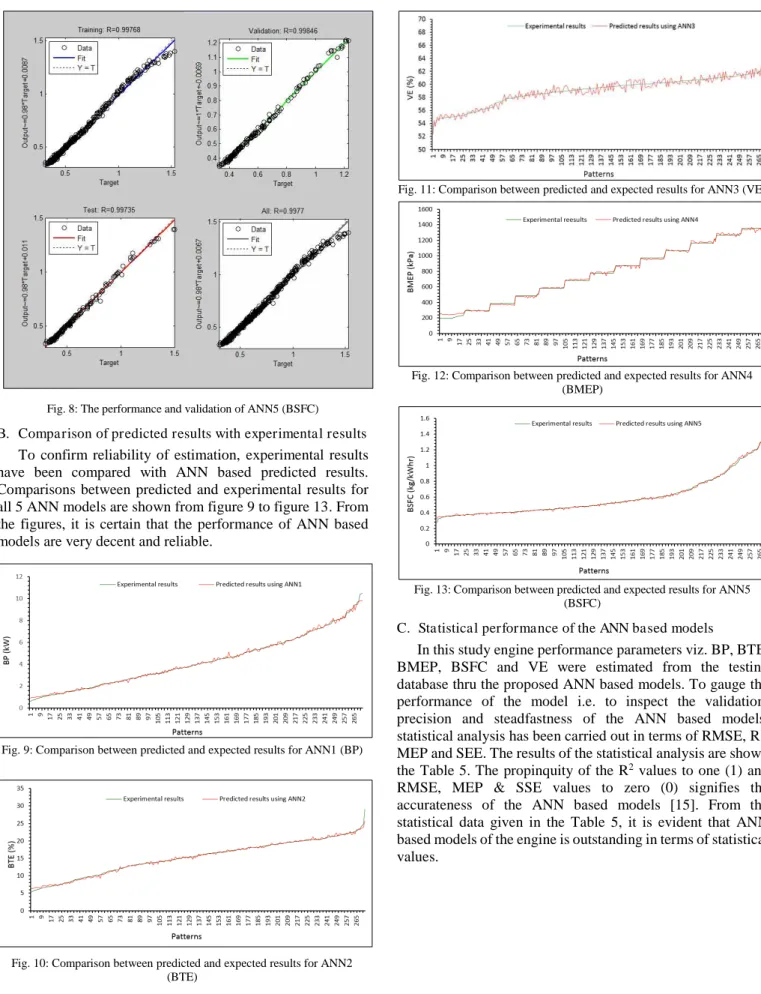
A. Performance and validation of ANN based models In the present study, during the training of database or network using Neural Network toolbox in MATLAB environs, the MSE drops rapidly while learning by using LEARNGDX algorithm. The green line in the figures (figure 4 to figure 8) shows the validation error. The training of database stops when validation error stops diminishing and finally we get the
optimal results. The blue line indicates the error in the training data and the red line explains the error in the test data, where regression coefficients (R) values are higher than 0.99. It reflects that the all ANN based models, containing five ANNs shows quite satisfactory and acceptable performance. This promises that the ANNs model of the engine is accurate, valid and dependable.
Fig. 4: The performance and validation of ANN1 (BP)
Fig. 5: The performance and validation of ANN2 (BTE)
Fig. 6: The performance and validation of ANN3 (VE)
Fig. 8: The performance and validation of ANN5 (BSFC)
B. Comparison of predicted results with experimental results To confirm reliability of estimation, experimental results have been compared with ANN based predicted results. Comparisons between predicted and experimental results for all 5 ANN models are shown from figure 9 to figure 13. From the figures, it is certain that the performance of ANN based models are very decent and reliable.
Fig. 9: Comparison between predicted and expected results for ANN1 (BP)
Fig. 10: Comparison between predicted and expected results for ANN2 (BTE)
Fig. 11: Comparison between predicted and expected results for ANN3 (VE)
Fig. 12: Comparison between predicted and expected results for ANN4 (BMEP)
Fig. 13: Comparison between predicted and expected results for ANN5 (BSFC)
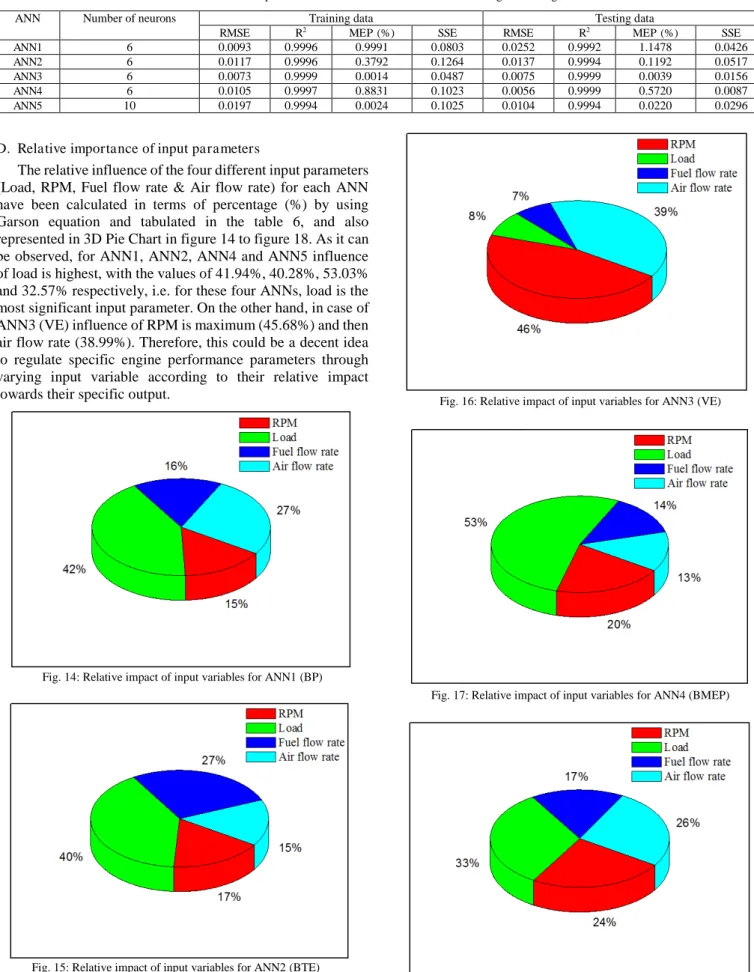
C. Statistical performance of the ANN based models
In this study engine performance parameters viz. BP, BTE, BMEP, BSFC and VE were estimated from the testing database thru the proposed ANN based models. To gauge the performance of the model i.e. to inspect the validation, precision and steadfastness of the ANN based models, statistical analysis has been carried out in terms of RMSE, R2,
MEP and SEE. The results of the statistical analysis are shown the Table 5. The propinquity of the R2 values to one (1) and
RMSE, MEP & SSE values to zero (0) signifies the accurateness of the ANN based models [15]. From the statistical data given in the Table 5, it is evident that ANN based models of the engine is outstanding in terms of statistical values.
TABLE 5: Statistical parameters of the ANN based models for training and testing database
ANN Number of neurons Training data Testing data
RMSE R2 MEP (%) SSE RMSE R2 MEP (%) SSE
ANN1 6 0.0093 0.9996 0.9991 0.0803 0.0252 0.9992 1.1478 0.0426
ANN2 6 0.0117 0.9996 0.3792 0.1264 0.0137 0.9994 0.1192 0.0517
ANN3 6 0.0073 0.9999 0.0014 0.0487 0.0075 0.9999 0.0039 0.0156
ANN4 6 0.0105 0.9997 0.8831 0.1023 0.0056 0.9999 0.5720 0.0087
ANN5 10 0.0197 0.9994 0.0024 0.1025 0.0104 0.9994 0.0220 0.0296
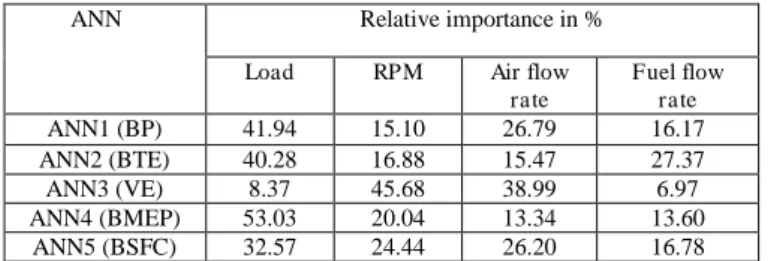
D. Relative importance of input parameters
The relative influence of the four different input parameters (Load, RPM, Fuel flow rate & Air flow rate) for each ANN have been calculated in terms of percentage (%) by using Garson equation and tabulated in the table 6, and also represented in 3D Pie Chart in figure 14 to figure 18. As it can be observed, for ANN1, ANN2, ANN4 and ANN5 influence of load is highest, with the values of 41.94%, 40.28%, 53.03% and 32.57% respectively, i.e. for these four ANNs, load is the most significant input parameter. On the other hand, in case of ANN3 (VE) influence of RPM is maximum (45.68%) and then air flow rate (38.99%). Therefore, this could be a decent idea to regulate specific engine performance parameters through varying input variable according to their relative impact towards their specific output.
Fig. 14: Relative impact of input variables for ANN1 (BP)
Fig. 15: Relative impact of input variables for ANN2 (BTE)
Fig. 16: Relative impact of input variables for ANN3 (VE)
Fig. 17: Relative impact of input variables for ANN4 (BMEP)
TABLE 6: Relative Importance of input variables
In contrast, the comparative importance of input variables with respect to their respective output can be expressed in decreasing order of importance as follows:
BP (ANN1) = Load > Air flow rate > Fuel flow rate > RPM BTE (ANN2) = Load > Fuel flow rate >RPM >Air flow rate VE (ANN3) = RPM > Air flow rate > Load > Fuel flow rate BMEP (ANN4) = Load > RPM > Fuel flow rate > Air flow rate BSFC (ANN5) = Load > Air flow rate > RPM > Fuel flow rate
IV. SUMMARY AND CONCLUSIONS
The key intension of our current study is the comprehensive investigation and analysis of applicability of the Artificial Neural Network to predict internal combustion engine performance and to evaluate relative importance of input variables. In order to assess the effectiveness and consistency of ANN based model of IC engine, primarily database (containing input and output parameters) have been trained using the Back Propagation Algorithm for apiece output parameters independently. Then, each output parameters from their respective ANN have been estimated. Afterwards, performance of ANN based models have been determined statistically with the help of four different statistical tests (RMSE, R2, MEP & SEE), which delivers adequate results. It
is found that R2 values are higher than 0.999, RMSE values are
smaller than 0.0252, MEP values are smaller than 1.1478%, and SSE values are smaller than 0.0517 for testing database of all five ANNs. Line Charts have been also used to compare the expected results and predicted results and it is observed that all five ANNs are very accurate and robust. Also, relative influence (in %) of each input variables for each ANN have been evaluated by using Garson equation, which could be quite helpful to adjust specific engine performance parameters by regulating the input variable according to their respective impact.
The aftermath of this study is that, proposed ANN based models of the engine are decidedly fruitful to forecast performance parameters of diesel engines for diverse input variables with a higher degree of exactitude and to evaluate relative impact of input variables. These are inexpensive and untedious models to estimate engine performance and to predict relative importance of parameters. By using ANN based model of internal combustion engine one can certainly and accurately predict engine performance parameters as well as estimate the relative influence of input variables without full experimental studies. Therefore, Artificial Neural Network based model of internal combustion engine is one of the most unswerving, resilient and efficient model with a reduced amount of exertion, time and money.
ACKNOWLEDGEMENTS
We would like to offer our warm regards and humble thanks to Girijananda Chowdhury Institute of Management and Technology (GIMT), Tezpur affiliated to Gauhati University and Assam Science and Technology University for allowing us to perform the entire study.
REFERENCES
[1] Zweiri, Y. H. (2006), Diesel Engine Indicated Torque Estimation Based on Artificial Neural Networks, International Journal of Intelligent Technology, Vol. 2. No. 2, pp. 233-239. [2] Alonso, J. M., Alvarruiz, F., Desantes, J. M., Hernández, L., Hernández, V. and Moltó, G. (2007), Combining Neural Networks and Genetic Algorithms to Predict and Reduce Diesel Engine Emissions, IEEE Transactions on Evolutionary Computation, Vol.11, No. 1, pp.46-55.
[3] Desantes, J. M.; Lopez, J. J.; Garcia, J. M. and Hernandez, L. (2002), Application of Neural Networks for Prediction and Optimization of Exhaust Emissions in a H.D. Diesel Engine, SAE Technical Paper No. 01-1144.
[4] Sekmen Y. , Gölcü M. , Erduranlı P., Pancar Y. (2006), Prediction of Performance and Smoke Emission using Artificial Neural Network in a Diesel Engine , Mathematical and computational application, Association for scientific research, Vol.11,3; 205-214
[5] Gholamhassan N., Barat G., Talal Y., Hadi R.(2007), Combustion Analysis of a CI Engine Performance using Waste Cooking Biodiesel Fuel with an Artificial Neural Network Aid, American Journal of Applied Sciences 4 (10): 756-764.
[6] Ghobadian B., Rahimi H., Nikbakht A.M., Najafi G. and Yusaf T.F. (2009), Diesel Engine Performance and Exhaust Emission Analysis using Waste Cooking Biodiesel Fuel with an Artificial Neural Network, Renewable Energy, 34 (4). Pp.976-982.
[7] Tutuncu K. and Allahverdi N. (2009), Modeling the Performance and Emission Characteristics of Diesel Engine and Petrol- Driven Engine by ANN. International Conference
on Computer Systems and Technologies, CompSysTech’09.
[8] Wu B., Zoran F., Denise M. K, Gregory L. Ohl, Michael J. Prucka and Eugene Di Valentin (2004) Using Artificial Neural Networks for Representing the Air Flow Rate through a 2.4 Liter VVT Engine, SAE international 2004- 01-3054, Powertrain & Fluid Systems Conference and Exhibition Tampa, Florida USA October 25-28, 2004
[9] Gisca V, Mereacre A. and Pisarenco M., (2004) Utilization of Neural Networks for Observing the Internal Combustion
Engine’s Function, 7th International Conference on Development and Application Systems, Suceava, Romania, May 27-29.
[10] Kumar, P. D. (2005), Soft Computing, Narosa Publishing House, ISBN 978-81-7319-866-3
[11] Garg, A. B., Diwan, P., Saxena, M. (2012), Artificial Neural Networks based Methodologies for Optimization of Engine Operations, International Journal of Scientific & Engineering Research, Volume 3, Issue 5, ISSN 2229-5518
[12] Yusuf, C. (2013), Prediction of a Gasoline Engine Performance with Artificial Neural Network, Elsevier, Fuel 111 324–331
ANN Relative importance in %
Load RPM Air flow
rate Fuel flow rate ANN1 (BP) 41.94 15.10 26.79 16.17 ANN2 (BTE) 40.28 16.88 15.47 27.37 ANN3 (VE) 8.37 45.68 38.99 6.97 ANN4 (BMEP) 53.03 20.04 13.34 13.60 ANN5 (BSFC) 32.57 24.44 26.20 16.78
[13]Garg, A. B., Diwan, P., Saxena, M. (2014), Artificial Neural Networks for Internal Combustion Engine Performance and Emission, Analysis International Journal of Computer Applications (0975 – 8887) Volume 87 – No.6.
[14]Puig-Arnavat, M., Herna´ndez, J. A., Bruno, J. C., Coronas, A. (2013), Artificial Neural Network Models for Biomass Gasification in Fluidized Bed Gasifiers, Elsevier, Biomass and Bioenergy 49 279e289
[15]Uzun, A. (1014), Air Mass Flow Estimation of Diesel Engines using Neural Network, Elsevier, Fuel 117 833–838
[16]Deng, et al. (2011), The Applications of Artificial Neural Networks to Engines, Artificial Neural Networks - Industrial and Control Engineering Applications, ISBN 978-953-307-220-3 [17]Gopalakrishnan, K. (2003), Effect of Training Algorithms on
Neural Networks Aided Pavement Diagnosis, International Journal of Engineering Science and Technology, Vol. 2, No. 2, pp. 83-92
[18]Arcaklioglu E. (2004), Performance comparison of CFCs with their substitutes using artificial neural network, Int J Energy Res;28:1113–25.
[19] Sozen A, Arcaklioglu E, Ozalp M, Caglar N. (2005), Forecasting based on neural network approach of solar potential in Turkey. Renew Energy; 30:1075–90.
[20] Sozen A, Arcaklioglu E, Ozkaymak M. (2005), Turkey’s net energy consumption. Appl Energy; 81:209–21
[21] Hamzaoui, Y., Hernandez, J.A., Silva-Martinez, S., Bassam, A., Alvarez, A., Lizama-Bahena, C. (2011), Optimal performance of COD removal during aqueous treatment of alazine and gesaprim commercial herbicides by direct and inverse neural network. Desalination; 227(1e3):325e37. [22] Garson, G.D. (1991), Interpreting neural-network connection
weights, AI Expert; 6:47e51.
[23] Khataee, A.R., Mirzajani, O. (2010), UV/peroxydisulfate oxidation of C.I. Basic Blue 3: modeling of key factors by artificial neural network. Desalination; 251(1e3):64e9 [24] Nemati, S., Naghipour, L., Fard, M. H. F. (2014), Artificial
Neural Network Modeling of Total Dissolved Solid in the Simineh River, Iran, Journal of Civil Engineering and Urbanism Volume 4, Issue 1: 08-14, ISSN-2252-0430