Áslaug Eiríksdóttir
Master of Science
Computer Science
June 2014
School of Computer Science
Reykjavík University
M.Sc. PROJECT REPORT
Project report submitted to the School of Computer Science
at Reykjavík University in partial fulfillment of
the requirements for the degree of
Master of Science
in
Computer Science
June 2014
Project Report Committee:
Yngvi Björnsson, Supervisor
Professor, Reykjavik University
Björn Þór Jónsson
Associate Professor, Reykjavik University
Marta Kristín Lárusdóttir
Assistant Professor, Reykjavik University
Hlynur Sigurþórsson, MSc
Date
Yngvi Björnsson, Supervisor
Professor, Reykjavik University
Björn Þór Jónsson
Associate Professor, Reykjavik University
Marta Kristín Lárusdóttir
Assistant Professor, Reykjavik University
Hlynur Sigurþórsson, MSc
Senior Developer, Azazo
Date
Áslaug Eiríksdóttir
Master of Science
Adoption Process Seen Through System Logs
and to lend or sell such
copies for private, scholarly or scientific research purposes only.
The author reserves all other publication and other rights in association with
the copyright in the project report, and except as herein before provided,
nei-ther the project report nor any substantial portion nei-thereof may be printed or
otherwise reproduced in any material form whatsoever without the author’s
prior written permission.
Abstract
Selling Software-as-a-Service increases the need for continuously
monitor-ing customer service level and system usage overview. Such monitormonitor-ing in
large scale enterprise environment needs to be scalable, and thus we need an
alternative to human resource demanding qualitative user methods.
As a step on the way to such monitoring, our goal is to create models that
provide metrics for comparison and evaluation of enterprise customers
dur-ing the period immediately followdur-ing software integration, to be used by
enterprise software vendors.
We use real data as a basis of our analysis; anonymised audit logs from the
CoreData Enterprise Content Management software. We perform descriptive
analysis based on statistical analysis and predictive analysis using machine
learning methods. The results are a series of metrics that can be used to
un-derstand customer composition, system usage and behavior during the period
after implementation, the adoption period. We conclude that the audit logs
can be used for such analysis.
Áslaug Eiríksdóttir
Júní 2014
Útdráttur
Áskriftarsala á hugbúnaði (SaaS) er vaxandi innan hugbúnaðargeirans og
hvetur söluaðila hugbúnaðar til að fylgjast með kerfisnotkun og ánægju
viðskip-tavina til að rækta viðskiptasambandið. Þó notendarannsóknir á ánægju séu
mikið stundaðar með eigindlegum rannsóknaraðferðum, henta slíkar aðferðir
síður til að gefa yfirsýn yfir kerfisnotkun þegar um er að ræða svo stór þýði
þar sem krafa um sjálfvirka vöktun er mikil.
Við mótum megindlegar rannsóknaraðferðir til að veita innsýn í kerfisnotkun
hjá fyrirtækjaviðskiptavinum hugbúnaðarkerfa. Tölfræðilegum aðferðum er
beitt til að móta matsaðferðir á kerfisnotkun fyrirtækjaviðskiptavina sem
ný-tast við samanburð og mat á notkuninni. Einnig beitum við aðferðum úr
vélrænu gagnanámi til að móta mælingar sem hafa forspárgildi um hversu
virkur viðskiptavinurinn er í framhaldinu. Sérstaklega er horft til tímabilsins
eftir innleiðingu hugbúnaðarins, það er meðan hugbúnaðurinn er að öðlast
sess sem hluti af vinnuumhverfi starfsmanna.
Við notum raungögn við mótun matsaðferðanna, nánar tiltekið kerfisatvikaskrá
(e. audit logs) frá Azazo / Gagnavörslunni ehf. Við ályktum að kerfisatvikaskrá
geti nýst við úrvinnslu af þessu tagi.
Acknowledgements
I wish to thank my supervisor, Yngvi Björnsson for all his encouragement and support. It has been a privilege to work with him.
Azazo has provided me with the data and support invaluable to this project. Having real data to work with has made this possible in the first place, and for that I am very grateful. In addition to a great working environment and pleasant company, their interest in my results has been inspiring. The cooperation has been very enjoyable, and has enabled me to strike a balance between academia and industry, making the most of each.
Contents
List of Figures xi
List of Tables xii
1 Introduction 1
2 Background 3
2.1 Azazo and CoreData ECM . . . 3
2.1.1 Azazo . . . 3
2.1.2 CoreData ECM . . . 4
2.2 The Integration and Adoption Periods . . . 4
2.3 Terminology . . . 5
2.4 Methodology . . . 6
2.5 Summary . . . 7
3 Business and Data Understanding 9 3.1 Business Understanding . . . 9
3.2 Data Understanding . . . 10
3.3 Summary . . . 12
4 Data Preprocessing 13 4.1 The Data . . . 13
4.1.1 The Set of Customers . . . 13
4.1.2 Log Data . . . 14
4.1.3 Log Data Preprocessing . . . 14
4.1.4 Metadata . . . 16
4.2 Summary . . . 18
5 Data Analysis 19 5.1 Overall Goal . . . 19
5.2 Descriptive Analysis . . . 20
5.2.1 Seven-Day Active Users Metric . . . 20
5.2.2 Adoption Metric . . . 21
5.2.3 Retention . . . 22
5.2.4 Engagement . . . 24
5.2.5 Desktop Users . . . 25
5.3 Usage Example: Profiles of Customers . . . 26
5.3.1 Company Z . . . 26
5.3.2 Company T . . . 28
5.3.3 Customer Analysis Summary . . . 29
5.4 Predictive Analysis . . . 29
5.4.1 Weka . . . 29
5.4.2 Classification . . . 29
5.5 Summary . . . 31
6 Discussion 33 6.1 Vendor Value - From Audit Logs to Information . . . 33
6.2 Further Data Mining . . . 34
6.3 Further Additions . . . 34
6.3.1 More Detailed User Studies . . . 35
6.3.2 User Type Analysis . . . 35
6.3.3 Persistence Metric . . . 35
6.3.4 Engagement Reversed . . . 36
6.4 Summary . . . 36
7 Related Work 37 7.1 Academic Approaches . . . 37
7.1.1 Qualitative User Studies . . . 37
7.1.2 Quantitative User Studies . . . 38
7.2 Industry Work . . . 38
7.3 Summary . . . 39
8 Conclusions 41
List of Figures
2.1 CRISP-DM Process Diagram . . . 6
5.1 Examples of seven day active users count . . . 20
5.2 Adoption curves . . . 22
5.3 Retention . . . 23
5.4 User Engagement . . . 24
5.5 Comparing two customers through metrics . . . 27
5.6 Decision Tree . . . 30
List of Tables
3.1 Logs . . . 11
4.1 Customers . . . 17
Chapter 1
Introduction
In recent years, Software-as-a-Service has become an increasingly popular business model for software. The service follows a subscription model where customers pay for a month at a time. When customers can stop their commitment on short notice, holding on to the customers becomes an ongoing effort throughout the software lifetime. It is therefore of increasing importance that software vendors monitor customer satisfaction continuously, which is traditionally achieved using qualitative research methods. However, as the cus-tomer base grows, qualitative methods suffer from bad scalability, which increases the need for automatic ways to monitor system usage to uncover usage problems.
Maintaining customer contact in enterprise software has the added complication of the vendor not having a direct means of communications to every user. Instead, a contact person from the customer company serves as an intermediary and thus not all opinion is necessary conveyed to the vendor.
With this in mind, it becomes apparent that a way to automatically monitor the usage patterns and being able to use the results to evaluate to which extent the customer is likely to stop using the software in the near future, is highly desirable. As a step on the way towards that ultimate goal, we want to study the adoption process of enterprise customers, in order to develop metrics that can be further refined. We focus on the initial period of software usage, theadoption period, as that is a critical point in the customer lifecycle where the human contact between vendor and customer has just recently ceased.
In modern software enterprises it is common that extensive amounts of logging data is being accumulated over time. The most common usage of logs is for system monitoring, e.g. seeing when there are spikes in usage, reviewing usage when there is doubt concern-ing edits, and other similar system-related reasons. However, with the advent of increased computing power and more sophisticated data analytic tools it has also become possible
to use such low-level data logs to perform tasks such as modeling user preferences or detecting complex patterns, trends, and anomalies in the system usage.
The goal of this study is to understand to which extent rudimentary system log data can be used to monitor, evaluate, and predict the success of the adoption of a software-as-a-service product. More specifically, we analyze system logs generated by the CoreData ECM enterprise management system over a seventeen week period when customers first start to use the system unassisted. The system logs contain only crude information about the system usage, such as user log-ins and document accesses.
Our results show that one can gain an overview of how well the adoption process is going through carefully chosen descriptive metrics, which is evaluated through machine learning to enable predictive analysis. In addition, the metrics present information on quantifiable aspects of usage that are a good supplement to qualitative evaluations. Moreover, warning signs start to be detected early on in the adoption period, thus allowing the software vendor to potentially intervene if judged necessary.
The structure of this thesis is as follows: In the next chapter we cover necessary back-ground material, including the data-mining methodology we follow. The next three chap-ters describe the different phases of the data-mining process as they apply to our task, that is, business- and data-understanding, data preprocessing, and data analysis and modeling, respectively. This is followed by a general discussion chapter summarizing our findings and giving outlook on future work. Finally, we describe related work before conclud-ing.
Chapter 2
Background
This chapter gives an overview of the case for this study, the software and the software vendor. We also clarify the terminology used throughout the thesis as well as outline the methodology applied in this study.
2.1
Azazo and CoreData ECM
The software system whose data we use for this study, Coredata ECM, is developed by Azazo.
2.1.1
Azazo
Azazo is a knowledge and software development company offering consultation services, storage and software solutions for records management and data storage, both in physical and digital formats. Established by CEO Brynja Guðmundsdóttir in 2007 as Gagnavarslan ehf, Azazo has grown to just short of 40 employees in seven years. The primary software product of the company is CoreData ECM (Enterprise Content Management), which is intended for company-wide project and document management in companies of various sizes.
The company has also developed several other software products.CoreData Board Meet-ing manages board meeting related documents, offering digital signatures and thus en-abling paper-free meeting management. CoreData Claims is specifically tailored to the needs of bankruptcy estates, and throughCoreData VirtualDataroom, selected data from any of these solutions can be shared with people that are not within the company.
2.1.2
CoreData ECM
In this study, we will look only at the software solution that has the biggest customer base, i.e., CoreData ECM. As a content management system, it can be used to save and share documents, handle internal and external correspondence and administer projects and collaborations.
The CoreData ECM software can be used through a web interface from any platform, and additionally a desktop client is available for the Windows operating system.
2.2
The Integration and Adoption Periods
When a new company becomes a customer of CoreData ECM, a period of integration
begins, where Azazo project managers and the customer’s contact person(s) work together towards setting the system up for use at the customer company. During this time, data from other systems is migrated into CoreData ECM, and if the customer has any special requirements software modifications will happen during this period. This is a period where there is much contact between Azazo staff and customer staff.
The integration process differs between customers and can take anywhere from three to thirty weeks, but the observed average is sixteen weeks. When everything has been set up, a course is typically held at the customer company, where regular staff members that are expected to use the system on a regular basis are trained on its usage.
We are interested in what happens during the period immediately following this course, which we henceforth refer to as theadoption period.
Monitoring the usage during adoption serves the purpose of facilitating and ensuring suc-cess in the period following integration. If the adoption prosuc-cess is slow or takes a bad turn, it is important to be able to intervene in an appropriate manner. During this period, the close contact between software vendor and enterprise buyer maintained in the inte-gration period has ceased and is reduced to support-related communication. Currently the software vendor has no formal or automatic tools in place to measure or evaluate the usage patterns during this period.
Our goal in this study is to gain insight into whether, and then how, autogenerated logs of usage data from CoreData ECM (and enterprise software systems in general) can be used to monitor and predict success during the adoption period. We perform data analysis on the logs to describe system usage during the adoption period. We use human evaluation
For clarity, this section defines the terms used throughout the thesis.
System When referring to the CoreData ECM software system, system is used for short.
Customer / company From the reference point of Azazo, each company that subscribes to the system is a customer. A customer has many individual end users. We use the termscustomerandcompanyinterchangeably.
User Any individual end-user of the CoreData ECM software. Every customer also has automated system process users that perform routine computational tasks, such as indexing. Those administrative tasks do not represent day to day user usage of the system, but rather are important to system maintenance. For the purpose of this study, we are only interested in human users. Administrative and system users have therefore been excluded in our analysis.
Integration The period after a software is purchased and before it is put to general use within the enterprise customer. During this time, any customization is implemented on the customer instance. Any data migration (moving data from the old system(s) into CoreData ECM) is also done during this period.
Adoption The degree to which the software is taken into regular use by the individual users at the customer company.
Rank / Classes The customer companies were evaluated by Azazo staff and ranked in five categories. These categories are the base of the classes of our analysis.
Audit Logs We use the term audit logs to refer to raw and simple data that are likely to be available in the logs of most software vendors, such as user identification, action type, timestamp, and sometimes document_id. Chapter 3 contains a detailed description of the logs we use.
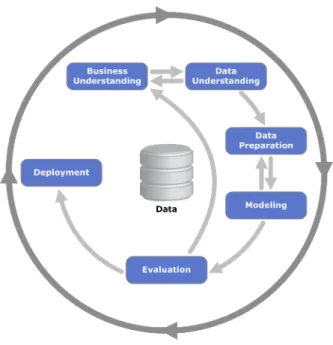
Figure 2.1: CRISP-DM Process Diagram.
Image from http://upload.wikimedia.org/wikipedia/commons/b/b9/CRISP-DM_Process_Diagram.png
2.4
Methodology
In our data analytics process we follow theCross Industry Standard Model for Data Min-ing (CRISP-DM)(Chapman et al., 2000). The model is widely used in the field of Data Mining, and presents a relation between all the phases that were necessary for this study. This model outlines six phases of processing, which are not necessarily traversed linearly. Figure 2.1 gives an overview of the model, with the arrows indicating transitions between phases. As seen in the model, these transitions can be highly iterative.
The initial phase isBusiness Understanding, where the focus is on translating business needs into a data mining problem. Closely related to this is Data Understanding, get-ting to know the available data, discovering first insights into the data and identifying data quality problems. From there, the process flow moves toData Preparation, where the dataset is shaped through selecting and cleaning data, merging data from different sources as well as format the data to fit the intended processing. DuringModellingthe appropriate analytics methods are applied to the data in order to answer business require-ments. This is where the actual analysis is shaped. DuringEvaluation, the preliminary results are evaluated and the models reviewed or approved. If more refinement is desired, another iteration through the process might be needed, but if the models fit the require-ments of the business needs, they are deployed and documented during the final phase,
2.5
Summary
In this chapter we covered essential background material, including the business setting and the terminology used throughout the thesis. We also gave an overview of the data-mining methodology we follow.
The following chapters in the thesis each covers one or more phases described by this model as they apply to our CoreData ECM data mining task.
Chapter 3
Business and Data Understanding
This chapter outlines the business environment of the software vendor and provides in-sight into the data used in this study. The work described corresponds to the Business-and Data-UnderstBusiness-anding phases of the CRISP-DM process.
3.1
Business Understanding
In Business-to-Business Software environment, some added complications in user moni-toring arise.
The business case of this study is a software vendor of enterprise software. As such, their marketing is directed to decision-making staff of prospective customers, as a decision on whether a software solution should be used is taken on a managerial level. It is a company-wide decision and is greatly based on the needs and goals of the organization, rather than just ease of use for individual workers. The decision makers are not necessarily (and probably not) the most active users. Using the software on a day to day basis is in the hands of all staff members, maybe even mostly by people who work "on the floor", with little or no managerial or reporting responsibilities.
When consumer users are dissatisfied with the software they have chosen for themselves, they are free to stop using it and can switch to other solutions if they choose to. Employees in companies do not have such decision power towards enterprise software, and even if they do, the cost of changing software in enterprise environment is much higher than that of consumer users. Unhappy enterprise users, however, may get tempted to stop using the software (e.g., omitting inputting relevant data), which in turn means that the intended efficiency and usefulness of the software is reduced. Also, reporting and managerial usage
becomes less reliable, in the worst case even resulting in the company investment in the software being wasted. It is therefore in the buyers’/managers’ interest that the users adopt the software into their daily work routines in a successful and positive process, and that effective usage continues to yield the intended effect of investing in the software. Both the client company and the software vendor benefit from the adaption process being as positive and effective as possible.
For an enterprise software vendor like Azazo there are a number of challenges related to evaluating the success of an adoption process. The most natural contact link between vendor and customer consists of an Azazo-consultant and a contact person within the customer company. This contact is riddled with external influence that can complicate evaluation. Firstly, a single contact person can not possibly monitor the day-to-day usage of every employee, nor the employees’ opinion towards the system. But even if she could, reporting it to the Azazo-consultant might have undesired consequences for the customer. If support is charged for and the customer wants to avoid extra cost related to support, they might not be forthcoming with regards to their need for assistance. And in a situation where the contact person works in accounting and participates in negotiating the price, she might speak carefully when praising the product, wanting to avoid giving the vendor a reason to raise the price.
3.2
Data Understanding
Although a closer communication between the customer and the software vendor would be possible during the adoption period, it is both costly and may be affected by human biases. The audit logs present an alternative approach to monitor the adoption process, and come with "no strings attached". They are a factual record of events in chronologi-cal order, and as such represent a truth that has no subjectivity. When accumulated and processed into actionable knowledge, they can become a scalable solution for analyzing system usage for an entire customer, bypassing possible subjective filtering and interpre-tations by humans.
The audit log represents a low-level layer of information, and as such can not provide us with all the information that we might want. But our goal is not to find the best data sources for our information need, but to find out to what extent the data already available to us can answer the questions we have, in particular using just the audit logs and the information they contain. By focusing on using data that is already available, we do not require data to be collected particularly for this purpose, which would limit any
action text doc_id text timestamp datetime
ip text
client text
study to the period after the data collecting began. Using readily available data enables retrospective analysis going as far back as these rudimentary data goes, which greatly broadens the application possibilities and lowers the cost of the analysis.
The log data we work with is structured as a table in an sqlite3 database, one for each customer, with the fields shown in Table 3.1. The event_id is a database key with no semantic meaning,companyis the anonymised abbreviated name of the customer com-pany, user_name is a unique user identifier (within a company), action describes the type of the event (e.g., user login/logout, documents created/accessed/modified), doc_id
uniquely identifies a document (can be empty), andtimestampshows when the action was performed. The ipand client fields were merged from other data sources, before being delivered to us, and show the computer ip address and the client application initiating the request, respectively.
The most used attributes of the logs are the user_name (often implicitly reading com-pany name through this), action and timestamp. When relevant, doc_id was used To speed up query processing we created indices on the fields timestamp, user_name, and event_id.
The log entries, as can be seen, contain only basic information about the system usage, such as log-ins and document accesses. It is necessary to note that this data was not collected with quantitative user-analysis purpose in mind, nor does it originate from a single log source
In addition to the audit logs, the Azazo project managers and consultants gave high-level information on each customer, which we henceforth refer to as metadata. The most im-portant was the labelling of how successful they perceived the adoption process of the different companies included in the study.
3.3
Summary
This main question we want to address from business perspective is whether, and then to what extent, auto-generated system logs can serve to provide business-relevant informa-tion and insight into how well the software-adopinforma-tion process is going at the customer site. If the logs can be mined to successfully raise early warning signs, the software vendor has the option to intervene to the benefit of both the software vendor and its customers. It is important to note that our intention is not to conduct a qualitative analysis. We do not attempt to understandwhythings might be going right or wrong, nor are we evaluating user attitudes or opinion, usability, or in general focusing on system evaluation. There are several human factors that influence that process, such as how well the software fits to the task the users need to solve (usefulness), and the presence of an attentive contact person. Sociological methods would be more appropriate for that, but we want to find whether
something seems to be going off track, so that it can be looked into using other methods if needed.
Chapter 4
Data Preprocessing
This chapter describes the data preprocessing needed for effective data mining, including improving the reliability of the data. This corresponds to the "Data Preparation" phase of the CRISP-DM process.
4.1
The Data
We collected data from two main sources: Log data and company metadata. We now describe the data and how it was processed.
4.1.1
The Set of Customers
When collecting data for this study we wanted to include data for as many customers as possible. We were given access to anonymized system logs for all CoreData ECM customers (companies, documents, and users were all non-identifiable), 34 customers in total. Out of the 34 candidate companies two were still in the process of integration, so no data was available for them.
Official holidays such as Christmas and Easter introduce downtime anomalies in the logs, and since the adoption periods examined can start at different times in the year, there is a high possibility that some holidays fall within the period, but we can not know whether they occur within the period or not. We therefore want the period to be as long as possible to minimize the effect of these expected anomalies. Initially, we intended to include six months (26 weeks) following integration, but several customer companies only finished integration recently and did thus not have data available for that many months. Only 15
companies had logs spanning 26 weeks or longer, so in the interest of increasing reliability of results, we decided to study a shorter time span. By looking at a 17-week period, we were able to increase the number of costumer companies to 19. Furthermore, the reduced period length matched the intuition of the Azazo consultants, who considered full 6 months to be too long.
4.1.2
Log Data
The log data used for the analysis is extracted from audit logs of CoreData ECM. To protect the anonymity of both customer companies and the data in the system, the logs were anonymized by an Azazo developer. The data was then delivered as sqlite-files (SQLite, 2014), one for each customer. This also served to make the study blind as the true identity of the companies is unknown to the researchers.
The aim is to create metrics from the logs that describe the customers in a generic manner. We look at the big picture through the logs, examining features that are likely to be com-mon acom-mong other types of software systems, or at least have a logical equivalence. This means features such that logging in, creating, modifying or deleting documents, in addi-tion to informaaddi-tion about the user environment such as client or change of locaaddi-tion. Note that we are not using all the available logs. Audit logs are low level logs that register events in chronological order. A timestamp is present for every transaction, making it possible to examine development over time, but no information on duration of stay or response time of requests is available through the log data that we have. Data for respond time could be added from other log sources, and be used in a second iteration of the study.
4.1.3
Log Data Preprocessing
When working with raw audit logs, a need for further processing is expected so that it can serve as input to our modeling (the logs are described in Section 3.2 and the log structure in Table 3.1). In this subsection, we list the modifications to the data necessary to ensure correctness of results and ease of processing. The data was impure in various ways, and the difficulties we faced in cleaning up the data are representative of what can be expected when working with real-life data sets.
Merging Users
During the process of examining the data, we discovered that some users were manipu-lating documents, but no record could be found of them ever logging in. This happened when a user had administration rights in addition to normal user rights, resulting in them appearing as different users in the audit logs. The verification of credentials would be attributed to only one of the users, but the activity would be split between the two. To correct the data, an Azazo developer provided us with the corresponding user name pairs (anonymised), allowing us to treat both names as a single user.
Joining Data with External Data Sources
The original sqlite databases did not contain information on the client or ip-addresses where the requests originated from. This information was stored in another source, but upon request, this information was provided through database joins using the event iden-tifiers. This was needed for detecting whether the system was being used through a web-or client-based interface.
Erroneous Logging
Users working in Windows environments have the option of installing a desktop client software, which abstracts CoreData as a virtual disk for easy access. Further examination of the logs revealed that whereas the web users manually log into CoreData, the desktop client automatically logs in the desktop users each time their computer boots or returns from hibernation.
Additionally, anti-virus software treats the virtual disk as a native disk and scans it in its entirety, generating excessive illegitimate document access entries in the audit logs. This made it clear that entries originating from the disk client could potentially lead to erroneous analysis as they were non-representative of human initiated usage, and had to be omitted from user-profiling analysis.
Similarly, the ip-address of a request is frequently incorrectly logged as 127.0.0.1, which is the "localhost" address of the computer, making it impossible to use this attribute to obtain meaningful results. However, by being aware of these shortcomings and pitfalls in the logs, we could tailor our metrics to avoid compromising the reliability of the re-sults.
4.1.4
Metadata
In addition to the low-level log data, Azazo project managers and consultants were asked to give some high-level information on each customer, which we henceforth refer to as metadata.
The most essential metadata was the labelling of how successful the adoption process was in the different companies. Each adoption process was evaluated on a five categories, shown in Table 4.1. Initially, the project managers and consultants were asked to di-vide them into three categories; one where the process was more positive than negative, one where they evaluated the process as more negative than positive, and one where the process was neither mostly positive or mostly negative. They discussed each customer in meetings closed to the researcher. After the first meeting, they agreed that three categories did not fully catch the variance in the processes, and felt that this resulted in two very dif-ferent processes ending up in the same category. This was solved by defining five ordinal categories. The most successful integrations were given the highest score (five), and those in category four were also above average. Three was a neutral rank, and categories two and one were in the lower end of the ranking. Surprisingly, no adoption processes got a neutral rank of three. The number of companies in each category is shown in Table 4.1.
During their evaluation, the consultants used no quantitative measurements. After the study ended, their criteria for evaluation were revealed to the researcher. The consultants have a list of criteria that indicate a good adoption process that they used as the back-ground of their subjective evaluation of the adoption process for each customer. The three most important points on that list are
• that managers, superiors and administrative staff are encouraging and supportive,
• that the contact person of the customer is positive and included in the decision making,
• and that the staff understand the purpose of the software and see how it will increase their efficiency.
4 8
5 (highest) 4
Total: 19
According to the consultants, without any of the above points, the whole process becomes more difficult and less likely to succeed. They have identified several signs of a successful adoption process that they also considered during their evaluation. These include: many staff members actively using the software and have stopped using shared drives; that there has been a teaching session for all staff members and that usage continues beyond that session; and that it is clearly defined what documents should be in the system. None of this is being monitored quantitatively, so the consultants evaluations are based on feedback from the customer even when considering these attributes.
The fact that no customers got the average ranking of three presents a natural division point between higher and lower ranking customers. Whenever we refer tolower ranking customers, we are including rank groups one and two (a total of seven customers), and
higher ranking customers refers to companies evaluated in the higher end of the scale, namely four and five (twelve customers).
The metadata also included start and end dates for the integration processes. The integra-tion periods vary greatly in duraintegra-tion, ranging from 3 to 33 weeks. Initial intuiintegra-tion might lead one to suspect that a problematic integration takes more time, and a smooth inte-gration will finish quickly, and sometimes that might very well be the case. However, a dialog with the integration staff of Azazo revealed that long integrations often stem from extensive care to the process, even software modifications, and thus indicate that a lot of effort has been put into adjusting the software to fit the customers needs. Conversely, short integration periods can indicate a company that is expecting a quick-fix solution. It is therefore not advisable to read anything into the lengths of integration periods, and we thus did not include it in our analysis. The metadata also included other information on the customers’ background that we omitted, e.g. whether the customers were required by law to archive their data and how many contact persons from the customer company were involved in the integration process.
4.2
Summary
As is evident from the above description, preprocessing of the input data is essential for ensuring the integrity of the data. Although a very time consuming phase, a careful effort there improves the reliability of the data-analysis phase, which we describe in the next chapter.
Chapter 5
Data Analysis
In this chapter we describe the data analysis we conducted and its outcome. We start by recapping on the overall goals of the data analysis, before diving into the analysis details. This work corresponds to the "Modeling" phase of the CRISP-DM process.
5.1
Overall Goal
The primary goal of the study is to help the software vendor, in our case Azazo, to gain better insights and understanding of how new clients are using their software, in particular during the critical adoption period of the newly installed software system. We approach this challenge in two steps.
First, we construct realizable metrics from the audit logs that are informative for describ-ing each customer’s usage of the system durdescrib-ing the 17-week adoption period. We want such metrics not only to capture the essence of a typical user behavior, but also to sym-bolize and distinguish different usage patterns. We refer to this first step as descriptive analysis.
Secondly, we seek to build a predictive model classifying the companies into two cate-gories — safe or risky — depending on how well the adoption process is perceived to be going. The descriptive metrics from the first step will serve as as subset of the input attributes into the model. Furthermore, based on the exact model used for building the classifier, it may in addition to its predictive capabilities help identify which of the de-scriptive input metrics is the most informative for the prediction. We refer to this second step aspredictive analysis.
Figure 5.1: Examples of seven day active users count
Ideally, such metrics provide relevant actionable information to the software vendor, which in turn could intervene in the adoption process if needed. For example, if ab-normal trends in the system’s usage were being detected during the adoption period that pose high risk to the success of the adoption process, additional seminars of particular relevant features of the system could be offered.
5.2
Descriptive Analysis
We compute several different descriptive metrics from the audit logs, intended for gaining added insight into the usage of the system. Many of the metrics are inspired by (Rodden, Hutchinson, & Fu, 2010), which suggested their usefulness in this kind of a context.
5.2.1
Seven-Day Active Users Metric
The number of unique active users over some period of time is one possible indicator of a system’s usage. Consequently, we count the number of users logging into the system at least once during each consecutive seven-day interval of the adoption period (following the example of Rodden et al. (2010) of using seven-day periods). This is a very inclusive definition of being active, in other words, inactive users are those that do not use the system at all during the period.
it does not distinguish between existing and new users, often making it difficult to tell whether individual users have stopped using the system and new users joined (because each aforementioned group could potentially offset the other in the metric). Furthermore, it is more or less useless for contrasting different companies as we do neither know the size of the individual companies (which vary greatly in number of employees) nor the number of expected users of the system within each company. Comparing the size of user base between companies is likely only going to tell us which company is bigger. More elaborate metrics are thus called for.
5.2.2
Adoption Metric
Theadoptionmetric describes the rate in which new users start using a system. To mea-sure adoption, we tracked the time of first log-in of each user for the 17-week adoption period, which starts the first working day after the demonstration/teaching session signal-ing the end of the integration period.
We defineSn as the set of users whose first log-in occurred during weekn. To be able to compare the customers to each other, we normalize by dividing by the total number of users who first logged in during the whole period.Anthus represents the fraction of total users that started usage in weekn:
An=
|Sn|
P16
i=0|Si|
Figure 5.2 shows the cumulative adoption rate over the adoption period for the companies in our study, the low-ranking companies in the left-hand side graph and the high-ranking ones in the right-hand side graph. The first thing to notice is that the metric is normalized (by definition), making it possible to compare different sized companies. However, when looking at the adoption curves, it is not immediately clear whether a certain curve shape describes a positive or a negative trend. When the curve starts high and shows few new users in the period (even none, displaying a flat line in the graph), it could mean that the intended user base was initially identified correctly and the appropriate users introduced to the system from the start. It could also mean that only those that were told to use the
(a) Lower ranking customers (b) Higher ranking customers
Figure 5.2: Cumulative plot of adoption curves
system, used it, and nobody saw any reason to add other staff members as users, let alone pay the fees for the added users. On the other hand, when a curve starts low and grows with time, it could be interpreted as an indicator of a discrepancy in expectation of the system usage; the company expected a certain group of staff members to be the intended user group, but then as usage catches on, they realize that more staff members should have access. It can also be an indicator of expectations to the system being exceeded, the customer company extends the usage of the software, drawing in more employees as users. In either case, if the user base grows substantially after the initial instruction session, there emerges a need for more instruction sessions, as Azazo will always prefer that users have all the competence they need to make the most of the software.
It is clear though that the trend of users being gradually added seems to be more common-place among the companies where the adoption process was ranked higher, in particular, in the first couple of weeks. Thus, a potential flag that could raise an early alarm is when adoption is slow, especially in the the first weeks of the adoption period.
5.2.3
Retention
Theretentionmetric describes how many of the active users at some given period are also active at a later period, that is, it aims at measuring how devoted existing users are. We use the same seven day time periods for measuring retention as we used for measuring adoption, and similarly we define active users in a period as those that log in at least once. We define retention as follows:
(a) Lower ranking customers (b) Higher ranking customers
Figure 5.3: Retention curves
LetTnbe the set of users that are active in periodn(where period 0 is the first week after implementation ends, andT0 is a non-empty set).
Rn =
|T0 ∩Tn|
|T0|
That is, the retention at periodn is the size of the intersection of Tn andT0, divided by
the size ofT0. In other words, Rn denotes the percentage of the users active in period 0 that are also active in time periodn.
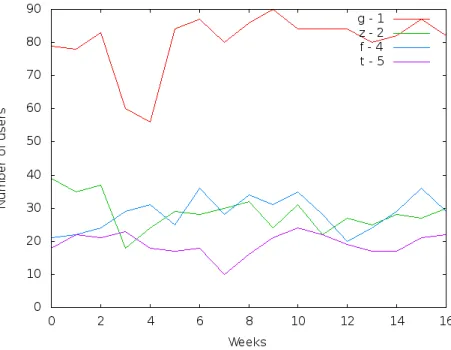
Figure 5.3 shows the retention during the 17-week adoption period. The first thing to notice is that the retention can fluctuate substantially from week to week; this is probably quite natural and simply reflects normal usage. The deeper dives in the retention are also normal and signify longer holidays (Christmas and Easters) as well as summer vacations. Of interest is to note that for one of the low-ranking companies (labelled j) the curve takes a dive during summer vacation time a couple of weeks into the adoption period and never quite fully recovers from that. The timing of the learning session and the following adoption period thus needs to be more carefully planned by the software provider to avoid such incidents.
As for general trends, for the high-ranking companies retention is high throughout for all companies except one, whereas for the low-ranking companies the (average) retention varies more between the companies. Retention on its own is thus not sufficient to distin-guish between low- and high-ranking companies, although a low or decreasing retention might raise flags that need to looked into further. For example, companiesz(low-ranking) andc(high-ranking) both have a low average retention, and further investigation is needed to understand why this happens. One possible explanation might be that in the former case
(a) Lower ranking customers (b) Higher ranking customers
Figure 5.4: User Engagement: The average number of distinct documents manipulated by one user in a seven day period
intended users have stopped using the system, whereas in the latter there may have been too many users in the initial reference set (T0). One reason for that might be that the
com-pany management decided to send all its employees to the learning session, even though they were not expected to use the system in the short term, and those users were simply checking out the system in the first periodT0.
5.2.4
Engagement
Log-ins do not give a complete image of user activity, particularly without any data on session length. For example, a user that logs in three times during a day where each session lasts about 5 minutes will appear to be more active than a user that logs in only once, but spends two hours working in the system during that session. Clearly, a metric that gives a better picture of the actual system usage is desired.
Our bid on such a metric is again inspired by (Rodden et al., 2010), so calledengagement. It is measured by counting the number of distinct documents manipulated by an individual user in a seven-day period. In the CoreData ECM system every item (i.e., folders, files, messages, items and workspaces) is considered a document, so in our context engagement captures more or less all type of system usage.
Figure 5.4 shows the average user engagement of the companies included in our study. Although the average of the lower-ranked companies is somewhat lower than that of the higher ranked, 20.6 vs. 22.9 respectively, the difference is not significant. This metric is problematic to use for comparing different companies without additional information of intended document usage.
operating system. Because of this limited availability and the fact that the client became available only after some of the first companies taking up the system went through their adoption period (entry marked as N/A in the table), a comparison between individual companies is not meaningful. However, for the software vendor this information is in-formative of what type of interface the users selects to use for accessing the documents in the system (prior to this study the Azazo did not have this information at hand). In general keeping track of this kind of usage information is important. For example, if a feature that the customer is already paying for is not used much or simply overlooked by the customer, the vendor might consider promoting that feature to increase the perceived value of the software for the customer. Or, vice verse, if the company is spending huge resources in building features that are truly of little interest to the users, it could save on development as well as simplify the interface of the software.
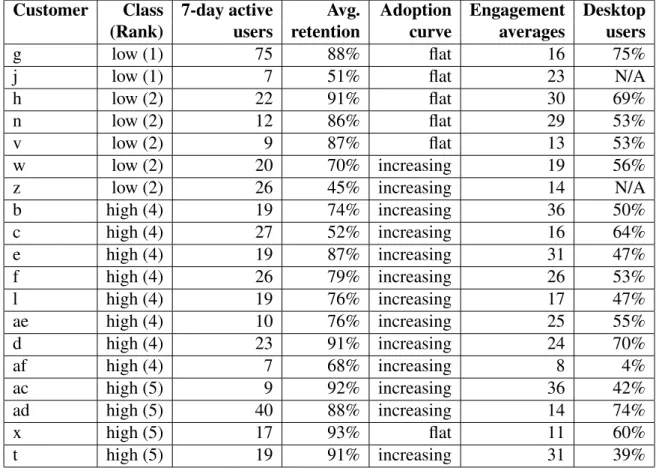
Table 5.1: Descriptive Metrics
Customer Class 7-day active Avg. Adoption Engagement Desktop (Rank) users retention curve averages users
g low (1) 75 88% flat 16 75%
j low (1) 7 51% flat 23 N/A
h low (2) 22 91% flat 30 69%
n low (2) 12 86% flat 29 53%
v low (2) 9 87% flat 13 53%
w low (2) 20 70% increasing 19 56%
z low (2) 26 45% increasing 14 N/A
b high (4) 19 74% increasing 36 50% c high (4) 27 52% increasing 16 64% e high (4) 19 87% increasing 31 47% f high (4) 26 79% increasing 26 53% l high (4) 19 76% increasing 17 47% ae high (4) 10 76% increasing 25 55% d high (4) 23 91% increasing 24 70% af high (4) 7 68% increasing 8 4% ac high (5) 9 92% increasing 36 42% ad high (5) 40 88% increasing 14 74% x high (5) 17 93% flat 11 60% t high (5) 19 91% increasing 31 39%
Table 5.1, in addition to the desktop client data, also lists summary information about the other metrics discussed in this chapter. The left-most column lists the company label, followed by the rank converted to our Class definition. Averages are given for 7-day active users and retention, and the shape of the adoption metric curve is described (increasingif adoption grows in the first few weeks, otherwiseflat), as input into the predictive analysis. In the final column, the ratio of desktop users is given.
5.3
Usage Example: Profiles of Customers
As an example of how the metrics can be used, we give an overview of two customers using the metrics in their current version.
5.3.1
Company Z
A brief dissection ofcompany zbased on the defined metrics could be as follows:
• Seven-day active users tells us on average how many users from the company use CoreData during a week. Here, any holidays that might fall within the period will impact this value. For this company, Christmas occurs a few weeks into the period, but since we always omit the bottom and top data points when evaluating this, we minimize the effect of anomalies and get a more reliable average. The observed value of 26 weekly users gives a general feeling of how much the system is used.
• Adoption is gradually increasing. As seen in Figure 5.5a, quite a few new users are being added after the initial launch. Only 39% of the total users are already present at start. By the end of the 17 week period, there are 100 users, which gives 61 users that were added after the teaching session was held. Also note that a 100 different users were identified during the 17 week period, but the seven-day active users indicated just about 26 different users each week. This could mean that on average, each user logs in every four weeks. Alternatively, some users might log in every other week, and others every eight weeks. The retention metric might add further insight.
• Retention is rather low, although stable, as seen in Figure 5.5b, around 40-50%. Remember that this retention takes the first week of adoption as the starting point, when there were 39 users in the system. Company zmore than doubled the number of users during the observed period. Having that in mind when looking at the re-tention rates indicates that the group of initial users was poorly defined. For some
(a) Adoption curve for companies z and t (b) Retention for companies z and t
Figure 5.5: Comparing two customers through metrics
reason, the initial users are not really revisiting the system (retention value above 50% is observed only a single time), and several new users are being added through-out the observed period.
A modified version of retention that could be used over time (not anchored to the first week of the adoption period) would give information about retention among the new users, and based on these observations, a vendor would most likely want to examine this further.
• Engagement tells us how many different documents, workspaces or similar are changed by the users on average. The engagement value forcompany zis 14, while the system-wide average is 21. These numbers indicate that the users ofcompany z
are on the inactive side compared to the system average. Calculating the standard deviation would tell us if there are a few active users and many inactive, or if the users are equally inactive, if we wanted to analyze the customer user composition closer.
• Desktop Users: Even ifcompany zhas only been a customer for about three years, its adoption process still predates the desktop client.
• Rank: The company adoption success was ranked as low by Azazo consultants.
• Summary: The below average ranking rhymes well with our evaluation of the met-rics. The company seems to have quite a few low-activity users, as seen in the big difference between seven-day user averages and total users in the system. The us-age is infrequent, as seen in the retention metric values. And when the users are in the system, they do not do much, as the observed engagement is well below the system-wide average.
5.3.2
Company T
Similarly we can describecompany tthrough the metrics as follows:
• Seven-day active users: At company t, about 19 users on average log in to the CoreData ECM in a week.
• Adoption: In week one, 18 users are active, and during the adoption period, another ten are added along the way. The distribution of additions over time can be seen in Figure 5.5a. It is only natural that a handful of users are added to reflect new staff additions. But as seen in Figure 5.5a, quite a few users are added during the very first weeks in the period. A software vendor might want to keep an eye on this and evaluate whether a second teaching session is appropriate, or to learn from (find out why these users were not added from the start), to improve future adoption processes.
• Retention: The retention values for company taverage at around 89%. Only once do they take a dive below 83%, and then they go as low as 55%. This is an example of an expected anomaly, as this happens during Christmas.
It is noteworthy that even this lowest value of customer t is about the same as the single highest value for company z(56%). Company t reaches a full score on the retention scale an impressive three times, where every one of the 18 users of the first week used the system. The average of 83% equals about three users absent out of the 18.
• Engagement: The Engagement value forcompany t is 31, while the system-wide average is 21. This suggests that the users of company t use the system more ac-tively than the general average.
• Desktop Users: 39% of the users atcompany thave the desktop client installed.
• Rank: This customer was ranked in the top category, given the score5.
• Summary: We observe that the margin between the number of initial users and the number of weekly users is only one. Seen in the light of the high retention rate, we can deduce that the users that were added during the first week of the observation period are not very active users, such as administrative staff, and thus there might be no pressuring need to educate them in the usage of the system.
From the outlined results, we see no reason for a vendor to have any concerns for this customer. The initial group seems to have been well defined, with a few peripheral users added quickly, which raises no concern. Users atcompany tare avid users of CoreData,
Each of the metrics approach the customer from a different perspective, and put together, they add up to an overview of the customer that gives valuable information about the user composition. The overview is high-level and covers fundamental attributes of cus-tomers which in turn enables reporting possibilities that are new to the software vendor in question.
5.4
Predictive Analysis
We would like to predict whether the software adoption process is going to be successful or not. We have already derived a few useful metrics for that, but as discussed, they have to be looked at collectively to offer insights. With increased number of metrics their intricate relationship could be hard to detect manually. Instead we rely on machine-learning tools to build a predictive model using the metrics as input attributes.
5.4.1
Weka
The Waikato Environment for Knowledge Analysis (Weka) is a software system for data mining and machine learning (Hall et al., 2009). Through graphical interfaces the work-bench provides data analysis tools using several methods such as classification, clustering, regression, visualization and more. We will be using Weka for classification.
We formatted the results listed in Table 5.1 into Weka native format (.arff), for it to be analyzed using the Weka software. However, the 7-day active user metric was omitted, as it is not (and can not be) a normalized metric.
5.4.2
Classification
We split the 19 customer records into training and testing sets to avoid overfitting the data. However, because of how few the records are, a special care had to be taken for the training set still to be representative. We therefore apply cross-validation with the
Adoption curve Retention low <= 91.27% high >91.27% flat high increasing
Figure 5.6: Decision Tree
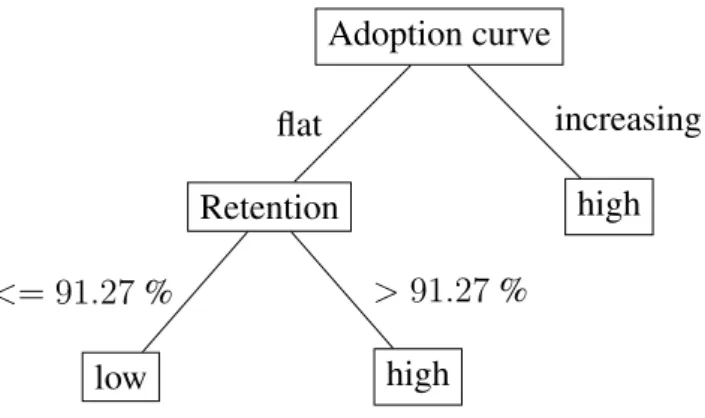
same number of folds as the records, known as theleave-one-out approach (Tan, Stein-bach, & Kumar, 2006). We used the J.48 decision-tree classifier algorithm in Weka to build the prediction model (parameterized with leaf size of 1 and no tree pruning). The metrics applied were adoption curve, ratio of desktop users, engagement and average re-tention.
The resulting decision-tree is depicted in Figure 5.6.
The applicability of the decision tree is twofold. Firstly, it can be used to evaluate which of our metrics is the most informative, as the J.48 algorithm will split the data using the most significant metric first. As such, the resulting classifier confirms our intuition that the most useful metrics are the adoption curve shape and the retention value. More specifically, an increasing adoption curve (early in the adoption process) is a strong indicator of success, but even in cases of being flat, high retention also signals success.
Secondly, the decision tree can be used for classification of future adoption processes. Having a classifier that can evaluate adoption based on automatically collected data is useful when the human contact between customer and vendor is not as prominent, such as in purely online sales.
It is important to note that the decision tree does not correctly identify all instances in our data set. As seen in the Weka output in Figure 5.7, the classifier incorrectly classifies six instances, three are erroneously classified as high, and the same number of instances is erroneously classifiedlow. In other words, as it correctly classifies 13 out of 19 instances, the classifier achieves over 68% accuracy on the testing data, with no obvious bias in its classification errors. Due to the fact that the number of data points is so low, this is an acceptable value. Each instance accounts for about 5% of the classification accuracy, either way, so classifying one more instance correctly would bring the accuracy to almost 74%.
It is interesting to note that even though four metrics were available in the .arff-file, only two of them become attributes in the resulting tree classifier. This means that the other two did not present any significant information that correlated with the identified classes, neither alone, or in conjunction with any other attribute. Considering that the accuracy of the classifier still has room for improvement, we can deduce that the attributes that did not add any value to the classifier are very insignificant, and thus require more refinement if at all applicable in the context of a decision tree classifier. We suspect that the ratio of desktop users might be irrelevant in this context, while improving the engagement metric could potentially introduce valuable information.
5.5
Summary
With these results, we have in a way gone full circle, as we are seeing that the results of our metrics in the classifier roughly aligns with the human evaluation. As such, these results give reason to optimism about being able to use the metrics presented here to evaluate the adoptions as a supplement, or even replacement for the human labor intensive and thus time consuming evaluation methods.
The results presented here are promising, and show that useful insights into the adoption process can be gained from rudimentary audit logs. In the next chapter we discuss the results in a wider context.
Chapter 6
Discussion
In this chapter we consider the applicability of the presented metrics and models and discuss their relevance for the software vendor. We also discuss how the deeper under-standing we now have of the data could be used to further improve and refine subsequent data-mining iterations.
6.1
Vendor Value - From Audit Logs to Information
As discussed in the previous chapters, our work has several potential benefits for the Core-Data software vendor, as they had no systematic methods of analyzing their customers usage of CoreData prior to this work.
Our results, however, have more general implications than that. In particular, these results suggest that low-level audit logs, which are commonly used in software applications, can potentially be mined to gain useful information about higher-level tasks, such as evaluat-ing software adoption. This knowledge can be used to objectively evaluate and automat-ically monitor future adoption processes, compare customers to each other and describe their composition through individual metrics. Analogous methods could also be used for different tasks that require user analysis, such as monitoring over- or under-utilization of individual software features or detecting usage trends.
We have created a series of metrics that convert audit logs (a common element of most software companies) into actionable knowledge. Automating such monitoring offers great benefits to both software vendors and their customers.
6.2
Further Data Mining
As seen in the CRISP-DM model in Figure 2.1, we have finished the first iteration through the data understanding, processing, modeling and evaluation phases. Now would be the appropriate time to reflect on what we have learned and possibly reiterate through these phases. Based on the potential improvements and additions to the metrics presented in the previous chapter, we suggest that this might be appropriate in this case, and suspect it would lead to further improvements of the models. If we were to proceed the study with another iteration, we would apply the following factors that we have learned from the first iteration.
• More DataAbove all, more data is desired to be able to build more reliable models. As we did use all the available customers for this iteration, adding customers to our data set is not yet an option (using the same parameters). However, quantitative data from other logs (such as web logs) could be added to support more metrics. Having more detailed information on action type would enable flow-analysis. Data on evolution of the number of documents, and the growth curve for the size of the database (size of documents) might add details to our analysis, but data on document size is currently not in the audit log.
• Period Length We observed that the adoption metric curve took its shape during the first few weeks, so one modification for a second iteration would be to shorten the period examined and find out the shortest period that can be used. This would also allow for more customers to be added in subsequent iterations.
• Engagement Over Time For thoroughness, one should examine the development of the engagement metric over time for each company, and include the shape of the curve as input to the analysis, as done with the adoption metric. The averages alone, which we used, are clearly not descriptive enough as they are not statistically significant.
• Reference GroupThe adoption and retention metrics are sensitive to the reference group used. More careful study of how best to define the set of users in the reference group is needed, possibly in collaboration with Azazo consultants.
6.3
Further Additions
In addition to a second iteration, the study can be extended with more metrics, some that require more data.
Examples of such studies could include an examination of at what times users generally log in (within office hours or during nights and weekends) and further insight would be gained by comparing that data to the location of log-in. This would lead to further distinction between users that can be useful in several contexts. The audit logs do not give us the possibility of examining session length; it would be of interest to see if that data can be extracted from other logs and added to this analysis. A more detailed analysis of frequency of user log-ins requires a verification of the correctness in the logs, to avoid drawing conclusions from impure data. Metrics that would target log-in frequency in more detail include monitoring number of log-ins per week, monitored over time.
6.3.2
User Type Analysis
Currently, we have no metrics that describe user types. It would be highly interesting to gather descriptive features of the users, to further understand user behavior. Without any descriptive features, we do not know what types of users there are in the system, or what characterizes them. Such questions could be answered using cluster analysis, a machine learning method that is well suited to finding if any natural groupings emerge. Such information would enable retrospective analysis of the adoption patterns for the different types of users. That can in turn be used to promote power-user behavior during adoption periods, or present ways to divert the tendencies that lead to idler users. Such analysis becomes more reliable the more data we have, so it would be a good match for the amount of data expected for user profiling.
6.3.3
Persistence Metric
One way of measuring activity of users could be apersistencemetric, a retention metric modified to use after the adoption period has ended. The metric would considern(where
n ≥ 2) different weeks and find the set of users active at all of them. If there is a small turnover of the people using the software every week, the union set will be small, resulting in a higher persistence value.
Pi =
|Ti|
|T1∪ · · · ∪Tn|
,1≤i≤n
An average of the valuesP1 through Pn would then give the persistence value for that customer. Note that under this metric the same calendar weeks are examined for all the customers, so national holidays can be consciously avoided, allowing for lower values of
nwithout loss of reliability. Even when holidays cannot be avoided entirely, it affects all customers with equal impact, so comparability will not suffer.
6.3.4
Engagement Reversed
Another metric that can be applied outside of the adoption period is a variation of the engagement metric presented in the study. By reversing the formula, dividing the number of documents a single customer modifies during a week by the number of users within that customer active that week, user engagement is viewed from a different perspective.
6.4
Summary
Our current results are already promising and of a clear value to the vendor, but there is still room for further improvements as discussed above.
Chapter 7
Related Work
In this chapter, we outline previous studies on this and related topics.
7.1
Academic Approaches
Within academia, user studies have been performed somewhat extensively using quali-tative methods, but quantiquali-tative user studies are less used. We will now describe both qualitative and quantitative approaches towards this problem.
7.1.1
Qualitative User Studies
Although the approach in this project is purely quantitative, a similar problem has been studied using qualitative methods. Mendoza et al. have through a longitudinal study examined influential features with regards to whether a user will continue to use the soft-ware. They conclude that long-term usage is not automatically achieved even though the adoption went well; continued support and perception of usefulness must persist in order to avoid long-term rejection (Mendoza, Carroll, & Stern, 2008). This further underlines the need for continued monitoring of usage with tools such as ours.
User studies in Computer-Human Interaction (CHI) include a number of well established qualitative evaluation methods well suited for many purposes (Lazar, Feng, & Hochheiser, 2010; Vermeeren et al., 2010). However, qualitative studies can be subject to systematic error or bias due to participants, experimenter behavior and environmental factors (Lazar et al., 2010). Interviews are time consuming and limited to a few interview participants, which make gereralizability questionable as user base grows beyond hundreds (Brush,
Wang, Turner, & Smith, 2005), and is limited with regards to scalability. Surveys are more scalable, but provide less depth, and more importantly often lead to biased data regarding usage patterns, since they are subject to recall bias (Lazar et al., 2010) and situational subjectivity (Saal, Downey, & Lahey, 1980). When looking at usage patterns, automated data collection methods using the appropriate data sources provide quantifiable data for analysis that is scalable, bypasses any recall errors of the test subjects, and if desired can be repeated with low cost and high precision. Studies that have used both surveys and log data identify log data as more appropriate for certain types of questions, such as what features are most used, and questions regarding duration and intensity. Not only do logs bypass recall bias, they also have a higher accuracy rate, since questionnaires seldom have a 100% return rate (Hvannberg & Larusdottir, 2000).
7.1.2
Quantitative User Studies
The science of user engagement can benefit from also examining quantitatively observ-able evidence of user behavior (Attfield, Kazai, Lalmas, & Piwowarski, 2011). Rodden et al. claim that “A key missing piece in CHI research is user experience metrics based on large-scale behavioral data” suggesting that a lot of work is still to be done in shaping the research methodology in this field. This is also reflected in the lack of academic literature found concerning user studies in enterprise software through computer collected data. However, Rodden et al. present two metrics frameworks, the PULSE and the HEART. While PULSE metrics are business and technically oriented (Page Views, Uptime, La-tency, Seven-day active users and Earnings), the HEART metrics are its complement and provide actionable data and data on user experience quality by measuring Happiness, Engagement, Adoption, Retention and Task success (Rodden et al., 2010). Rodden et al present these metrics as a result of their experience of working in “A large company whose products cover a wide range of categories”, all of which are web-based, some consumer-oriented while others are business-consumer-oriented, and each of their products have millions of users. That sounds like a rather accurate description of Google.
7.2
Industry Work
User profiling is widely used in industry, particularly in e-commerce, where the goal is to apply user similarity to improve personalized marketing towards the user. This is not as common in fields where there is not a direct economical benefit to suggesting material to users, such as in digital libraries (Chi, 2004). User profiling also represents a focus