Forecasting Stock Price
using Wavelet Neural Network Optimized
by Directed Artificial Bee Colony Algorithm
Thanh Tung Khuat, Quang Chanh Le, Bich Loan Nguyen, and My Hanh Le
University of Danang, University of Science and Technology, Danang, VietnamAbstract—Stock prediction with data mining techniques is one of the most important issues in finance. This field has at-tracted great scientific interest and has become a crucial re-search area to provide a more precise prediction process. This study proposes an integrated approach where Haar wavelet transform and Artificial Neural Network optimized by Di-rected Artificial Bee Colony algorithm are combined for the stock price prediction. The proposed approach was tested on the historical price data collected from Yahoo Finance with different companies. Furthermore, the prediction result was found satisfactorily enough as a guide for traders and investors in making qualitative decisions.
Keywords—Artificial Bee Colony algorithm, Artificial Neural Network, back-propagation algorithm, stock price forecasting, wavelet transform.
1. Introduction
The stock price prediction is one of the most important topics in finance and business. An intelligent system would predict the stock price and give a guide to investors to buy a stock before the price rises, or sell it before its value de-clines. Though it is very hard to replace the role of experts, an accurate prediction algorithm can directly result in high profits for investment companies. The efficient algorithm can also indicate a direct relationship between the accuracy of the prediction algorithm and the profit taken from the use of the algorithm. However, the stock market trends are nonlinear, uncertain, and non-stationary and nowadays it tends to be more risk than before for forecasting the stock price [1]–[3].
Artificial Neural Network (ANN) is one of data mining techniques being widely accepted in the business area due to its ability to learn and detect relationships among non-linear variables. Several studies have shown that the ANN outperforms statistical regression models and also allows deeper analysis of large data sets, especially those that have the tendency to fluctuate within a short of period of time [4]–[7]. However, in the case of financial forecasting for enormous time series, appropriate data preprocessing techniques and optimization algorithms are required to en-hance the accuracy of the predicted results.
In this study, the prediction system is built by the combi-nation of preprocessing techniques including Haar wavelet and a neural network optimized by using Directed Artificial Bee Colony (DABC) algorithm [8]. The Haar wavelet is
utilized to decompose the stock price time series and elim-inate noise, since the representation of a wavelet can tackle the non-stationary involved in the economic and financial time series [9]. The Artificial Bee Colony (ABC) algorithm is a novel meta-heuristic approach proposed by [10]. Due to the advantages of memory, multi-characters, local search, and a solution improvement mechanism, this algorithm can be used for identifying high-quality optimal solutions and offering the balance between complexity and performance, as well as optimizing predictions effectively. In this study, the DABC which is the improved version of the ABC is used to optimize the weights and biases of ANN before training the network by back-propagation (BP) algorithm. The main goal of this study is to figure out the efficiency of the ANN improved by using DABC for tackling the re-gression problem on a particular domain such as the stock market.
The remaining of the paper is organized as follows. Sec-tion 2 presents some works related to research fields. The proposed approach for the stock price prediction is shown in Section 3. Section 4 describes the experiments and ob-tained results. Conclusion and future works are presented in Section 5.
2. Related Works
Numerous researches about financial data mining have been done. Kim and Chun [11] implemented a neural net-work system using the technical analysis variables for listed companies in Shanghai Stock Exchange. They have com-pared the performance of two learning algorithms and two weight initialization methods. The results indicated that the forecasting of stock market is quite acceptable with both the algorithm and initialization methods, but the per-formance of the back-propagation can be increased by conjugate gradient learning and multiple linear regression weight initializations. However, when the structure of ANN gets to be complex and there are large training samples, convergent speed in these algorithms will become very slow. This influences the accuracy of the predicted re-sults of ANN. To cope with this problem, a new method using the evolutionary algorithms is proposed in some re-searches [5], [12]–[14].
Kim and Han [15] used a genetic algorithm to transform continuous input values into discrete ones. The genetic
algorithm was used to reduce the complexity of the fea-ture space. Kishikawa and Tokinaga [16] applied a wavelet transform to extract the short-term feature of stock trends. The past works have used various forecasting techniques in order to predict the stock market trends. Some methods attempted to forecast the daily returns, while some other studies developed forecasting models to predict the rate of returns of individual stocks. In many papers, it was also found that researchers have attempted to compare their re-sults with other statistical tools. Each approach has advan-tages and disadvanadvan-tages, so it is able to use one of them to hide the disadvantage of another. These findings pro-vide a strong motivation for modeling forecasting tools for stock market prediction. Besides applying wavelet-based data preprocessing, this study uses the DABC algorithm to optimize the weights and biases of ANN to enhance the accuracy for results of the stock price prediction.
3. Methodology
In general there are two stock prediction methodologies: technical and fundamental analyses. Technical analysis us-ing time-series analysis to deal with the determination of the stock price based on the historical data, while funda-mental analysis concentrates on the forces of supply, the past performance of the company and the earnings fore-cast.
Wavelet transform
Evaluate the influence of Haar wavelet and DABC on the accuracy of the prediction
Extracting data from time series
Data normalization
Splitting data
ANN optimization by DABC algorithm
ANN training by back-propagation
Stock forecasting with different companies
Data preprocessing stage
T
raining stage
T
esting stage
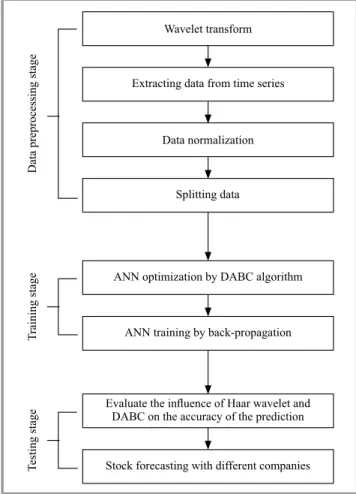
Fig. 1. Proposed approach overview.
To involve both fundamental and technical analyses, this study presents a novel approach that integrates the Haar wavelet transform and the DABC algorithm into the Mul-tilayer Perceptron (MLP) neural network. Figure 1 briefly shows the main process used in this work and it will be explained in more details below.
3.1. Choosing Data Formatting
The factors utilized for training the ANN are chosen based on the experience of trader with regard to the specific stocks. There are many technical indicators and funda-mental factors such as: Moving Average (MA), Relative Strength Index (RSI), Boilinger bands, Close/open prices, Volume oscillator being able to be used to analyze the stock market.
This work uses the close price to train the ANN, so the output of the ANN will be the close price as well.
3.2. Data Preprocessing
3.2.1. Noise Filtering Using Haar Wavelet Transform The first stage of data preprocessing is the use of Haar wavelet to decompose the financial time series and remove noise since the representation of a wavelet can tackle the non-stationarity involved in the economic and financial time series [9]. Wavelets are mathematical functions that break data into various frequency components, and then each component is studied with a resolution matched to its scale. There are a wide variety of popular wavelet algorithms in-cluding Daubechies wavelets, Mexican Hat wavelets and Morlet wavelets. These wavelet algorithms have the advan-tage of better resolution for smoothly changing time series. However, they have the disadvantage of being more ex-pensive to compute than the Haar wavelets. Therefore, this study uses the Haar wavelet which is the simplest algorithm and works well for the stock price time series.
A time series can be viewed in multiple resolutions when using wavelets. Each resolution represents a different fre-quency. The wavelet method computes averages and dif-ferences of a signal, breaking the signal down into spec-trums. The Haar wavelet algorithm works on time series whose size is a power of two values (e.g., 32, 64, 128...). Each step of the wavelet transform generates two sets of val-ues: a set of averages and a set of differences (the wavelet coefficients). Each set is half the size of the input data. For example, if the time series has 128 elements, the first step will generate 64 averages and 64 coefficients. The set of averages then becomes the input for the next step (e.g., 64 averages generating a new set of 32 averages and 32 coefficients). This process is repeated until one average and one coefficient are obtained.
The strength of two coefficient spectra generated by a wavelet calculation reflects the change in the time series at different resolutions. The first coefficient band shows the highest frequency changes. This is the noisiest part of the
time series. This noise can be eliminated by using thresh-old methods. Each later band reflects changes at lower and lower frequencies.
3.2.2. Extracting Data from Time Series
In the stock price prediction, authors have to decide that how many prices of the recent days will be used to predict the price of the next day. That value is called as “window-Size”. Traders can use any values for windowSize that they want, commonly in the range of 10 to 180 days.
This work uses 30-to-1 model that means using 30 recent days to forecast the next day. WindowSize is also the num-ber of inputs used in the input layer of the ANN. To train the ANN, we need many 30-to-1 sequences, and each se-quence consists of two vectors. The input vector includes 30 prices of 30 recent days while the output vector com-prises the price of the next day. In order to obtainn se-quences, we have to slide the window back n steps, and then extract one sequence at each step [7].
3.2.3. Data Normalization
Normalization is a process transforming the time series data points into a small pre-specified range generally from 1 to –1 or 0 [17]. In order to facilitate the training process, the data needs to be normalized before training the ANN because the prices are in the different ranges. This study uses Vector Normalization [18] for normalizing data. Mathematical formula of Vector Normalization is shown as the Eq. 1: Ni=sTi k ∑ j=1T 2 j , (1)
whereNi is the normalized data and Ti is the time-series data,kis the number of values in series, andi=1,. . .,k. 3.2.4. Splitting Data into Training, Validation
and Testing Sets
One of the problems that occur during neural network ing is called overfitting. In this case, the error on the train-ing set is very small but when a new data is presented to the network, the error is high. In other words, the ANN performs well on training data and poorly on data it has not seen. This is due to the fact that the network has memo-rized the training samples but has not learned to generalize to new situations. The ANN will therefore not possess the generalization ability and will give a poor predictive per-formance.
For the purpose of resolving the overfitting problem, the data will be randomly separated into the training set and validation set. This is one of the simplest and most widely used means for avoiding overfitting [19]. The training set is the data set used to adjust the weights on the neural network. The validation set is used to minimize overfitting,
and the weights of the network associated with this data set are not adjusted during the training process. If the accuracy over the training set increases, but the accuracy over then validation set stays the same or decreases, then the ANN is overfitting and should stop training. The accuracy was evaluated by different errors, and in order to speed up the computation, authors ran the validation every 5 training epochs.
Note that the testing set is different with the validation set, because the validation data is independent of the training data. The testing set is used only for testing the final so-lution in order to confirm the actual predictive power of the network. Therefore, the testing set would be used to evaluate the prediction ability of the proposed approaches.
3.3. MLP Neural Network Setting
In general, the architecture of MLP-ANN can have many hidden layers and each hidden layer can include many neu-rons. However, theoretical works have shown that a ANN with one hidden layer is good enough to approximate any complex non-linear functions [17], [20]. In addition, many studies and experimental results also indicate that one hid-den layer is sufficient for most of the forecasting prob-lems [4], [17], [21]. Therefore, this work uses the archi-tecture of MLP-ANN with one hidden layer.
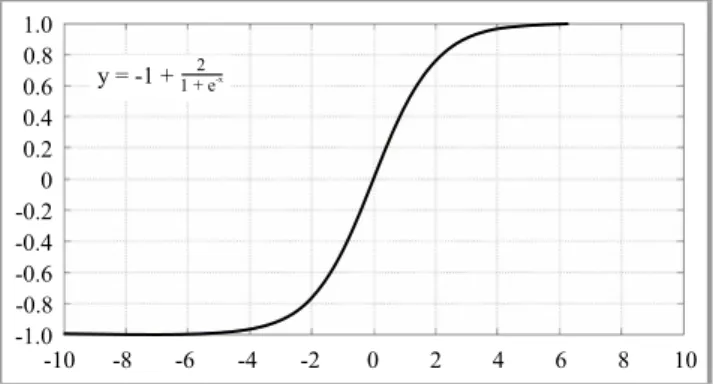
Other difficult tasks when choosing good parameters for ANN are the number of hidden neurons and activation func-tion. Setting a suitable architecture of the ANN for a par-ticular problem is an important task, because the network topology directly affects to its computational complexity and generalization ability. Too much hidden layers or hid-den neurons will drive the ANN to the overfitting. Based on conducted experiments and other researches [7], [22], the ANN with 8 neurons for the hidden layer and Bipolar Sigmoid function (Fig. 2) as activation function for both hidden and output layer is suitable for forecasting the stock price. y = -1 +1 + e2 -x 1.0 0.8 0.6 0.4 0.2 0 -0.2 -0.4 -0.6 -0.8 -1.0 -10 -8 -6 -4 -2 0 2 4 6 8 10
Fig. 2. Bipolar Sigmoid function.
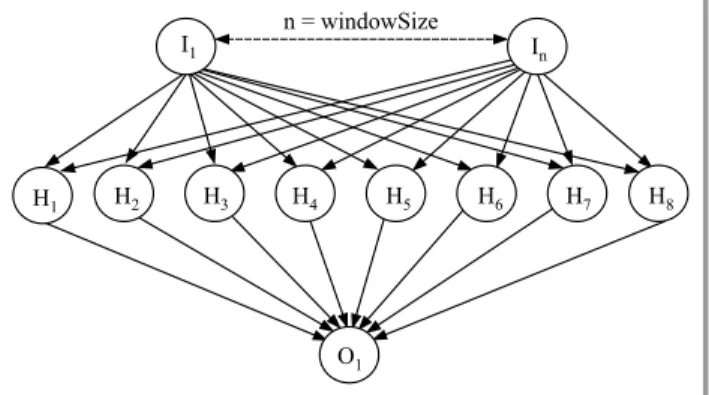
Figure 3 shows the structure of the ANN used for proposed prediction system. The input layer is mapped with the input vector containing 30 (windowSize) latest close prices. The output layer including one neuron denotes the close price of the next day.
I 1 In O 1 H 1 H2 H3 H4 H5 H6 H7 H8 n = windowSize
Fig. 3. The architecture of proposed ANN – windowSize-8-1. It can be also known that the ANN structure also depends on the experience of trader and other factors, so proposed settings for ANN’s parameters are just a recommendation for traders.
3.4. MLP Neural Network Training
After the data preprocessing process, the ANN will be trained via two stages. In the first stage, the weights and biases for ANN need to be optimized by using the DABC algorithm to overcome getting stuck in local optima. The DABC algorithm is an effective method for enhancing the convergence to global optimum [8]. In the second stage, the ANN with weights and biases being optimized by the DABC will be trained by back-propagation algorithm.
3.4.1. Optimizing Weights and Biases of the ANN Using the DABC Algorithm
Artificial Bee Colony algorithm being one of the swarm in-telligence algorithms is inspired by the foraging behaviors of real honeybee colonies. In ABC algorithm, a colony of artificial bees has three kinds of bees: employed bees, on-lookers, and scouts. In this paper, a food source represents a possible set of optimized weights and biases for ANN. Employed bees will exploit a food source and then share information about their food sources with onlooker bees waiting on the dance area within the hive, while scout bees will randomly search for new food sources surrounding the hive to replace the ones abandoned by the employed bees. The details of the DABC algorithm are presented as Algo-rithm 1.
In this algorithm, f iti is the fitness value of food source (solution)xi,vi is the food source near xi, pi is the prob-ability value of xi, xi j is the jth dimension of xi, di j is the direction information ofxi j,andMCN is the maximum number of cycle in the algorithm. The number of employed bees is equal to the number of food sources. The employed bee whose trial counter is higher than the predefined limit becomes a scout bee.
After the data pre-processing process, the weights and bi-ases of the ANN are initialized by using the directed ABC algorithm. The accuracy of the output of the ANN depends on its initial values of weights and biases. In this work, the
Algorithm 1: The pseudocode for DABC algorithm
1: Load training samples
2: Generate the initial populationxi,i=1, . . . ,SNby using Eq. 4
3: Set the direction information di j = 0, i = 1, . . . ,SN;
j=1, . . . ,D
4: Calculate the fitness f itiof the population by Eq. 5
5: cycle=1 6: repeat
7: foreach employed beedo
8: Produce new solutionviby using Eq. 6
9: Calculate the value f iti
10: Apply greedy selection process
11: Update the direction information
12: end for
13: Calculate the probability pi for the solutionsxiby using
Eq. 7
14: foreach onlooker beedo
15: Apply Roulette Wheel to select a solutionxi
16: Produce a new solutionvifromxi
17: Calculate the value f itiofvi
18: Apply greedy selection process
19: Update the direction information
20: end for
21: If there is an abandoned solution for the scout then replace
it with a new solution, which will be randomly produced by using Eq. 4
22: Memorize the best solution so far
23: cycle=cycle+1 24: untilcycle=MCN
DABC is used to seek the optimal set of initial weights and biases prior to the training process in order to enhance the convergence speed and the rigor of output values of the ANN. The process of optimizing the biases and weights is conducted by minimizing an objective function such as the mean square error given by Eq. 2:
E(~wi(t)) = N1· T
∑
j=1(Oj−Yj)2, (2)
whereT is the number of patterns in the training data set,
E(w~i(t))is the error at thet-th cycle in the algorithm,w~i(t) is the vector of the weights of the ANN being included in the i-th individual at thet-th cycle, Oj andYj are the desired output and actual value of the j-th training data respectively.
At the beginning of the algorithm, the population is ran-domly generated and the direction information of all di-mensions equals to 0. SN is the number of solutions, also the number of employed or onlooker bees. In this work, a food source or an individual represents a possible set of optimized weights and biases for the ANN. Each solu-tion xi is a D-dimensional vector containing weights and biases of the ANN. As for the proposed ANN architecture (windowSize-8-1), the value of D is the total number of weights and bias of the ANN that needs to be optimized and can be calculated by using Eq. 3 whose details are shown in Table 1:
Table 1
Parameters for proposed ANN (windowSize-8-1)
Value Symbol Description
WindowSize·8 IW{1, 1} Weights of the connections
from input to hidden layers
8 b{1, 1} Biases of neurons in hidden
layer 8·1 LW{2, 1}
Weights of the connections between output and hidden layers
1 b{2, 1} Biases of output neurons
After initialization, the population of the food source posi-tions goes through repeated cycles,cycle=1,2, . . . ,MCN, of three search processes for the employed bees, the on-looker bees, and scout bees phases. An employed bee searches around the current food source for a new food source and recalculates the nectar amount (fitness value) of the new food source. If the nectar amount of the new food source is higher than the previous one, the bee memo-rizes the new food source position and forgets the old one. Otherwise, it keeps the previous food source position. This is a greedy selection process. After all employed bees finish their neighborhood search, they share the nectar amount of the food sources and their position with the onlooker bees on the dance area. An onlooker bee assesses the nectar information given by all employed bees and selects a food source based on the probability associated with its nectar amount. Similar to the employed bee, the onlooker bee pro-duces a new position and recalculates the nectar amount of the new position. It then applies the same greedy selection process as in the employed bee phase. In the initialization, a food source for employed bee is produced by using Eq. 4:
xij=xminj +r·(xmaxj −xminj ), (4) wherei∈ {1,2, . . . ,SN},j∈ {1,2, . . . ,D}andris a random number in the range of [0. . .1].
The fitness value is computed as Eq. 5:
f iti= 1 1+fi, if fi>0 1+abs(fi), otherwise , (5)
where f iti is the fitness of the ith food source and fi is the specific objective function value for the optimization problem. In this work, fi=E(w~i(t)).
In the DABC algorithm, a new food source position is gen-erated by using Eq. 6:
vi j= xi j+ϕ·(xi j−xk j), if di j=0 xi j+r·abs(xi j−xk j), if di j=1 xi j−r·abs(xi j−xk j), if di j=−1 , (6)
where k∈ {1,2, . . . ,SN},j ∈ {1,2, . . . ,D} are randomly chosen,kmust be different fromi,absis the absolute func-tion,di j is the direction information for j-th dimension of thei-th food source position,ϕ is a random number in the
range of [–1. . .+1] andr is a random number in the range of [0. . .1]. At the beginning of the algorithm, the direc-tion informadirec-tion for all dimensions is set to 0. If the new solution obtained by using Eq. 4 is better than the old one, the direction information is updated. If the previous value of the dimension is less than the current value, the direc-tion informadirec-tion of this dimension is set to –1, otherwise its direction information of this dimension is set to 1. If the new solution obtained by Eq. 4 is worse than the old one, the direction information of the dimension is set to 0. By this way, the direction information of each dimension of each food source position is used and the local search capa-bility and convergence rate of the algorithm are improved as well [8].
An artificial onlooker bee selects a food source based on the probability value associated with that food source, pi, computed by Eq. 7:
pi= SNf iti ∑ n=1f itn
, (7)
where f iti is the fitness value of the solutioni andSN is the number of food sources.
After onlooker bee phase, if the trial counter is higher than the limit, a new food source position is randomly produced for this bee by using Eq. 4.
3.4.2. Training the ANN by Back-propagation Algorithm
After optimizing the ANN by using the DABC algorithm, the training process is continued with back-propagation al-gorithm to adjust the weights in the steepest descent direc-tion (the most negative of the gradients). The ANN will be initialized with the optimized weights and biases in the first training phase and then back-propagation algorithm will be used to train the ANN for 50 cycles more.
4. Experiments
4.1. Evaluation CriteriaThe proposed approaches were evaluated according to the root mean squared error (RMSE), the mean absolute error
80 60 40 20 0 0 200 400 600 800 1000 RMSE Cycles Wavelet Original
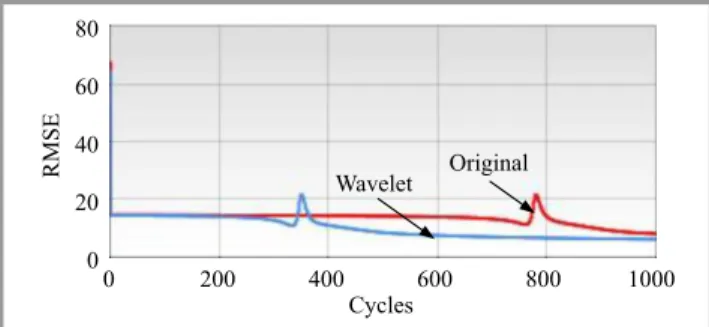
Fig. 4. RMSE of the training process with original data and noise-filtered data (GOOG).
Table 2
RMSE, MAE and MAPE of the training process with original and noise-filtered data
Data RMSE (USD) MAE (USD) MAPE
Company Original Wavelet Original Wavelet Original Wavelet
AAPL 35.94700656 25.80857226 33.21142773 22.27953928 0.0622156017 0.0452399398 YHOO 5.608004908 4.593439167 4.940398152 3.990453741 0.1038292003 0.0846683761 GOOG 6.561397546 6.058494084 5.155632703 4.477504460 0.0096122608 0.0083394975 real original wavelet 580 570 560 550 540 530 520 510
1 Mar 2015 1 Apr 2015 1 May 2015 1 Jun 2015 1 Jul 2015 1 Aug 2015
Fig. 5. Real close prices, close price predicted by ANN on original and noise-filtered data (GOOG).
(MAE) and the mean absolute percentage error (MAPE) criteria. These criteria are defined as :
RMSE= v u u t 1 N· N
∑
j=1 (Oj−Yj)2, (8) MAE= 1 N· N∑
j=1 |Oj−Yj|, (9) MAPE= 1 N· N∑
j=1 Oj−Yj Yj , (10)whereN denotes the size of testing sets.
These criteria measure how the predicted valueOis close to the real valueY. The lower these measures are, the better result is. In this study, three these criteria will be used to assess the performance of the following experiments.
4.2. Test Suites
The experiment system is implemented in C# .NET and evaluated on several historical prices data of different companies including the Apple (AAPL) in period 2009– 2013, Yahoo! (YHOO) in period 2013–2014 and Google (GOOG) in period 3/2014–7/2015. These data were taken from the datasets in [23].
4.3. The Accuracy of the Stock Price Prediction
As mentioned above, Haar Wavelet transform can eliminate noise. Therefore, it is suitable for handling highly irregular data series.
Using these data to train the network is better than the original data containing a lot of jags. The proof of the benefits of using wavelets is showed in Table 2, Figs. 4 and 5. The use of the Wavelet transform gave the lower error value and the faster convergence of neural network weights.
In this work, the DABC algorithm is used to optimize the network weights and biases by minimizing an objec-tive function such as the root mean square error (RMSE)
80 60 40 20 0 0 200 400 600 800 1000 RMSE Cycles Original dABC
Fig. 6. RMSE of the training process with DABC-ANN and ANN without using DABC (GOOG).
Table 3
RMSE, MAE and MAPE of the training process with DABC-ANN and ANN without using DABC
Data RMSE (USD) MAE (USD) MAPE
Company ANN DABC-ANN ANN DABC-ANN ANN DABC-ANN
AAPL 36.69341956 28.51912197 33.61652673 25.43316525 0.0692116977 0.0521619069 YHOO 5.559001606 1.272516355 4.644378052 1.047215288 0.1232102173 0.0259282003 GOOG 6.584116070 5.832372776 5.195642497 4.176874924 0.0093781278 0.0077784335 real original DABC 580 570 560 550 540 530 520 510
1 Mar 2015 1 Apr 2015 1 May 2015 1 Jun 2015 1 Jul 2015 1 Aug 2015
Fig. 7. Real close prices, close price predicted by DABC-ANN and ANN without using DABC (GOOG).
given by Eq. 8. The optimal set of weights and biases found by DABC was used in the next training process of the ANN using back-propagation algorithm. The use of DABC for the optimization of weights and biases gave the lower error value and the faster convergence of neural network weights. Table 3 and Fig. 6 take a proof of the influence of the DABC-ANN model and the ANN (without using the DABC) model. The DABC-ANN gives the lower values through different testing sets. The reduction of values of the criteria given by Eqs. 8–10 is 36.66% on average for three testing data sets. Figure 6 also shows that the RMSE of the DABC-ANN forecasting model converges faster than that of the ANN model. Those figures indicate that the DABC optimization gives the prediction result more accuracy, and it also speeds up the second training stage by reducing the number of training cycles. Figure 7 shows the forecasting results of the DABC-ANN and ANN models and how these prediction values are close to the real values.
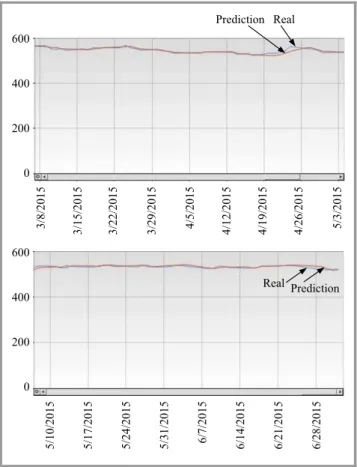
4.4. The Prediction Results of the Proposed Approaches
For more accurate in the evaluation of the ANN, each fact possesses a different proportion of training-validating/test set. For the Google in period 2014–2015, the sub-datasets for the first twelve-month period are used for the training-validating process, while those from 3/2015 to 7/2015 are
selected for testing. With regard to the Apple and Yahoo, the first ten-month period (87%) is used for the training-validating process and the next two-month period for test-ing. The statistical meritorious results of testing process are shown in forecasting figures from Fig. 8 to Fig. 10.
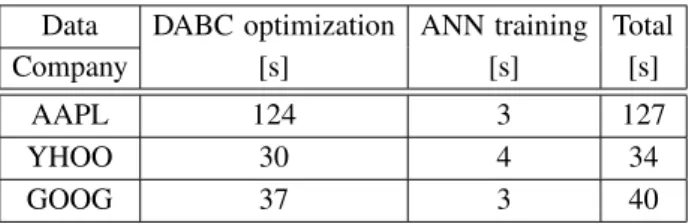
4.5. The Execution Time
In this work, the complexity of algorithms depends on the configuration parameters of DABC algorithm and ANN net-work as well as the size of input values (window sizes). The authors have conducted the experiments and recorded the average time of 20 execution times on each dataset as shown in Table 4. The training data set of Apple is collected in period 2009–2013, Yahoo data set is taken from the period of 2013–2014 and Google data set is in the period from 3/2014 to 7/2015.
Table 4
Execution time of experiments
Data DABC optimization ANN training Total
Company [s] [s] [s]
AAPL 124 3 127
YHOO 30 4 34
600 600 400 400 200 200 0 0 3/8/2015 5/10/2015 3/22/2015 5/24/2015 3/15/2015 5/17/2015 3/29/2015 5/31/2015 4/5/2015 6/7/2015 4/12/2015 6/14/2015 4/19/2015 6/21/2015 4/26/2015 6/28/2015 5/3/2015 Real Prediction Real Prediction
Fig. 8. Testing result of DABC-ANN for Google for period 3/2014–7/2015. 50 40 30 20 10 0 60 40 20 0 1 1/10/2013 1 1/9/2013 1 1/24/2013 1 1/23/2013 12/8/2013 12/7/2013 12/22/2013 12/21/2013 Real Real Prediction Prediction
Fig. 9. Testing result of DABC-ANN for Yahoo for period 2013– 2014. 250 250 350 200 200 300 150 150 100 100 50 50 0 0 1 1/1/2009 1 1/8/2009 1 1/15/2009 1 1/22/2009 1 1/29/2009 12/6/2009 12/13/2009 12/20/2009 12/27/2009 11/7/2010 11/21/2010 12/5/2010 12/19/2010 500 400 300 200 100 0 10/30/2011 11/13/2011 11/11/2012 11/27/2011 11/25/2012 12/11/2011 12/9/2012 12/25/2011 12/23/2012 800 600 400 200 0 600 400 200 0 1 1/3/2013 1 1/10/2013 1 1/17/2013 1 1/24/2013 12/1/2013 12/8/2013 12/15/2013 12/22/2013 12/22/2913 Real Real Real Real Real Prediction Prediction Prediction Prediction Prediction
Fig. 10. Testing result of DABC-ANN for Apple for period 2009–2013.
It can be stated that such computation time might meet the requirements of scalping systems in which length of the time window is 15 minutes or even less in the real world when the proposed approach is applied to the value of time windows being less than 15 minutes.
5. Conclusion
Although artificial neural networks have the positive per-formance in terms of mining non-linear data with self-learning ability, stock forecasting still requires a more reli-able method to integrate a precise training process into the neural networks. This study proposed a hybrid approach of the data preprocessing techniques and optimized algorithms with the multilayer feed-forward neural network trained by back-propagation algorithm to create a predictive model for enhancing the accuracy of stock prediction. Haar wavelet transform utilized to decompose the stock price time-series and eliminate noise. Directed Artificial Bee Colony algo-rithm, which is the improved version of ABC algoalgo-rithm, was used to optimize the weights and biases for the ANN in the first stage of training process.
Though the proposed integrated system has a satisfactory predictive performance, it still has some insufficiencies. Fu-ture work tends to determine the critical impact of specific fundamental analysis variables on the quality of the stock price prediction. In addition, a more advanced pattern se-lection scheme might be embedded in the system to retrieve significant patterns from the data.
It can be seen that the prediction process of stock prices is usually affected by 4 factors including open, close, high, and low prices, in which the close price was used in this study with the promising results. In reality, open price is not used very often, however low and high price may be crucial, so authors will consider the using these two values in the further studies. This work employed 30-to-1 model that means using 30 recent days to forecast the next day. This value seems to work quite well, but in some different technical analysis indicators the value of 14 is commonly used for the window size. Therefore, we plan to carry out many experiments to assess the influence of window sizes on the accuracy of the stock price prediction problem.
References
[1] G. Marketos, K. Pediaditakis, Y. Theodoridis, and B. Theodoulidis, “Intelligent stock market assistant using temporal data mining”, in Proc. 10th Panhellenics Conf. Inform. PCI05, Volos, Greece, 2005.
[2] T. H. Roh, “Forecasting the volatility of stock price index”,Expert Syst. with Appl., vol. 33, no. 4, pp. 916–922, 2007.
[3] Q. Yang and Y. Wu, “10 challenging problems in data mining re-search”,Int. J. Inform. Technol. & Decision Making, vol. 5, no. 4, pp. 597–604, 2006.
[4] A. Adebiyi, C. Ayo, M. O. Adebiyi, and S. Otokiti, “Stock Price Pre-diction using Neural Network with Hybridized Market Indicators”, J. Emerg. Trends in Comput. & Inform. Sci., vol. 3, no. 1, pp. 1–9, 2012.
[5] I. El-Henawy, A. Kamal, H. Abdelbary, and A. Abas, “Predicting stock index using neural network combined with evolutionary com-putation methods”, inProc. 7th Int. Conf. Inform. & Syst INFOS 2010, Cairo, Egypt, 2010.
[6] T. J. Hsieh, H. F. Hsiao, and W. C. Yeh, “Forecasting stock markets using wavelet transforms and recurrent neural networks: An inte-grated system based on artificial bee colony algorithm”,Appli. Soft Comput., vol. 11, no. 2, pp. 2510–2525, 2011.
[7] E. Nourani, A. M. Rahmani, and A. H. Navin, “Forecasting stock prices using a hybrid artificial bee colony based neural network”, inProc. Int. Conf. Innov. Manag. & Technol. Res. ICIMTR 2012, Malacca, Malaysia, 2012, pp. 486–490.
[8] M. S. Kiran and O. Findik, “A directed artificial bee colony algo-rithm”,Appl. Soft Comput., vol. 26, pp. 454–462, 2015.
[9] J. B. Ramsey, “The contribution of wavelets to the analysis of eco-nomic and financial data”,Philosoph. Trans. Royal Soc. of London A: Mathem., Phys. & Engin. Sci., vol. 357, no. 1760, pp. 2593–2606, 1999.
[10] D. Karaboga and B. Basturk, “A powerful and efficient algo-rithm for numerical function optimization: artificial bee colony (ABC) algorithm”,J. Global Optimiz., vol. 39, no. 3, pp. 459–471, 2007.
[11] S. H. Kim and S. H. Chun, “Graded forecasting using an array of bipolar predictions: application of probabilistic neural networks to a stock market index”,Int. J. Forecast., vol. 14, no. 3, pp. 323–337, 1998.
[12] H. N. Hao, “Notice of Retraction Short-term forecasting of stock price based on genetic-neural network”, inProc. 6th Int. Conf. Nat. Comput. ICNC 2010, Yantai, China, 2010, pp. 1838–1841. [13] H. Huang, M. Pasquier, and C. Quek, “Financial market trading
system with a hierarchical coevolutionary fuzzy predictive model”, IEEE Trans. Evolut. Comput., vol. 13, no. 1, pp. 56–70, 2009. [14] M. E. Abdual-Salam, H. M. Abdul-Kader, and W. F. Abdel-Wahed,
“Comparative study between Differential Evolution and Particle Swarm Optimization algorithms in training of feed-forward neural network for stock price prediction”, inProc. 7th Int. Conf. Inform. & Syst. INFOS 2010, Cairo, Egypt, 2010.
[15] K. J. Kim and I. Han, “Genetic algorithms approach to feature dis-cretization in artificial neural networks for the prediction of stock price index”,Expert Syst. with Appl., vol. 19, no. 2, pp. 125–132, 2000.
[16] J. Kishikawa and S. Tokinaga, “Realization of feature descriptive systems for clusters by using rule generations based on the genetic programming and its applications”, IEICE Trans. Fundament. of Electron., Commun. & Comp. Sci., vol. 89, no. 12, pp. 2627–2635, 2000.
[17] G. Cybenko, “Approximation by superpositions of a sigmoidal func-tion”,Mathem. of Control, Sig. & Syst., vol. 2, no. 4, pp. 303–314, 1989.
[18] S. Shen, H. Jiang, and T. Zhang, “Stock market forecasting using machine learning algorithms”, Tech. Rep., Department of Electrical Engineering Stanford University, Stanford, CA, USA, 2012. [19] G. Orr, N. Schraudolph, and F. Cummins, “Overfitting and
regular-ization” [Online]. Available: http://www.willamette.edu/∼gorr/ classes/cs449/overfitting.html (accessed Oct. 11, 2015).
[20] K. Hornik, M. Stinchcombe, and H. White, “Multilayer feed-forward networks are universal approximators”,Neur. Netw., vol. 2, no. 5, pp. 359–366, 1989.
[21] H. Takaho, T. Arai, T. Otake, and M. Tanaka, “Prediction of the next stock price using neural network for data mining”, inProc. Int. Symp. Non-Linear Theory & its Appl. NOLTA 2002, Xi’an, China, 2002, pp. 411–414.
[22] A. Omidi, E. Nourani, and M. Jalili, “Forecasting stock prices us-ing financial data minus-ing and Neural Network”, inProc. 3rd Int. Conf. Comp. Res. & Develop. ICCRD 2011, Shanghai, China, 2011, pp. 242–246.
[23] Yahoo Finance [Online]. Available: http://finance.yahoo.com/ (ac-cessed Oct. 20, 2015).
Thanh Tung Khuatcompleted the B.Sc. degree in Software Engineering from University of Science and Technology, Da-nang, Vietnam, in 2014. Cur-rently, he is participating in the research team at DATIC Lab-oratory, University of Science and Technology, Danang. His research interests focus on soft-ware engineering, softsoft-ware test-ing, evolutionary computation, intelligent optimization techniques and applications in software engineering. E-mail: [email protected]
The University of Danang
University of Science and Technology 54 Nguyen Luong Bang, Lien Chieu Danang, Vietnam
Quang Chanh Le is a
final-year student at the University of Danang, University of Science and Technology. He is doing the final-year project with the topic “Applying Artificial Neural Networks and nature-inspired algorithms for predicting the stock price”.
E-mail: [email protected] The University of Danang
University of Science and Technology 54 Nguyen Luong Bang, Lien Chieu Danang, Vietnam
Bich Loan Nguyen is a
final-year student at the University of Danang, University of Science and Technology. She is doing the final-year project with the topic ”Applying Fuzzy Logic and nature-inspired algorithms for predicting the stock price”.
E-mail: [email protected] The University of Danang
University of Science and Technology 54 Nguyen Luong Bang, Lien Chieu Danang, Vietnam
My Hanh Leis currently a
lec-turer of the Information Tech-nology Faculty, University of Science and Technology, Da-nang, Vietnam. She gained the M.Sc. degree in 2004 and the Ph.D. degree in Computer Sci-ence at the University of Da-nang in 2016. Her research in-terests are about software test-ing and more generally applica-tion of heuristic techniques to problems in software engi-neering.
E-mail: [email protected] The University of Danang
University of Science and Technology 54 Nguyen Luong Bang, Lien Chieu Danang, Vietnam