PROTEIN FUNCTION PREDICTION BY INTEGRATING SEQUENCE, STRUCTURE AND BINDING AFFINITY INFORMATION
Huiying Zhao
Submitted to the faculty of the University Graduate School in partial fulfillment of the requirements
for the degree Doctor of Philosophy in the School of Informatics,
Accepted by the Faculty of Indiana University, in partial fulfillment of the requirements for the degree of Doctor of Philosophy.
Doctoral Committee
May 3, 2013
Yunlong Liu, PhD, Chair
Samy Meroueh, PhD
Sarath Chandra Janga, PhD
c 2013 Huiying Zhao
Acknowledgements
I would never have been able to finish my dissertation without the guidance of my committee members, help from friends, and support from my family.
I would like to express my deepest gratitude to my advisor, Prof Yaoqi Zhou, for his excellent guidance, caring, patience, and providing me with an excellent atmosphere for doing research.
To my committee members Profs Yunlong Liu, Samy Meroueh, and Sarath Chandra Janga for their encouraging words, thoughtful criticisms, and time and attentions during busy semesters.
To my colleagues for sharing their enthusiasm for and comments on my work: Ms Zhixiu Li, and Drs Jian Zhan, Yuedong Yang, Tuo Zhang, Liang Dai, Eshel Faraggi, Wenchang Xiang, Shesheng Zhang, Beisi Xu, Jihua Wang, Md Tamjdul Hogue, et al.
Finally to my family for their love, support and understanding during the long years of my education.
Huiying Zhao
PROTEIN FUNCTION PREDICTION BY INTEGRATING SEQUENCE, STRUCTURE AND BINDING AFFINITY INFORMATION
Proteins are nano-machines that work inside every living organism. Functional disruption of one or several proteins is the cause for many diseases. However, the functions for most proteins are yet to be annotated because inexpensive sequencing techniques dramatically speed up discovery of new protein sequences (265 million and counting) and experimental examinations of every protein in all its possible functional categories are simply impractical. Thus, it is necessary to develop computational function-prediction tools that complement and guide experimental studies. In this study, we developed a series of predictors for highly accurate prediction of proteins with DNA-binding, RNA-binding and carbohydrate-binding capability. These predictors are a template-based technique that combines sequence and structural information with predicted binding affinity. Both sequence and structure-based approaches were developed. Results indicate the importance of binding affinity prediction for improving sensitivity and precision of function prediction. Application of these methods to the human genome and structure genome targets demonstrated its usefulness in annotating proteins of unknown functions and discovering moon-lighting proteins with DNA, RNA, or carbohydrate binding function. In addition, we also investigated disruption of protein functions by naturally occurring genetic variations due to insertions and deletions (INDELS). We found that protein structures are the most critical features in recognising disease-causing non-frame shifting INDELs. The predictors for function predictions are available at http://sparks-lab.org/spot, and the predictor for classification of non-frame shifting INDELs is available at http://sparks-lab.org/ddig.
Contents
List of Tables . . . xiv
List of Figures . . . xvi
1 Introduction . . . . 1
1.1 Proteins and their functions . . . 1
1.1.1 Proteins . . . 1
1.1.2 Protein function through binding . . . 2
1.2 Annotation of protein functions . . . 3
1.2.1 Experimental approaches for detection of protein functions . . . 3
1.2.2 Computational approaches for prediction of protein functions . . 4
1.3 Prediction of protein functions by a template-based method . . . 5
1.3.1 Structure comparison . . . 6
1.3.2 Structure prediction . . . 7
1.3.3 Energy function for calculation of Binding affinity . . . 8
1.4 Overview of the dissertation . . . 9
2 Structure-based prediction of DNA-binding proteins by structural alignment and a volume-fraction corrected DFIRE-based energy function 11 Abstract . . . 11
2.1 Introduction . . . 11
2.2 Methods . . . 13
2.2.1 Datasets . . . 13
2.2.2 Knowledge-based energy function . . . 14
2.2.3 Training of the method for predicting DNA-binding proteins . . 15
2.2.4 Evaluation of the method for predicting DNA-binding proteins . 16 2.3 Results . . . 16
2.3.2 TM-Score dependent energy threshold (DDNA3O) . . . 18
2.3.3 Test by the APO104/HOLO104 datasets . . . 20
2.3.4 Test by the DB71 dataset . . . 23
2.3.5 The effect of a larger, updated dataset of DNA-binding proteins (DDNA3U) . . . 24
2.3.6 Application to Structural Genomics Targets . . . 25
2.4 Discussion . . . 26
3 Sequence-based prediction of DNA-binding proteins by fold recognition and calculated binding affinity . . . . 30
Abstract . . . 30
3.1 Introduction . . . 30
3.2 Methods . . . 33
3.2.1 Dataset . . . 33
3.2.2 Function prediction protocol . . . 33
3.2.3 Other Methods . . . 34
3.3 Results . . . 34
3.3.1 Low-reolution two-state prediction . . . 34
3.3.2 Medium Resolution Prediction of DNA-binding residues . . . . 37
3.3.3 High Resolution Prediction of DNA-binding Complex Structures 38 3.3.4 Independent test . . . 39
3.3.5 Experimental Validation on human TFs . . . 39
3.3.6 Application to human genome . . . 40
4 Template-based Prediction of RNA-binding Domains and RNA-binding Sites and Application to Structural Genomics Targets . . . . 43
Abstract . . . 43
4.1 Introduction . . . 44
4.2 Methods . . . 46
4.2.2 Knowledge-based energy function . . . 48
4.2.3 Prediction protocol . . . 49
4.2.4 Performance Evaluation . . . 49
4.3 Results . . . 50
4.3.1 Using structural similarity measured by TM-Score for discrimination . . . 50
4.3.2 Using relative structural similarity measured by Z-Score for discrimination . . . 51
4.3.3 Combined with the DRNA binding energy score for discrimination 52 4.3.4 Methods Comparison . . . 53
4.3.5 Test on APO75/HOLO75 datasets . . . 53
4.3.6 Binding sites prediction . . . 54
4.3.7 Discriminate against DNA-binding proteins . . . 55
4.3.8 Application to RRM superfamily . . . 55
4.3.9 Application to structural genomics targets . . . 55
4.4 Discussion . . . 57
5 Highly accurate and high-resolution function prediction of RNA binding proteins by fold recognition and binding affinity prediction . . . . 61
Abstract . . . 61
5.1 Introduction . . . 61
5.2 Methods . . . 64
5.2.1 Function Prediction Protocol . . . 64
5.2.2 Template Library . . . 66
5.2.3 Cross Validation Datasets . . . 67
5.2.4 Expanded Template Library and Independent Test Set . . . 67
5.2.5 Performance Evaluation . . . 68
5.2.6 Other Methods and Threshold Optimizations . . . 68
5.3 Results . . . 69
5.3.2 Medium Resolution Binding-Residue Prediction. . . 72
5.3.3 High resolution prediction of binding RNA types. . . 73
5.3.4 The highest resolution: Protein-RNA Complex Structure . . . . 75
5.3.5 Discrimination against DNA binding proteins . . . 76
5.3.6 Effect of the Expanded Template Library . . . 76
5.3.7 Independent Test on RB-IC257 . . . 78
5.4 Discussions . . . 79
6 Charting the unexplored RNA-binding protein atlas of the human genome by combining structure and binding predictions . . . . 81
Abstract . . . 81
6.1 Background . . . 82
6.2 Materials and Methods . . . 83
6.3 Results . . . 84
6.3.1 Application of SPOT-Seq to human genome . . . 84
6.3.2 Molecular functions related to 1848 moonlighting RNA-binding proteins . . . 86
6.3.3 Validation of predicted novel RBPs by proteomic studies of human HeLa cells. . . 89
6.3.4 Disease pathways associated with predicted RBPs . . . 90
6.3.5 Disease-causing SNPs associated with predicted RBPs. . . 91
6.4 Discussions . . . 93
7 Prediction of RNA binding proteins comes of age from low resolution to high resolution . . . . 96
Abstract . . . 96
7.1 Introduction . . . 96
7.2 Function Prediction in different resolutions. . . 98 7.2.1 Low Resolution Function Prediction: Two-State RBP Prediction. 98
7.2.2 Medium Resolution Function Prediction: Binding Residues
Prediction . . . 103
7.2.3 High-Resolution Function Prediction: Binding RNA Type Prediction . . . 106
7.2.4 Highest Resolution Function Prediction: Protein-RNA Complex Structure Prediction . . . 107
7.3 Summary and Outlook . . . 109
8 Structure-based prediction of carbohydrate-binding proteins, binding residues and complex structures by a template-based approach . . . 110
8.1 Introduction . . . 110
8.2 Methods and Materials . . . 112
8.2.1 Datasets . . . 112
8.2.2 DFIRE-based energy function for protein-carbohydrate interactions . . . 113
8.2.3 Prediction protocol . . . 113
8.3 Results . . . 114
8.3.1 SPalign for CBP prediction . . . 114
8.3.2 Combining SP-align with DFIRE-based energy function . . . . 115
8.3.3 The effect of bound/unbound structures on CBP prediction (APO/HOLO dataset) . . . 116
8.3.4 Binding sites prediction . . . 117
8.3.5 Application to structural genomics targets . . . 118
9 Discriminating between disease-causing and neutral non-frameshifting micro-INDELs by SVM and integration of sequence- and structure-based features . . . 119
Abstract . . . 119
9.1 Introduction . . . 119
9.2.1 Structural and Sequence Features. . . 126
9.2.2 Training and Cross-validation . . . 129
9.2.3 Feature Selections. . . 129
9.3 Results . . . 129
9.3.1 Single feature performance . . . 129
9.3.2 SVM for Microdeletions only . . . 131
9.3.3 SVM for Microinsertions only . . . 134
9.3.4 SVM for both Microinsertions and Microdeletions . . . 135
9.3.5 Effect of Homologous Sequences. . . 136
9.3.6 Minor allele frequency . . . 136
9.4 Discussions . . . 137
10 Conclusion . . . 143
References . . . 145
List of Tables
2.1 Optimized TM-score-dependent energy thresholds based on DB179 and NB3797 (DDNA3O) . . . 18 2.2 Targets predicted as DNA-binding on HOLO set but not on APO set. . 22 2.3 Structural Genomics targets (SG1697) predicated as DNA-binding
proteins by DBD-Hunter, DDNA3, and DDNA3O. . . 25 2.4 Targets are predicted as DNA-binding proteins by DDNA3O from
SG1697 and SG2235 with function based on GO annotations. . . 27 3.1 Method comparison for prediction of DNA-binding proteins . . . 35 3.2 Detecting DBPs in 19 fold shared by DNA-binding (DB179) and
non-binding (NB-3797) proteins . . . 36 3.3 Number of annotated and predicted DBPs in human genome . . . 40 3.4 Structure similarity between predicted and native structures of novel
DBPs . . . 41 4.1 Targets are predicted as RNA-binding on HOLO set but not on APO set. 54 4.2 Structural Genomics targets (SG2076) predicated as RNA-binding
proteins . . . 56 5.1 Methods comparison for predicting of RNA-binding proteins . . . 70 5.2 Examination of 44 SCOP folds shared by both RNA-binding
(RB-C174) and nonbinding (NB-C5765) proteins. . . 71 5.3 Mis-predicted binding types for tRNA, mRNA and rRNA-binding
proteins. . . 74 5.4 SPOT-Seq performance for an expanded template library and an
independent test . . . 77 6.1 The number of annotated RBPs according to keywords, compared to the
6.2 Top 10 templates employed for all predicted human RBPs. . . 86 6.3 GO terms in molecular function that are unique in annotated or
predicted RBPs and/or shared between them. . . 87 6.4 Top 10 GO IDs enriched with annotated and predicted RBPs, ranked
according to the number of annotated RBPs . . . 88 6.5 Number of proteins and RBPs involved in 11 different phenotypes . . . 90 6.6 Predicted novel RBPs in MutDB and their interactions with annotated
RBPs . . . 91 6.7 Predicted and annotated SNPs in RNA-binding region . . . 92 7.1 Structure and sequence-based features for RBP prediction . . . 100 7.2 Comparison of methods for low-resolution, two-state RBP prediction . 102 7.3 Structure and sequence-based features for RNA-binding residue
prediciton . . . 104 7.4 The performances of structure and sequence-based methods for
predicting RNA-binding residues for three domain datsets(RB106, TP67, RB20) . . . 106 8.1 Performance of PSI-BLAST, SPalign, and SPOT-Stuc for DB122 and
NB2987 based on leave-homolog-out cross validation . . . 115 8.2 Structural genome targets predicted as CBPs . . . 118 9.1 List of all features considered. . . 122 9.2 Top five performing features for microdeletion and microinsertion
discrimination. . . 130 9.3 List of selected features for different training sets . . . 132
List of Figures
2.1 ROC comparison . . . 17
2.2 Energy threhold versus TM-score . . . 20
2.3 Structural comparison between APO/HOLO with templates for targets without significant changes . . . 21
2.4 Structural comparison between APO/HOLO with templates for targets with significant changes . . . 22
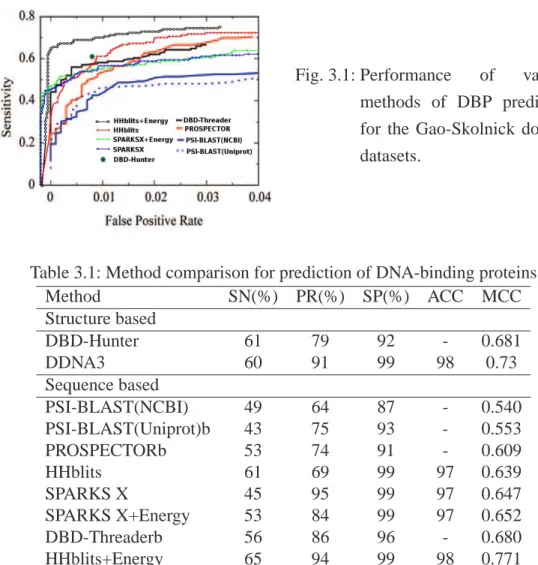
3.1 Performance of various methods of DBP prediction for the Gao-Skolnick domain datasets . . . 35
3.2 MCC values Vs.prediction DNA-binding residues . . . 38
3.3 Comparison of predicted and native structures . . . 39
4.1 Distribution of the top TM-score-ranked templates on RB212/NB6761 . 50 4.2 Distribution of the top Z-score-ranked templates on RB212/NB6761 . . 52
4.3 ROC comparison . . . 53
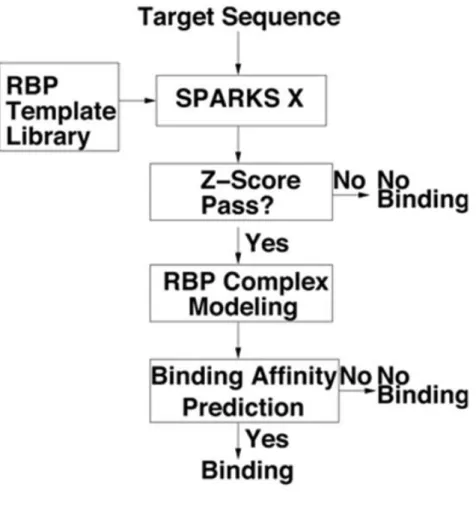
5.1 The flow diagram of the sequence-based function prediction of RBP . . 65
5.2 ROC comparisons . . . 70
5.3 Medium resolution prediction of RNA-binding sites . . . 73
5.4 Comparison between the predicted and actual complex structure . . . . 74
6.1 A pie diagram for annotated RBPs, unknown proteins and proteins with other functions. . . 86
6.2 The connection between proteins with four GO terms . . . 88
6.3 Aminoacyl-tRNA biosynthesis pathway . . . 91
6.4 Predicted complex structure for novel RBP, vinculin . . . 93
7.1 Number of Protein-RNA complex structures deposited in protein data banks since 2001 . . . 97
7.2 The ROC curves for several RBP predictors. . . 102 7.3 Performance of RNA-binding prediciton by several sequence and
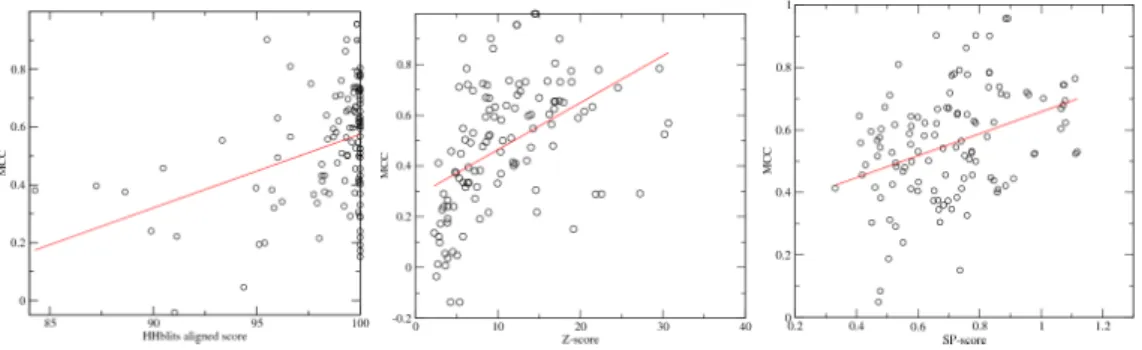
structure-based techniques as labeled. . . 105 7.4 Comparison between the predicted/actual structure and binding residues 108 8.1 Distributions of top SP-score ranked templates . . . 115 8.2 ROC comparison . . . 116 8.3 Comparison of predicted and native binding residues for target 2j1uA . 117 9.1 Distributions of the average DNA conservation score from phyloP,
ASA, and the average disorder probability . . . 133 9.2 The ROC curves for the microdeletion and microinsertion sets . . . 134 9.3 The average predicted disease-causing probabilities along the average
allele frequency . . . 137 9.4 Ten-fold MCC along SVM parameters and half window size . . . 140
Chapter 1 Introduction
1.1 Proteins and their functions 1.1.1 Proteins
Proteins are large biological molecules consisting of amino acids. They play a vast array of functions within living organisms. Proteins are different from each other by their sequences and three-dimensional structural properties. A protein sequence is a series of letters that describe the amino acid composition of protein. Currently, there are two major direct methods, mass spectrometry [1] and Edman degradation [2], for determination of protein sequences. It is also possible to utilize next generation sequencing technique to obtain the DNA/mRNA sequence that codes the protein sequence.
Proteins perform their functions with help of their molecular structures. Protein structures can be divided into four levels: primary structure, secondary structure, tertiary structure and quaternary structure. Primary structure refers to linear amino-acid sequence of the polypeptide chain. The primary structure is held together by covalent peptide bonds, which are formed during the process of protein biosynthesis or translation. Protein secondary structure refers to regular protein backbone sub-structure. There are three main types of secondary structures: alpha helix, beta strand, and coil [3]. Both alpha helix and beta sheet represent conformations that connect hydrogen bond donors with acceptors in the peptide backbone. Tertiary structure refers to three-dimensional (3D) structure of a single protein molecule. The 3D structure of a protein is formed by protein folding process. In this process, a polypeptide folds into its characteristic and functional 3D structures from a random coil. The folding process is driven by non-specific hydrophobic interactions and hydrogen bonds. During protein folding, protein structure becomes stable when the structure reaches global minimum of free energy. Quaternary structure is made of multiple subunits of 3D structures. Protein structures are often referred as structural domains to distinguish
from intrinsically disordered regions. A structure domain is an element of the overall structure of a protein. Protein domains can evolve, function and exist independently of the rest part of the protein. One protein may contain several domains, and each domain can perform multiple functions.
1.1.2 Protein function through binding
Proteins are one of the most important molecular machines in the living organism. Proteins contain half the dry weight of an Esherichia coli cell [4]. Most of the biological processes are related with protein activity. Protein functions include enzyme catalysis, interaction with other molecules, supporting materials, etc. Among these functions, the interaction with other molecules are contributed by their ability to bind with molecule partners. The residues in a protein that bind with other molecule are called as binding sites. The binding ability of a protein is mainly determined by the binding sites on protein surface [5].
Proteins can bind to DNA and form protein-DNA complexes (DBP) [6]. These proteins are composed of DNA-binding domains and have binding affinity for either single or double stranded DNA. DNA-binding proteins play essential roles in transcription, regulation, replication, packaging repair and rearrangement. For example, transcription factors modulate the process of transcription; nucleases cleave DNA molecules; and histones are involved in chromosome packaging and transcription in the cell nucleus.
RNA-binding proteins (RBP) are another class of important proteins through binding to RNA in cells and forming ribonucleoprotein complexes. RNA-binding proteins are important in translation regulation and post-transcriptional processing of pre-mRNA including RNA splicing, editing and polyadenylation. They play critical roles in the biogenesis, stability, transport and cellular localization [7,8]. RNA-binding proteins can specifically recognize their RNA targets by complementary shapes. Three most widely studied RNA-binding domains include double-stranded RNA-binding motif (dsRBM), RNA-recognition motif (RRM) and zinc fingers.
Carbohydrate-binding proteins (CBPs) are functional proteins that recognize cell-surface carbohydrates. CBPs are important for immune systems. For example, viruses can use carbohydrates to attach themselves to the host cell during infection. On the other hand, host CBPs can also recognize these carbohydrates and prevent virus invasion. Therefore, CBPs have been employed as potential drug targets in pathogens.
Proteins can also bind to other partners. For example, iron-binding proteins are important in metabolism. Their binding with iron can inhibit microbial growth. Furthermore, proteins can bind to other proteins to regulate enzymatic activity, control progression through the cell cycle and allow the assembly of large protein complexes.
1.2 Annotation of protein functions
1.2.1 Experimental approaches for detection of protein functions
There are many studies to detect protein-DNA interaction experimentally. Recent strategies relied on sophisticated mass spectrometry technologies. Washburn and Fournier published their work on identification of DBPs by pulldown experiments in conjunction with multi-dimensional protein identification technology (MudPIT) [9,10]. Other standard methods include EMSA, DNAasa I footprinting, exonuclease III footprinting, southwestern blotting and others [11]. However, experimental approaches face many challenges. For example, both EMSA and DNase I footprinting methods are usually combined together to improve experimental accuracy [12]. Unfortunately, many DNA-binding proteins can only be detected by one type of assay. Thus, the detection is not guaranteed for those proteins which can only be recognized by one assay.
Similar to identifications of DBPs, most frequently used methods for RBPs are protein microarray [13] and mass spectrometry [14,15]. Protein microarray and RNA probes have been used to identify a limited number of RBPs. As an alternative to in vitro approaches, stable isotope labeling by amino acids in cell culture and mass spectrometry were applied to identify the interaction between protein and RNA [16]. More recently, a fluorescence-based quantitative method has been developed to monitor mRNA-protein interactions, and 300 new RDPs were uncovered [17].
For experimentally detecting CBPs, there are three most commonly used approaches: X-ray [18], NMR [19,20] and fluorescence spectroscopy [19] studies [21].
1.2.2 Computational approaches for prediction of protein functions
While experimental techniques for determining protein functions are less likely to produce false positives, they are time consuming and expensive. More importantly, the number of protein sequences are exponentially increasing with the development of next generation sequencing technology. There is a widening gap between the number of proteins with annotated functions and the number of protein with known sequences. Meanwhile, the structure genome project generated a large number of structures without known function. Therefore, it is necessary to develop effective computational approaches for predicting protein functions from their structures or sequences.
Historically, commonly used approaches for prediction of protein functions are based on sequence/structure homology [22–26]. The assumption is that similar sequence/structure encodes similar function. However, this assumption is only partially true for highly homologous proteins, while most proteins don’t have homologous proteins with known functions. Thus, it is necessary to develop an alternative approach for more sensitive protein function detection.
Currently, the most widely-used methods for prediction of protein functions are machine-learning based methods, which usually employ sequence or structure features of proteins to train classifiers for protein function prediction. For example, several sequence-based classifiers for DBP/RBP prediction were based on support-vector machine (SVM) [27,28]. Common features in these predictors include amino acid composition, solvent accessible surface, hydrophobicity, conjoint triad [29], position specific scoring matrices (PSSM), and interface propensities [30]. There is only one published method for prediction of CBPs from sequence. This method employed sequence patterns and frequencies of three neighboring amino acids as input features for SVM.
Although machine learning-based methods have achieved reasonable accuracies in prediction of protein functions, they have several limitations. First, their performance decrease significantly when they are applied to real large scale database because the methods are typically trained on datasets with a small, equal number of positive and negative cases. Furthermore, machine-learning based methods can only provide binary prediction without information of 3D complex structures. Methods for predicting binding sites are separate from those methods for predicting functions. A more recent approach is to utilize protein template structure. Such template-based methods perform structure comparison to determine target function. For targets having sequence information only, structure prediction tools were employed. For each structurally similar template protein, a model complex structure can be generated by modeling the target protein structure (template-based predicted structure in absence of experimental structure) and its binding partner from the template complex. For these model complex structures, binding affinity will be predicted, and only those having high binding affinity will be kept. Thus, a template-based method considers not only the structural similarity but also the interaction strength between the target protein and its potential binding partner. Moreover, the template-based method is able to predict binding residues and complex structures in addition to binary function prediction.
1.3 Prediction of protein functions by a template-based method
The first template-based method was developed for predicting DNA-binding proteins [31] from structure. This method was later improved by replacing the contact-based energy function to DDNA3 [32], a more accurate all-atom, DFIRE [33] -derived energy function. This approach was extended to the prediction of RNA-binding proteins from structure [34]. In addition, the template-based method using sequence only has also been developed. In this method, the target structure was predicted by recognizing correct structural templates from proteins with known structures in PDB. The confidence of prediction was evaluated by sequence to structure matching Z-score
[35,36]. Several techniques utilized by the template-based approaches are described as following.
1.3.1 Structure comparison
Structure comparison is a useful method for detecting proteins with similar functions in the absence of sequence similarity. Different from sequence comparison, structure comparison employs structure alignment and attempts to establish the homology between two protein structures from their shapes and 3D conformations. This procedure relies on protein tertiary structures. Structure alignment is useful for prediction of protein functions because protein structures are more conserved than their sequences [37], and many proteins with similar functions may converge to similar structure during evolution. Therefore, structure alignment has been an active research area for more than 30 years. Currently, there are more than 50 published computational methods [38,39].
Critical difference between various structure alignment methods is the scoring function that measures structural similarity. Structure similarity is often evaluated by root-mean-square deviation (RMSD). The RMSD between two aligned structures indicates their divergence from one another. However, RMSD is strongly dependent on protein size and radius of gyration, and very sensitive to poorly aligned local regions [40]. Zhang and Skolnick developed TM-score to remove the dependence of structure similarity score on protein sizes, and later applied to structure alignment [41]. The score is based on LG-score with an empirical size-dependentd0 [= 1.24(L−13)1/3 −1.8]. However, this score assumes that proteins are globular and aligned in a predetermined sizeL.
To further remove the size dependence, SP-align was developed by us [42]. This method was proposed by introducing an effective alignment length that avoids the need to pre-specify a length for normalization. The function is defined as
SP−score = 1 3L1−αMax X rij<2d0 ( 1 1 +r2 ij/d20 − 0.2) (1.1)
, wheredijis the distance betweenCαatoms of two aligned residues,d0was chosen 4.0
˚
A somewhat in between 3.5 ˚A in MaxSub and 5 ˚A in LG score,αis a to-be-determined parameter for removing the dependence on protein length L, a constant of 0.2 is used for a smooth cutoff for SP-score at dij = 2d0, and a factor of 1/3 is used to scale the
threshold for fold discrimination to around 0.5. The new score (SP-score) with its alignment method (SP-align) was tested in structure classification and prediction of nucleic-acid binding proteins with comparison to several established methods: DALI, CE, and TMalign. The comparison indicates that SP-align consistently improves over other methods.
1.3.2 Structure prediction
Structure prediction attempts to predict protein structure from a given query sequence. The most reliable structure-prediction technique is to match with existing known structure templates. Such template-based modeling becomes increasingly powerful because most popular structural folds are known [43,44]. However, it is still challenging to recognize structurally similar templates as revealed from the critical assessment of structure prediction (CASP). Past CASP experiments highlighted the importance of post treatment of models predicted by individual fold-recognition methods through the use of consensus predictions. Recently developed new methods include combining fragment and template comparison [45], utilizing non-linear scoring function from conditional random field model and profile entropy [46], employing predicted torsion angles and combined use of profile-profile alignment and pairwise and solvation potentials [47,48]. One common issue in the above methods is that matching predicted 1D profiles of query sequence with actual profiles of templates is based on simple matrices, without accounting for the probability of errors in predicted 1D structural properties. SPARKS-X [49] introduced energy terms based on estimating the matching probability between target and template. This method also takes advantage of recently improved torsion angle predictor, SPINE-X [50] in prediction of secondary structure. The
matching score calculation of SPARKS-X was described as Eq.1.2. S(i, j) = − 1 200[F seq query(i)·M seq template(j) +F seq
template(j)·Mqueryseq (i)]
+w1E(SSt(i)|SSq(j), CSS,q(j)) +P4
k=2wkE(∆kij|Ck,q(j)) +sshift. (1.2)
with weight parameters (wk) and a constant shiftsshift. The first term in Eq. (1.2) is the profile-profile comparison between the sequence profile from the query sequence, Mtemplateseq (j) and Mseq
query(i) are the sequence-derived log-odd profile of the template sequence and that of query sequence, respectively. These sequence profiles are constructed by three iterations of PSIBLAST searching (E value cutoff of 0.001) against non-redundant (NR) sequence database, which was filtered to remove low-complexity regions, transmembrane regions, and coiled-coil segments. The second term in Eq. (1.2) measures the difference between the predicted secondary structure and the actual secondary structure of the template. The third term in Eq. (1.2) measures the difference
∆k
ij between two other predicted 1D structural properties of the query sequence and the
actual properties of the template [real-value torsion angles (φ/ψ) and real-value solvent accessibility].
SPARKS-X was tested on several benchmarks and compared to other automatic servers. All the results indicate that SPARKS-X is one of the best single-method fold-recognition servers. Given the robust performance of SPARKS-X, it was employed as a structure prediction tool for predicting protein functions.
1.3.3 Energy function for calculation of Binding affinity
An energy function describes physical interactions between a protein and its binding partner. A knowledge-based energy function is obtained from statistical analysis of structures. Different knowledge-based energy functions are mainly different from their definitions of a reference state. The DFIRE energy function (Eq. 2.1) defines the reference state based on ideal gas mixture (rα) with α < 2 to account for the
finite-size effect [33]. Several knowledge-based energy functions were developed for protein-DNA interactions. For example, a residue base-level energy function was proposed to calculate the protein-DNA interaction [51]; atom-level energy functions were developed by extending the DFIRE to protein-DNA binding affinity calculation [52]. The DFIRE energy function was further improved by adding a volume fraction correction [32,53]. Similarly, an energy function for protein-RNA interaction [34,36] and protein-carbohydrate interaction (In preparation) were derived. A DFIRE-based potential satisfies the following equation:
uDFIREi,j (r) = −RTln Nobs(i,j,r) (rcutr )α( ∆r
∆rcut)Nobs(i,j,rcut)
, r < rcut,
0, r≥rcut,
(1.3)
where R is the gas constant,T = 300K,α= 1.61,Nobs(i, j, r)is the number ofijpairs
within the spherical shell at distance r observed in a given structure database,rcut is the
cutoff distance,∆rcutis the bin width atrcut. The value ofα(1.61)was determined by
the best fit ofrα to the actual distance-dependent number of ideal-gas points in finite
protein-size spheres.
1.4 Overview of the dissertation
As described above, a template-based approach is a powerful and reliable approach for prediction of protein functions. This dissertation mainly focuses on development of template-based approaches for prediction of DNA-binding proteins, RNA-binding proteins, and carbohydrate-binding proteins. How to fully utilize protein structural information is a critical point for template-based approaches. In addition to protein function prediction, we also predict function disruption due to insertions and deletions of bases in the human genome.
This dissertation can be divided into four parts. The first part is prediction of DNA-binding proteins based on structures (chapter 2) and sequences (chapter 3). The second part contains four chapters that includes the prediction of RBPs from
method of RBPs to the human genome (chapter 6), and the review of current status of RBPs prediction from low to the highest resolution (chapter 7). The third part is the prediction of CBPs from their structures (chapter8). The final part is the classification of disease-related non-frame shifting insertion/deletions of bases in the human genome (chapter9).
Chapter 2 Structure-based prediction of DNA-binding proteins by structural alignment and a volume-fraction corrected DFIRE-based energy function
Abstract
Motivation: Template-based prediction of DNA-binding proteins requires not only structural similarity between target and template structures but also prediction of binding affinity between the target and DNA to ensure binding. Here, we propose to predict protein-DNA binding affinity by introducing a new volume-fraction correction to a statistical energy function based on a distance-scaled finite ideal-gas reference state (DFIRE).
Results: We showed that this energy function together with the structural alignment program TM-align achieves the Matthews correlation coefficient (MCC) of 0.76 with an accuracy of 98%, a precision of 93%, and a sensitivity of 64%, for predicting DNA binding proteins in a benchmark of 179 DNA-binding proteins and 3797 non-binding proteins. The MCC value is substantially higher than the best MCC value of 0.69 given by previous methods. Application of this method to 2235 structural genomics targets uncovered 37 as DNA-binding proteins, 27(73%) of which are putatively DNA-binding and only 1 (3%) protein whose annotated functions do not contain DNA-binding while the remaining proteins have unknown function. The method provides a highly accurate and sensititive technique for structure-based prediction of DNA-binding proteins.
Availability: The method is a port of the SPOT (Structure-based function -Prediction On-line Tools) package available at http://sparks-lab.org/spot
2.1 Introduction
DNA-binding proteins are proteins that make specific binding to either single or double stranded DNA. They play an essential role in transcription regulation, replication,
packaging, repair and rearrangement. With completion of many genome projects and many more in progress, more and more proteins are discovered with unknown function [54]. The structures for some of those function-unknown proteins are solved because of structural genomics projects [55]. Functional annotations of these proteins are particularly challenging because the goal of structural genomics is to cover the sequence space of proteins so that homology modeling becomes a reliable tool for structure prediction of any proteins and, thus, many targets in structural genomics have low sequence identity to the proteins with known function. Therefore it is necessary to develop computational tools that utilize not only sequence but also structural information for function prediction [25,31,56–59].
Many methods have been developed for structure-based prediction of DNA-binding proteins. These include function prediction through homology comparison and structural comparison [22–26, 60]. Others explore sequence and structural features of DNA-binding and non-binding proteins with sophisticated machine-learning methods such as neural network [56,61–63], logistic regression [64], and support vector machines [22,27,63,65,66].
Recently, Gao and Skolnick proposed a new two-step approach, called DBD-Hunter [31], for structure-based prediction of DNA-binding proteins. In DBD-Hunter, the structure of a target protein is first structurally aligned to known protein-DNA complexes and the aligned complex structures are used to build the complex structures between DNA and the target protein. The predicted complex structures are, then, employed for judging DNA binding or not by structural similarity scores (TM-Score) and predicted protein-DNA binding affinities. TM-align [52] and a contact-based statistical energy function are employed in the first and second steps of DBD-Hunter, respectively. DBD-Hunter is found to substantially improve over the methods based on sequence comparison only (PSI-BLAST), structural alignment only (TM-align), and a logistic regression technique [67].
In this study, we investigate if one can further improve the prediction of DNA-binding proteins by employing a different statistical energy function for
predicting binding affinity. Our knowledge-based energy function is distance-dependent and built on a distance-scaled finite ideal gas reference (DFIRE) state originally developed for proteins [33,68,69] and extended to protein-DNA interactions [52,53]. Here, we introduce a new volume-fraction correction for the DFIRE energy function in extracting protein-DNA statistical energy function from protein-DNA complex structures. This volume fraction correction term, unlike previously introduced one [53], is atom-type dependent to better account for the fact that protein and DNA atom types are unmixable and occupy in physically separated volumes. In addition to introduction of a new energy function, we further optimize protein-DNA binding affinity by performing DNA mutation. These two techniques lead to a highly accurate and sensitive tool for structure-based prediction of DNA-binding proteins.
2.2 Methods 2.2.1 Datasets
We employed the datasets compiled by Gao and Skolnick [31]. One positive and one negative datasets for training are 179 DNA-binding proteins (DB179) and 3797 non DNA-binding proteins (NB3797), respectively. These structures were obtained based on 35% sequence identity cutoff, a resolution of 3 ˚A or better, a minimum length of 40 residues for proteins, 6 base pairs for DNA, and 5 residues interacting with DNA (within 4.5 ˚A of the DNA molecule). As in [31], we use significantly larger number of non DNA-binding proteins in order to reduce false positive rate because DNA-binding proteins are only small fraction of all proteins. APO and HOLO testing datasets are made of 104 DNA-binding proteins whose structures are determined in the absence and presence of DNA, respectively. A maximum of 35% sequence identity was also employed in selecting these 104 proteins. For APO/HOLO datasets, 93 APO-DB179 pairs and 92 HOLO-DB179 pairs have sequence identity >35%. These pairs are excluded from target-template pairs during testing.. An additional test set of 1697 proteins (the SG1697 set) was compiled from structural genome targets with a sequence identity cutoff at 90% by Gao and Skolnick from the Jan 2008 PDB release. We further
updated the release on November 2009 and obtained 2235 chains(the SG2235 set). This was done by queried “structural genomic” words in the PDB databank, resulting in 2447 PDB entries. These PDB entries were divided into protein chains and clustered by the CD-HIT [70]. For the clusters that contain a protein chain in SG1679, we chose the protein chain as the representation. For other clusters, we randomly chose one protein chain. There are 538 additional proteins and a total of 2235 protein chains.
To provide an additional test set and examine the effect of a larger database of DNA-binding proteins, we have also updated DNA-binding proteins from DB179 to DB250. This updated data set of DNA-binding proteins is selected from PDB released on December 2009 based on the same criteria that produced DB179. After removing the chains with high sequence identity (>35%) with any chain contained in DB179 and with each other, we obtained 71 additional protein-DNA complexes. This leads to an additional test dataset DB71 and an expanded training set DB250 (DB179+DB71).
2.2.2 Knowledge-based energy function
We employ a knowledge-based energy function to predict the binding affinity of a protein-DNA complex. We have developed a knowledge-based energy function for proteins based on the distance-scaled finite ideal-gas reference state (DFIRE) that satisfies the following equation [33]:
uDFIREi,j (r) = −RTln Nobs(i,j,r) ( r rcut)α( ∆r
∆rcut)Nobs(i,j,rcut), r < rcut,
0, r≥rcut,
(2.1)
where R is the gas constant,T = 300K,α= 1.61,Nobs(i, j, r)is the number of ij pairs
within the spherical shell at distance r observed in a given structure database,rcut is the
cutoff distance,∆rcutis the bin width atrcut. The value ofα(1.61)was determined by
the best fit ofrα to the actual distance-dependent number of ideal-gas points in finite
protein-size spheres.
Eq. (2.1) for proteins was initially applied to protein-DNA interactions unmodified with 19 atom types for both proteins and DNA (DDNA) [52]. In DDNA2
[53], a low count correction is made toNobs(i, j, r): Nobslc (i, j, r) =Nobs(i, j, r) + 75P i,jNijP rotein−DN A(r) P i,j,rNijP rotein−DN A(r) (2.2)
In addition, we employed residue/base specific atom types with a distance-dependent volume-fraction correction defined as fv(r) =
P i,jN Protein−DNA ij (r) P i,jN All ij (r) . This volume fraction correction was made to take into account the fact that DNA and protein atoms with residue/base specific atom types do not mix with each other. However, we found that DDNA2 is unable to go beyond existing techniques for predicting DNA-binding proteins. To further improve DDNA2, we introduce atom-type dependent volume fractions: fv
i (r) = P jN Protein−DNA ij (r) P jN All ij (r)
. Our final equation for the statistical energy function is
uDDNA3i,j (r) = −ηln Nobs(i,j,r) f v i(r)f vj(r) f v i(rcut)f vj(rcut) β rα∆r rα cut∆rcut Nlc
obs(i,j,rcut)
, r < rcut,
0, r≥rcut,
(2.3)
where we have introduced a parameter β. Physically,β should be around 1/2 so that volume fraction is counted once. We will employ it as an adjustable parameter here for the same reason that makes α less than 2: proteins are finite in size. As in DDNA2, we will use residue/base specific atom types (167 atom types for proteins and 82 for DNA) and rcut=15 ˚A, ∆r=0.5 ˚A. We also set the factor η arbitrarily to 0.01 to control
the magnitude of the energy score. For convenience, we shall label the volume-fraction corrected DFIRE as DDNA3.
2.2.3 Training of the method for predicting DNA-binding proteins
DB179 is used to generate the DDNA3 statistical energy function Eq. (2.3). To avoid overfiting, we employed the leave-one-out scheme to train DDNA3 statistical energy function. A target protein is chosen from DB179/NB3797. The TM-align program is employed to make a structural alignment between this target protein with a protein in DB179 (except itself if it is in DB179). If the alignment score (TM-score) is
greater than a threshold, the proposed complex structure between the target protein and DNA is obtained by replacing the template protein from its protein-DNA complex structure. The binding affinity between DNA and the target protein is evaluated by the DDNA3 energy function Eq. (2.3). Instead of using template DNA sequences, we perform exhaustive mutations of DNA base pairs to search for the highest binding affinity. DNA bases are paired by X3DNA software package [71]. The conformation of mutated bases are built using default bond length, bond angle and dihedral angle parameters as defined in AMBER98 forcefield [72]. A DNA base, if does not have a corresponding pairing base, is not mutated. If the highest binding affinity is greater than an optimized threshold, the target protein is considered as a DNA binding protein. The method described above has two important differences from DBD-hunter: the use of our distance-dependent energy function and the search for the strongest binding DNA fragment.
2.2.4 Evaluation of the method for predicting DNA-binding proteins
The measures of the method performance are: Sensitivity [SN=TP/(TP+FN)], Specificity [SP=TN/(TN+FP)], Accuracy [AC=(TP+TN)/(TP+FN+TN+FP)], and Precision [PR=TP/(TP+FP)]. In addition, we employed a Matthews correlation coefficient:
M CC = q T P ∗T N−F P ∗F N
(T P +F N)(T P +F P)(T N+F P)(T N +F N) (2.4)
Here TP, TN, FP, and FN refer to true positives, true negatives, false positives, and false negatives, respectively.
2.3 Results
2.3.1 Training based on DB179/NB3797 (DDNA3)
We have optimized volume-fraction exponent β, TM-score and binding affinity thresholds to achieve the highest MCC values. Optimization is performed by a
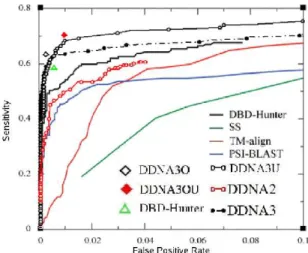
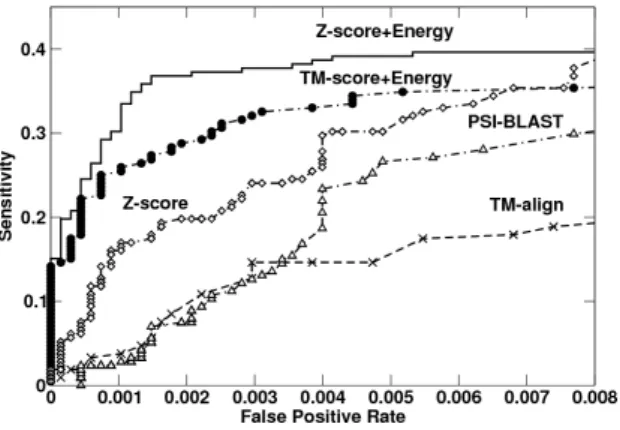
Fig. 2.1: Sensitivity versus false positive rate, given by DDNA3 (Filled black circles) and DDNA2 (Open red circles) reveals the importance of an appropriate reference state for method performance in predicting DNA binding proteins. The results of other methods are adapted from [31]. DDNA3U (open black circles) is the sensitivity versus false positive rate given by DDNA3 based on updated DB250 dataset. TM-Score dependent energy-score thresholds lead to DDNA3O (Open Diamond) and DDNA3OU (Red filled diamond), compared to optimized DBD-Hunter (Open green triangle).
grid-based search. The grids forβ and TM-score are 0.02 and 0.01, respectively. For the binding affinity threshold, the lowest energy of each aligned complex under different TM-score thresholds is calculated and these energy values are considered sequentially as the energy threshold. We found that the highest MCC is 0.73 forβ=0.4, the structural similarity threshold of 0.60 and the energy threshold of -11.6. The corresponding accuracy, precision and sensitivity are 98%, 91%, and 60%, respectively. The effect of a knowledge-based energy function can be revealed by replacing DDNA3 with DDNA2. The optimized MCC value (Structural similarity threshold of 0.53 and energy threshold of -4.2) is 0.61. (Note, there is no β parameter in DDNA2.) The corresponding accuracy, precision, and sensitivity are 97%, 85%, and 55%, respectively. It is clear that the reference state of a statistical energy function has a significant impact on the performance in predicting DNA-binding proteins. The largest improvement is 6% improvement in precision, the fraction of correct prediction in all prediction. The overall performance of DDNA3 significantly improves over that of DBD-Hunter which has a MCC of 0.64, 98% accuracy, 84% precision and 55% sensitivity, respectively.
Table 2.1: Optimized TM-score-dependent energy thresholds based on DB179 and NB3797 (DDNA3O)
TM-score Energy Max
Range Threshold ∆TP TP ∆FP FP MCC 0.74-1.00 -9.87 53 53 3 3 0.52 0.62-0.74 -13.95 52 105 4 7 0.73 0.58-0.62 -16.50 3 108 1 8 0.74 0.55-0.58 -18.64 4 112 0 8 0.76 0.52-0.55 -29.10 2 114 0 8 0.76
Fig. 2.1 shows sensitivity as a function of false positive rate. Our results were obtained by fixing structural similarity threshold and varying the energy threshold. It is clear that DDNA3 yields a substantially higher sensitivity than either DDNA2 or DBD-Hunter for a given false positive rate.
The predicted binding complexes can be employed to examine predicted DNA binding residues. An amino-acid residue is considered as a DNA-binding residue if any heavy atom of that residue is less than 4.5 ˚A away from any heavy atom of a DNA base. Predicted binding residues from template-based modeling can be compared to actual binding residues. For the training set (179 DB and 3797 NB proteins), there are 108 predicted DB proteins with 11 false positives. For these 108 predicted complexes, specificity, accuracy, precision, sensitivity and MCC of predicting DNA binding residues are 94%, 89%, 74%, 68%, and 0.64, respectively. For a comparison, DDNA2 has predicted 99 DB proteins and the corresponding performance in predicting DNA binding residues are 93%, 88%, 75%, 67%, and 0.63, respectively. These performances are similar to a specificity of 93%, an accuracy of 90%, a precision of 71% and a sensitivity of 72% achieved by DBD-hunter. Similar performance in predicting DNA-binding residues is due to the same structural alignment (TM-align) method used in the first step by the three methods.
2.3.2 TM-Score dependent energy threshold (DDNA3O)
Obviously, one threshold for energy and one for structural similarity (TM-Score) are too simple to capture the complex relation between structure and binding. For
example, one expects that the binding-energy requirement should be stronger for less similar structures but weaker for highly similar structures between template and query. This has led Gao and Skolnick to develop TM-Score dependent energy thresholds (9 energy thresholds for 9 TM-Score bins ranging from 0.40 to 1.0 to maximize MCC value in each bin), and they finally set a minimum TM-score cutoff at 0.55 for maximum MCC. Here, we slightly changed the way to calculate MCC by including those predicted positive(TP/FP) in higher TM-score region. The results are shown in Table 2.1. By this way, the cutoff of TM-score is extended to 0.52 rather than 0.55 as Gao’s way, and the number of TP increase 2 without increasing FP. We followed their method and optimized 9 parameters for the MCC value at each TM-Score bin separately for the same dataset (DB179 and NB3797). We further found that the top four bins in the table with negative prediction for TM-score<0.55 generate the highest MCC value of 0.76 for the entire dataset. To distinguish this further optimized method, we labeled it as DDNA3O. DDNA3O yields a MCC value of 0.76 with the corresponding sensitivity of 0.64 and specificity of 0.998. By comparison, the corresponding optimized DBD-Hunter with the same dataset has a MCC value of 0.69 with the corresponding sensitivity of 0.58 and specificity of 0.995 while the DDNA3 has a MCC value of 0.73 with sensitivity of 0.60 and specificity of 0.997. Thus, most significant improvement from DDNA3 to DDNA3O is significant increase in sensitivity (from 60% to 64%) also with reduction in rate of false positives (from 11/3797 to 8/3797).
There are 114 complexes predicted as DNA-binding proteins by DDNA3O. For these 114 complexes, predicted DNA-binding residues are compared with native complexes. The specificity, accuracy, precision, sensitivity and MCC are 95%, 90%, 77%, 69% and 0.67, respectively. These do not change significantly from DDNA3 because of same complex structures generated by TM-align. The slight difference is caused by 2 reasons. First, in different potential energy functions, different proteins are predicted as binding; Secondly, protein may choose different templates.
Fig. 2.2: Energy threhold versus
TM-score, given by
DDNA3O-L(filled line) and DDNA3O (slashed line). All protein located behind the line is predicted as positive. Only TP(filled circles) and FP ( open circles) by DDNA3O-L are shown. For protein with multiple matching templates, only template with highest TM-score is used.
We found the energy threshold is increasing along with TM-score threshold. To show the relation between energy and TM-score, we changed to a new way to optimize the energy threshold by linear relation with TM-scoreEcut =γ·T M score+e0, where
γ ande0are two parameters for training to maximize MCC. The highest MCC is 0.76 when γ = 52.5 and e0 = −49.85 with the TM-score cutoff at 0.5, where there is higher sensitity 67%(120/179) but also with more number of false positive (17). This method is labeled as DDNA3O-L. As shown in Fig. 2.2, most of true positive points by this method are far below the boundary, with a few left mixed with false positive points. Relatively all false positive positive points are gathering around the boundary. Certaily, a high-order equation can discriminate the points better, however, limited to the number of samples, it’s hard to overcome the over-training problem. Also DDNA3 and DDNA3O gives a reasonable boundary. To limit the rate of false positive in the prediction, we will still use DDNA3O for all future applications.
2.3.3 Test by the APO104/HOLO104 datasets
The methods trained above (DDNA3 and DDNA3O) are applied to predict DNA binding proteins of APO104/HOLO104 datasets. The numbers of positive prediction are 50 by DDNA3 and 53 by DDNA3O (out of 104) for the APO sets, and 61 by DDNA3 and 62 by DDNA3O (out of 104) for the HOLO sets, respectively. That is, using monomer structures, rather than the complex structures, leads to a reduction of
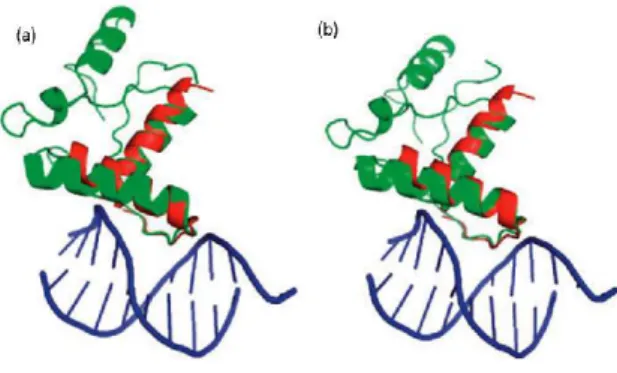
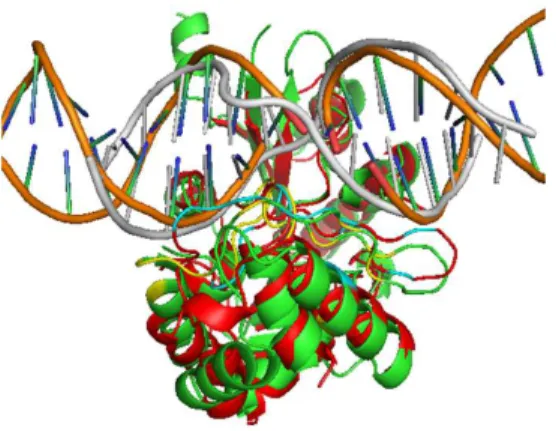
Fig. 2.3: (a) Structural comparison between APO target protein 1mjkA (green) and template protein 1ea4A(red) . The TM-score between them is 0.79 and the interaction energy between 1mjkA and template DNA is -20.9. (b) Structural comparison between HOLO target protein 1mjmA(green) and template protein (1ea4A). The TM-score between them is 0.76 and the interaction energy between 1mjmA and template DNA is -20.6.
11% in sensitivity (from 59% for the HOLO to 48% for the APO set) by DDNA3 and 9% by DDNA3O (from 60% to 51%). The corresponding sensitivity values for DDNA2 are 43.3% (45/104) and 53.8% (56/104) for the APO and HOLO sets, respectively. The performance of DBD-Hunter (47% for the APO and 55% for the HOLO sets) is somewhat in between DDNA2 and DDNA3. The test confirms a significant increase in sensitivity by DDNA3O over by DDNA3 for the APO set, in particular.
A more detailed analysis on predictions made by DDNA3O shows that there is an overlap of 49 predictions between the APO and HOLO sets. Fig.2.3shows one example of the test on target proteins 1mjkA (contained in APO104) and 1mjmA (contained in HOLO104). 1mjkA and 1mjmA are the structure of the same methionine repressor protein in the absence and presence of DNA fragment, respectively. There is a small conformational change before and after DNA binding (TM-Score between the two is 0.93). This small conformational change apparently does not prohibit the successful match to the same template protein 1ea4A with strong binding affinity.
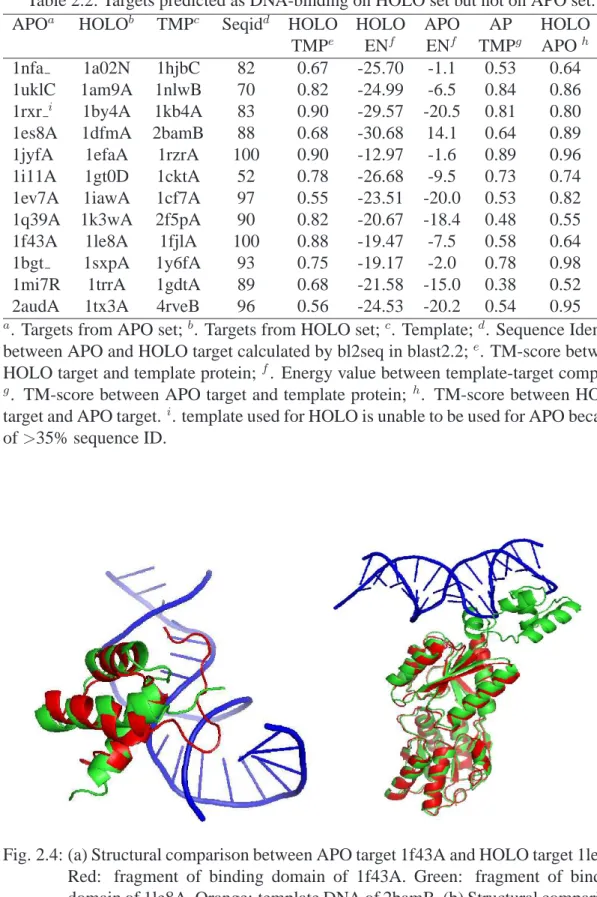
On the other hand, there are 12 correctly predicted HOLO targets but incorrectly predicted APO targets as shown in Table 2.2. The difference is caused by significant local conformational change in binding regions (high TM-align score but low binding affinity). An example (1le8A in HOLO and corresponding 1f43A in APO) is shown in Fig. 2.4a where significant change in binding regions (from red in APO to green
Table 2.2: Targets predicted as DNA-binding on HOLO set but not on APO set.
APOa HOLOb TMPc Seqidd HOLO HOLO APO AP HOLO
TMPe ENf ENf TMPg APOh
1nfa 1a02N 1hjbC 82 0.67 -25.70 -1.1 0.53 0.64
1uklC 1am9A 1nlwB 70 0.82 -24.99 -6.5 0.84 0.86
1rxr i 1by4A 1kb4A 83 0.90 -29.57 -20.5 0.81 0.80
1es8A 1dfmA 2bamB 88 0.68 -30.68 14.1 0.64 0.89
1jyfA 1efaA 1rzrA 100 0.90 -12.97 -1.6 0.89 0.96
1i11A 1gt0D 1cktA 52 0.78 -26.68 -9.5 0.73 0.74
1ev7A 1iawA 1cf7A 97 0.55 -23.51 -20.0 0.53 0.82
1q39A 1k3wA 2f5pA 90 0.82 -20.67 -18.4 0.48 0.55
1f43A 1le8A 1fjlA 100 0.88 -19.47 -7.5 0.58 0.64
1bgt 1sxpA 1y6fA 93 0.75 -19.17 -2.0 0.78 0.98
1mi7R 1trrA 1gdtA 89 0.68 -21.58 -15.0 0.38 0.52
2audA 1tx3A 4rveB 96 0.56 -24.53 -20.2 0.54 0.95
a. Targets from APO set;b. Targets from HOLO set;c. Template;d. Sequence Identity
between APO and HOLO target calculated by bl2seq in blast2.2;e. TM-score between HOLO target and template protein;f. Energy value between template-target complex;
g. TM-score between APO target and template protein; h. TM-score between HOLO
target and APO target.i. template used for HOLO is unable to be used for APO because of>35% sequence ID.
Fig. 2.4: (a) Structural comparison between APO target 1f43A and HOLO target 1le8A. Red: fragment of binding domain of 1f43A. Green: fragment of binding domain of 1le8A. Orange: template DNA of 2bamB. (b) Structural comparison between APO target 1jyfA (red) and HOLO target 1efaA (green). Orange: template DNA of 1rzrA.
in HOLO) leads to incorrect prediction despite insignificant structural change in nonbinding regions of the protein. In another more extreme case (Fig.2.4b), disordered region in APO structure (1jyfA) changes to ordered binding domain in HOLO structure (1efaA).
Another cause of incorrect prediction in APO and correct prediction in HOLO is large overall structural change. The large overall structure changes lead to poor structural alignment to templates so that their TM-scores are lower than the threshold. For example, despite 90% sequence identity, TM-score between 1q39A in APO and 1k3w in HOLO structures is only 0.48 and leads to the poor alignment of APO structure to template (best is 0.48 in TM-score). We also discovered a technical reason for an APO target (1rxr ). We are unable to use the template employed for the corresponding HOLO target because the sequence identity between the template and its respective APO target is slightly higher than 35%.
There are also 3 targets identified as DNA binding proteins correctly in the APO set but not in the HOLO set. All 3 (1llzA, 1bf5A and 1esgA) are just outside of arbitrary boundaries generated by optimization. This highlights the empirical nature of the proposed approach.
One can further examine the performance of DDNA3O in predicting binding residues. We found that the specificity, accuracy, precision, sensitivity and MCC for predicting binding residues are 94%, 90%, 69%, 64%, 0.59 for the APO set and 95%, 90%, 75%, 67%, 0.63 for the HOLO set, respectively. The performance for the HOLO set is close to the results for training set (93%, 89%, 76%, 66%, and 0.64 for specificity, accuracy, precision, sensitivity and MCC, respectively). This highlights the robustness of DDNA3O.
2.3.4 Test by the DB71 dataset
The additional 71 proteins contained in the updated protein/DNA complex structural dataset (DB71) offer a challenging test set. DDNA3 (DDNA3O) predicts 34 ( 39) out of 71 proteins as DNA binding proteins. Thus, the sensitivity is 34/71(48%) by
DDNA3 and 55% by DDNA3O. DDNA3O continues to make significant improvement in sensitivity over DDNA3. This 55% sensitivity is 5% lower than the sensitivity of 60% for the HOLO dataset but is higher that the sensitivity of 51% for the APO dataset. This suggests that more than 50% new complex structures are recognizable by DDNA3O with DB179 as templates for protein-DNA complexes for all the sets tested (APO, HOLO, and DB71).
2.3.5 The effect of a larger, updated dataset of DNA-binding proteins (DDNA3U) To examine the effect of a larger dataset of DNA-binding proteins, we use DB250 and NB3797 as the training set. We found that for this larger, updated dataset, the highest MCC is 0.75 with the same or similar values for three parameters (β=0.4, TM-score threshold of 0.55 and energy threshold of -13.7) as DDNA3. This result highlights the stability of trained parameters with a 40% increase in DNA-binding proteins. The corresponding accuracy, precision and sensitivity are 97%, 87%, and 67%, respectively. In particular, 45 out of 71 additional proteins outside DB179 are recognized as DNA binding by DB250-trained DDNA3 (DDNA3U), the same proteins recognized by DB179-trained DDNA3 (DDNA3) for which 71 proteins are employed as an independent test set.
Application of this newly trained method to APO104 and HOLO104 sets leads to 52(50%) and 64(62%) predicted DNA binding proteins, respectively. That is, a 40% expansion of DNA-binding proteins (from 179 to 250) leads to about 2% improvement in sensitivity. For 52 successfully predicted APO targets, the specificity, accuracy, precision, sensitivity and MCC for predicted binding residues are 94%, 90%, 66%, 63%, 0.58, respectively. The corresponding values for 64 successfully predicted HOLO targets are 95%, 90%, 74%, 67%, 0.63, respectively. However, as Fig. 2.1 indicates, newly trained DDNA3 (labeled as DDNA3U) yields higher sensitivity only when false positive rate>0.005. That is, at a lower false positive rate, a larger template database in fact decreases sensitivity and precision.
Table 2.3: Structural Genomics targets (SG1697) predicated as DNA-binding proteins by DBD-Hunter, DDNA3, and DDNA3O.
Method Prediction Putative Other Function Unknown
DDNA3 32 19 3 10
DDNA3O 27 19 1 7
DBD-Hunter 37 18 3 16
Overlap* 19 15 0 4
∗Overlap between DBD-Hunter and DDNA3O
Here, by applying TM-Score dependent energy thresholds to the updated DB250/NB3797 databases, MCC hasn’t been changed much. This is caused by the increase of number of false positive (from 26 to 34), although with more number of true positive (from 167 to 176). Because we are interested in predicting DNA binding proteins with very low false positive rate (<0.005), we will employ the methods (DDNA3 and DDNA3O) trained by DB179 to structural genomics targets.
To further examine the possibility of overfitting in DDNA3U, we perform a ten-fold cross-validation tests on the DB250/NB3797. That is, all the binding and non-binding sets are randomly divided into 10 folds. Each time, one fold is chosen as the test set while the other 9 folds are employed for all training: the statistics of potential energy function, the structure templates for protein-DNA binding, and re-training of the parameters. The test is repeated for 10 times. The method performance is analyzed by 1000 times of bootstrap resampling [73]. We found that the average MCC value is 0.70±0.02 with the accuracy of 97%, the precision of 88% and the sensitivity of 58%, respectively. It is clear that the only significant change from the leave-one-out results is the reduction of sensitivity from 65% to 58%. This is likely caused by the reduced number of templates in the ten-fold cross-validation. Indeed, if 249 templates are permitted to use, the average MCC value is 0.72±0.02. Thus, our results are reasonably robust with different trainining.
2.3.6 Application to Structural Genomics Targets
3 out of 32 proteins (10%) are annotated to having other functions while others ( 31%) have unknown function. DDNA3O decrease the prediction of DNA binding proteins from 30 to 27 without change on the number of putative DNA binding proteins (19) and a decreased number of proteins with other annotated function from 3 to 1. This result further confirms the improvement of DDNA3O over DDNA3. By comparison, DBD-Hunter predicts 37 DNA-binding proteins. Among the 37 proteins, there are 18 (48.6%) putative DNA binding proteins, 3 (8.1%) with other putative functions, and 16 (43.2%) with unknown function. All the putative functions are according to NCBI database.
The overlap between predicted proteins by DDNA3O and DBD-Hunter is only 19 proteins, 15(79%) of which are putative DNA binding proteins. The large fraction of putative DNA binding proteins in overlapped predictions highlights significant improvement in confidence of prediction when a consensus prediction is made. Meanwhile, only 70% proteins predicted by DDNA3O overlap with those by DBD-Hunter highlights that the energy function plays a significant role in prediction. There are 4 putative DNA binding proteins (1ug2A, 1y9bA, 2cqxA and 2fb1A) predicted by DDNA3O but missed by DBD-Hunter. Similarly, there are 3 putative DNA binding proteins (2hytA, 2iaiA and 2od5A) predicted by DBD-Hunter but missed by DDNA3O. The complete list of predicted DNA-binding proteins is shown in Table 2.4. Table 2.4 includes 10 additional predicted proteins from SG2235, 8 of which are putative DNA binding proteins. That is, 80% of predicted proteins from SG2235 are putative DNA binding proteins. This result confirms the prediction quality of the proposed DDNA3O technique.
2.4 Discussion
We have developed a highly accurate method (DDNA3O) to predict DNA binding proteins. This is accomplished by developing a new statistical energy function for predicting DNA-binding proteins. We found that introducing an atom-type dependent volume fraction correction and DNA mutation in the DFIRE statistical energy function
Table 2.4: Targets are predicted as DNA-binding proteins by DDNA3O from SG1697 and SG2235 with function based on GO annotations.
Target Template TM-score Energy Putative Function
2keyAd 1p7dB 0.58 -22.19 DB 2khvAd 1p7dB 0.72 -30.06 DB 2kobAd 1p7dB 0.75 -26.52 DBa 3cecAd 3croL 0.75 -21.67 DB 3edpAd 1sfuA 0.74 -13.42 DB 3frwFd 1trrG 0.77 -23.04 DB 3ic7Ad 1cf7A 0.61 -17.48 DB 3ikbAd 4sknE 0.62 -16.54 DB 3iuvAd 1jt0A 0.77 -14.97 UKb 3ke2Ad 1gdtA 0.58 -18.58 UK 1iuyA 1f4kB 0.61 -19.25 NBc 1s7oA 1gdtA 0.67 -14.37 DB 1sfxA 1u8rJ 0.72 -24.89 DB 1ug2A 1fjlA 0.58 -17.92 DB 1wi9A 1repC 0.62 -17.50 UK 1x58A 1w0tA 0.87 -24.86 DB 1y9bA 1ea4A 0.67 -22.76 DB 1z7uA 1u8rJ 0.66 -14.75 DB 1zelA 1cgpA 0.56 -20.67 UK 2cqxA 1akhA 0.69 -17.87 DB 2da4A 1akhA 0.74 -27.67 DB 2e1oA 1akhA 0.87 -18.37 DB 2eshA 1f4kB 0.67 -17.10 DB 2esnA 1u8rJ 0.62 -21.74 DB 2ethA 1u8rJ 0.71 -20.94 DB 2f2eA 1u8rJ 0.71 -14.07 DB 2fb1A 2as5F 0.62 -14.47 DB 2fyxA 2a6oB 0.78 -18.83 DB 2g7uA 1u8rJ 0.70 -15.83 DB 2jn6A 1gdtA 0.70 -17.11 DB 2jtvA 2ex5A 0.61 -21.07 UK 2nx4A 1jt0A 0.76 -16.34 DB 2qvoA 1z9cF 0.80 -10.19 UK 3b73A 1z9cF 0.68 -23.89 UK 3bddA 1u8rJ 0.76 -21.56 DB 3bhwA 1fokA 0.58 -19.04 UK 3bz6A 1u8rJ 0.73 -17.02 UK
a. Targets are annotated as protein which has putative functions related with DNA
binding in PDB.b. It is unknown whether a target has putative functions related with DNA binding. c. Nonbinding to DNA according to GO annotation.d. Targets in SG2235
leads to a significant improvement in the performance in predicting DNA-binding proteins (MCC= 0.76 for DB179/NB3797 by DDNA3O). This is a significant improvement from MCC of 0.69 given by optimized DBD-Hunter. Application of DDNA3O to structural genome targets confirms the accuracy of the proposed method with 73% potentially correct prediction of DNA-binding proteins (annotated as putative DNA-binding), 3% potentially false positives (function annotated but not DNA-binding) and the rest unknown.
For DDNA3, the effect of DNA mutation is small for improving the MCC value of the training set (from 0.72 to 0.73) but is significant for improving the sensitivity from 46/104 (44%) to 50/104 (48%) of the APO test set. We further find that the mutation leads to no significant improvement in sequence identity between template DNA sequence and wild-type DNA sequence. The sequence identities to wild-type DNA sequences before and after mutation are both close to the random value of 25%. One possible reason is the absence of structural refinement for protein during mutation. This result also suggests that DDNA3 is not yet specific enough to identify binding DNA bases.
In principle, exhaustive mutations of DNA base pairs can lead to significant increase in computing time for a long DNA segment. However, because our energy function does not consider base-base interaction by assuming a rigid DNA structure before and after binding, the computing requirement for the exhaustive mutations of DNA base pairs is only four times more than that without base mutations.
One potential concern is insufficient statistics due to the small number of complex structures for deriving the DDNA3 energy function. We have addressed this question by employing the leave-one-out (for both DB179 and DB250 sets) and ten-fold cross-validation (for the DB250 set) techniques. The consistency between different training and test sets provides the confidence about the energy functions obtained.
Another concern is potential overfitting due to 5 threshold parameters in DDNA3O because of the small number of true positives for each TM-Score bins (Table 1). This concern is reduced somewhat as the energy threshold mostly satisfies
the expectation that less similar structures (low TM-Scores) requires higher energy thresholds. Moreover, there is a consistent improvement in sensitivity from training (DB179) to test (APO/HOLO104, DB71, and structural genomics targets). This consisteny makes the improvement statistically significant. However, one certainly can not completely remove the concern of overfitting. More studies as larger data set becomes available are certainly needed.
One advantage of the proposed structure-based prediction method is the prediction of protein-DNA complex structures. The predicted complex structures allow prediction of DNA binding residues. High specificity and accuracy (>90%) are achieved for binding residue prediction even for the APO structures (protein structures in the absence of DNA).
The success of DDNA3O is limited by the availability of protein-DNA complexes as templates. A 40% expansion of template databases from 179 to 250 proteins leads to significant improvement in sensitivity if false positive rate>0.005 (Fig. 2.1) but also slightly decreases sensitivity if false positive rate<0.005. Thus, there is a clear need to further improve the energy function that discriminates binding from nonbinding proteins. The rigid-body approximation employed here likely has limited the performance of DDNA3O. Introducing flexibility to DNA and proteins to DDNA3 is in progress.