Mobile App Reading Speed Test
Alec Kingsnorth, James S WolffsohnOphthalmic Research Group, Life and Health Sciences, Aston University, Birmingham, UK
Corresponding author:
Prof James S Wolffsohn, Life and Health Sciences, Aston University, Aston Triangle, Birmingham, B4 7ET, UK
E-mail: [email protected]
Tel: 0121 2044140
Key words: reading speed; mobile app; critical print size; threshold reading acuity
ABSTRACT
Aim: To validate the accuracy and repeatability of a mobile App
reading speed test compared to the traditional paper version.
Method: Twenty-one subjects wearing their full refractive correction read 14
sentences of decreasing print size between 1.0 and -0.1 logMAR, each consisting of 14 words (Radner reading speed test) at 40cm with a paper based chart and twice on iPad charts. Time duration was recorded with a stop watch for the paper chart and on the App itself for the mobile chart allowing critical print size (CPS) and Optimal Reading Speed (ORS) to be derived objectively.
Results: The ORS was higher for the mobile app charts (194±29wpm;
195±25wpm) compared to the paper chart (166±20wpm; F=57.000, p<0.001). The CPS was lower for the mobile app charts (0.17±0.20logMAR; 0.18±0.17logMAR) compared to the paper chart (0.25±0.17logMAR; F=5.406, p=0.009).The mobile app
test had a mean difference repeatability of 0.30±22.5wpm, r=0.917 for ORS, CPS of 0.0±0.2logMAR, r=0.769.
Conclusion: Repeatability of the app reading speed test is as good (ORS) or better
(CPS) than previous studies on the paper test. While the results are not
interchangeable with paper based charts, mobile app tablet based tests of reading speed are reliable and rapid to perform, with the potential to capture functional visual ability in research studies and clinical practice.
INTRODUCTION
Reading is one of the most vital and common skill’s for engaging, communicating and interpreting ideas. Any visual loss that affects reading ability will have a disproportionate impact on a patient’s quality of life and is often cited as a major factor in patients seeking professional help[1] for eye related problems.
Current paper based reading performance charts [2, 3] are often cumbersome to use when manual time measurement, sentence unveiling, and error recording which have to be undertaken simultaneously by the examiner. Additionally reading performance metrics are determined by plotting reading performance data
graphically, a laborious and time consuming process that would be better suited to automation. Any metrics determined subjectively by the examiner can be variable; data around the critical print size (CPS) is particularly noisy and is likely to be misjudged.[4] Computerised reading systems have been used for reading speed assessment,[5] but display technology was not sufficiently advanced to be able to test a wide range of print sizes at typical reading distances.
A quick and efficient reading test based on a mobile computing platform may be a viable alternative to current PC or paper charts. They can combine the utility of a computerised test with the portability of a paper based chart. High resolution displays in products such as mobile phones and tablets can render very small text sizes perfectly at standard reading distances. Moreover, due to the compact size and long battery life, mobile devices can be readily used at the examination chair. The
increased processing power of mobile computing devices, as well as their plethora of inbuilt sensors, can enable reading metrics to be determined automatically. The technical performance of the iPad display has been assessed and shown to be
suitable for the testing of visual function [6] and several papers have now been published with validated vision tests on tablets [7, 8]. Therefore a smartphone/tablet based reading chart could increase adoption of reading performance as a standard clinical test. This study aims to test the validity and repeatability of a mobile app tablet based reading speed test compared to the traditional paper based version.
METHODS
Subjects
Twenty-one subjects aged 20-30 years (average 22.2 ± 2.9 years) wearing their full refractive correction were recruited for the testing of the new mobile reading app. All subjects were required to have a VA better than 0.2 logMAR and have no history of ocular disease. Informed consent was obtained from all participants and the study was conducted in accordance with the declarations of Helsinki. Ethical approval for the study was granted by the Aston University Ethics Committee.
Procedure
Three charts were used for this study, a Radner reading chart and two custom made mobile App reading speed charts. Software for the App charts was created using Apple’s X-code SDK in the Objective-C programming language for the iPad 3. Screen luminance was set to 200 mcd. Each subject was required to perform a reading performance test on each chart; the order of which were randomized. Both the mobile app and paper charts used the English Radner Reading speed
sentences, each consisting of 14 words with a standardized structure. As the bank of sentences provided with the Radner reading test was small (28 original sentences), each chart consisted of 9 original sentences and 3 sentences that had been
repeated on the other charts. Allocations of the repeated sentences within the charts were randomized.
Using the mobile App, subjects were positioned at 40cm from the screen and in the field of view of the tablet computer’s front facing camera. A face tracking algorithm provided within the app, tracked a subject’s pupillary distance (PD) to ensure that the
space between themselves and the screen would remain constant. Test data on 5 patients showed a mean error (±1 S.D.) at 30cm of 0.69 ± 1.75cm, at 35cm 0.64 ± 1.39cm, at 40cm of 0.17 ± 1.38cm, at 45cm of 0.25 ± 0.83cm and at 50cm of 0.03 ± 0.75cm. A warning showed if the app detected that the patient had moved
significantly towards or away from the set screen working distance (±10% increase in the PD seen from the camera, equivalent to ±4cm) and the part of the test that was disrupted could be retaken. For the paper chart patients were positioned at 40 cm and the distance monitored subjectively.
Once started the mobile app would present the Radner reading sentences one at a time in 0.1 logMAR steps starting at 1.0 logMAR and finishing when the subject pressed the “Cannot Read” button or -0.1 logMAR was reached (recorded as the patient’s threshold reading acuity). The tablet computer could simultaneously record the subject’s voice and started a stopwatch to measure the reading duration between when the text had first been presented, to when the patient had pressed the “Read” button on the screen. At the end of the test an evaluation screen would appear for the examiner to playback any of the sentences read by a subject and present its accompanying text; by tapping on misread words on the screen these could be accounted for in the final determination of the reading metrics. LogRAD score = logRAD for lowest line read + (0.005 x syllables of incorrectly read words).[3] If patients pressed the ‘Cannot Read’ button before at least 30 seconds of trying to read the test a warning message was displayed instructing them to guess at the words even if they were not clear.
For the paper based chart, the chart was covered with an opaque sheet of paper and the patient was instructed to uncover the chart and read the revealed sentence as quickly and accurately as possible, starting at 1.0 logMAR, reducing in 0.1 logMAR size steps. Time duration was measured using a manual stopwatch from when the sentence was first uncovered to when the subject had finished reading aloud. Reading errors were recorded manually after every sentence had been read. Threshold reading acuity was determined as the last sentence that could be read completely.
For all charts critical print size (CPS) was defined when a fitted least squares
exponential curve reached 90% of its maximum value and optimal reading speed as the mean reading speed up to the CPS, which could be performed automatically for the mobile app chart.
Statistical testing
The data was normally distributed (Kolmogorov-Smirnov test > 0.05) hence one-way repeated measures ANOVA’s were conducted on Optimal Reading Speed, Reading Acuity and Critical Print Size using the type of chart, paper and the two iPad app Radner charts as the independent variable. If a significant difference was found for any one of the metrics, dependant t-tests were conducted between the three charts to determine whose means differed significantly. Additionally, to measure agreement between charts Bland-Altman analyses and Pearson’s correlation coefficients were determined for each of the metrics for comparison between the paper and two app charts. Comparisons between the two iPad app charts was used to determine the inter-test repeatability.
RESULTS
The root mean squared fit of the reading speed data with text size was good being on average 0.913 ± -0.046 with app chart 1, 0.931 ± -0.040 with app chart 2 and 0.904 ± -0.071 for the paper chart.
Validity
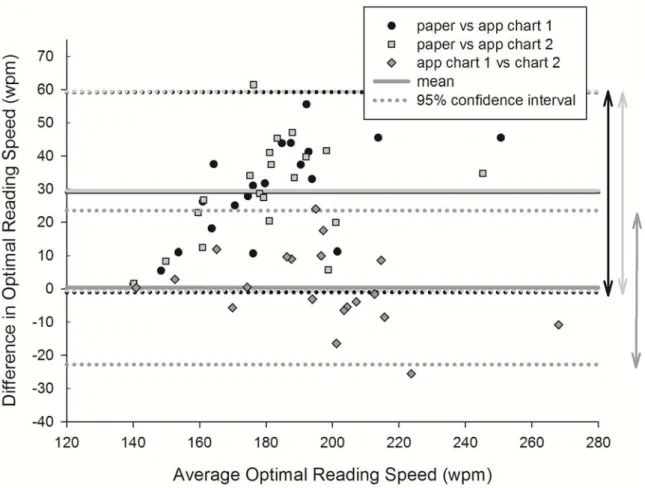
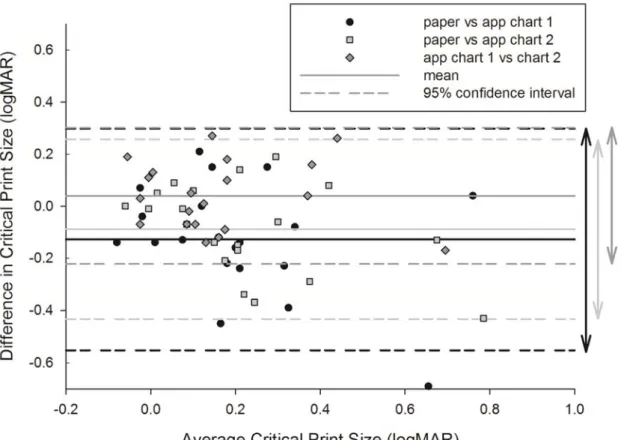
The mean reading speed at each acuity level for the three charts can be seen in Figure 1. There was a statistically significant effect of chart type on optimal reading speed (F = 57.000, p < 0.001) and CPS (F=5.406 p<0.001) with the difference being between the paper and app based charts, but not between app based charts (Table 1). Threshold reading acuity was similar between paper and app based charts (F = 0.335 p = 0.717). Strong correlations existed between charts on all metrics except for CPS between paper and app chart 1 where a mild correlation was found (Table 1). Bland Altman analyses (difference ± 95% confidence interval) between paper and app chart 1 and 2 for optimal reading speed were 29.1 ± 29.3 wpm / 29.2 ±29.3 wpm (Figure 2), objective CPS were -0.12 ± 0.41 logMAR / -0.08 ± 0.32 logMAR (Figure 3) and threshold reading acuity were 0.01 ± 0.13 logMAR / 0.01 ± 0.15 logMAR (Figure 4).
Figure 1: Mean reading speeds at different levels of text size for the paper and
Figure 2: Difference in optimal reading speed against the mean comparing the
Figure 3: Difference in critical print size against the mean comparing the paper
Figure 4: Difference in threshold reading acuity against the mean comparing the
paper and two app based charts. Error bars = 1 S.D. n=21.
Repeatability
Bland Altman analyses of repeat measurement on the app based charts (difference ± 95% confidence interval) for optimal reading speed was 0.30 ± 22.5 wpm (Figure 2), objective CPS was -0.08 ± 0.33 logMAR (Figure 3) and threshold reading acuity was 0.01 ± 0.01 logMAR (Figure 4).
ORS (wpm) p R CPS (logMAR) p r RA (logMAR) p r Paper Chart 166 ± 20 <0.001 <0.001 0.887 0.811 0.27 ± 0.26 0.016 0.036 0.599 0.749 0.02 ± 0.13 0.614 0.534 0.830 0.821 App (Chart 1) 194 ± 29 0.14 ± 0.19 0.01 ± 0.10 0.897 0.924 0.204 0.771 0.917 0.960 App (Chart 2) 195 ± 25 0.18 ± 0.19 0.01 ± 0.11 Table 1: Optimal Reading Speed (ORS), Critical Print Size (CPS) and threshold Reading Acuity (RA) ± 1 standard deviation for the paper and two app charts, significance and correlation between them. N = 21.
DISCUSSION
Reading speed was developed as a functional vision measure principally in the field of low vision research as visual acuity, reading static letters, did not correlate well with reported ability in everyday visual tasks.[9] For example, reading speed provides more information on patients who can manage a good visual acuity with effort using a magnification aid, but gives up the task as the experience is no longer pleasurable. Traditional reading speed charts such as the MNRead [2] and the
Radner [3] charts are paper based and provide limited versions to overcome learning effects, the paper quality can degrade with time and the test is slow due to page manipulation, the need for manual timing, graph plotting and data analysis. Hence the test is rarely used outside a research setting. The Salzburg reading desk was introduced in 2010 [10] to allow monitoring of the working distance with video-stereo-photometry (where a green dot needs to be placed on the bridge of the patient's nose for tracking), provide constant fluorescent uniform illumination and digitises the voice (although start and end times are set subjectively), but still uses a paper chart. Using a mobile app tablet reading speed chart overcomes many of outlined issues providing: randomisation of validated sentences from a sentence bank to overcome learning effects; constant, uniform back illumination with no degradation over time; rapid testing as there is no need for page manipulation, timing can be automated, voice detection can be employed to correct for errors, graph plotting and data analysis can be automated; and improved accuracy as timing can by objective and unaffected by response times, working distance can be monitored objectively and the sentence size scaled in real time or only revealed when within a specified working distance range, and the last sentence can be recorded and played back to
check for errors. Tablets are also more portable, generally cheaper and have greater functionality than a dedicated reading desk.
This study used the Radner test sentences as these have already been validated.[2] The mobile app sentence bank could contain texts that are selected based on
language and educational level, in a typeface and contrast relevant to the patient. The selection of sentence words could also be optimised for voice recognition to allow further automation. The app tests measured a seemingly faster optimal reading speed than the equivalent paper based chart, presumably because the latency of the investigator to stop the timer after the last sentence word was spoken was removed from the denominator. However, reading speed as measured by the Salzburg reading desk which should have similar voice detection advantages was similar (152.4±22.6 wpm and 157.3±5.8 wpm) to the paper based reading speed in this
study, although this could be explained by their older patient cohort.[10]The app
charts also had a lower critical print size, but similar threshold reading acuity, which is likely to relate to the 90% of the maximum exponential of reading speed allowing a greater reduction before the criteria was reached. Repeatability of the mobile app test was similar (r=0.924 vs 0.942 for paper optimal reading speed and r=0.998 vs 0.989 for threshold reading acuity) or better (r=0.749 vs 0.582 for critical print size) than previous findings with the paper based Radner test.[11] Repeatability was also similar to that reported for a recently devised silent reading test (r=0.95), although the 95% confidence interval was ±40wpm (compared to ±22.5 wpm with the mobile app) and no data was given on the CPS.[12] However, Subramanian and colleagues showed investigated the repeatability on the MNRead test and found it to have tighter (95%) confidence intervals for reading speed (±8.6 vs ±22.5 wpm) and CPS
(±0.12 vs ±0.33 logMAR) than the Radner test in this study compared to the mobile app, although threshold reading acuity was less repeatable (±0.05 vs ±0.01
logMAR).[13] The MNRead test paragraphs have less words (10 words comprising of a total of 60 characters) than the Radner sentences, but the education level is similar so it is not clear why they should differ in repeatability.
Hence the results from this study demonstrate that while the results are not
interchangeable with paper based charts, mobile app tablet based tests of reading speed are reliable and rapid to perform, with the potential to capture functional visual ability in research studies and clinical practice.
ACKNOWLEDGMENTS, COMPETING INTERESTS, FUNDING
The mobile app reading speed test is licenced to Aston EyeTech Ltd
REFERENCES
1. Elliott DB, Trukolollic M, Strong JG, et al. Demographic characteristics of the vision-disabled elderly. Invest Ophthalmol Vis Sci 1997;38:2566-75.
2. Mansfield JS, Ahn SJ, Legge GE, et al. A new reading-acuity chart for normal and low vision. Ophthalmic Vis Opt Assess Vis Syst Tech Dig. 1993;3:232–5.
3. Radner W, Willinger U, Obermayer W, et al. A new reading chart for simultaneous determination of reading vision and reading speed. Klin Monbl Augenheilkd. 1998;213:174–81.
4. Cheung S-H, Kallie CS, Legge GE, et al. Nonlinear mixed-effects modelling of MNREAD data. Invest Ophthalmol Vis Sci. 2008;49:828–35.
5. Luebker A, Lamay J. Psychophysics of reading. VIII. The Minnesota low vision reading test. Optom Vis Sci 1989;37:843–53.
6. Aslam TM, Murray IJ, Lai MYT, et al. An assessment of a modern touch-screen tablet computer with reference to core physical characteristics necessary for clinical vision testing. J Royal Soc Interface 2013;10,20130239.
7. Black JM, Jacobs RJ, Phillips G, et al, An assessment of the iPad as a testing platform for distance visual acuity in adults. BMJ Open 2013;3:e002730.
8. Rodríguez-Vallejo M, Remón L, Monsoriu JA, et al. Designing a new test for contrast sensitivity function measurement with iPad. J Optom 2014;
9. Rubin GS. Measuring reading performance. Vis Res 2013;90:43-51.
10.Dexl AK, Schlögel H, Wolfbauer M et al. Device for improving quantification of reading acuity and reading speed. J Refract Surg 2010:26:682-8.
11. Stifter E, König F, Lang T et al. Reliability of a standardized reading chart system: variance component analysis, test-retest and inter-chart reliability. Graefe’s Arch Clin Exp Ophthalmol 2004;242:31–9.
12. Ramulu PY, Swenor BK, Jeffreys JL et al., Description and validation of a test to evaluate sustained silent reading. Invest Ophthalmol Vis Sci 2013;54:673-80. 13. Subramanian A, Pardhan S. The repeatability of MNREAD acuity charts and variability at different test distances. Optom Vis Sci 2006;83:572-6.