E.A. Belousova ÆW.L. Griffin Suzanne Y. O’Reilly ÆN.I. Fisher
Igneous zircon: trace element composition as an indicator
of source rock type
Received: 10 January 2000 / Accepted: 18 March 2002 / Published online: 31 May 2002 Springer-Verlag 2002
Abstract Trace element abundances in igneous zircons, as determined by electron microprobe and laser-ablation microprobe ICPMS analysis, are shown to be sensitive to source rock type and crystallisation environment. The concentrations of 26 trace elements have been deter-mined for zircons from a wide range of different rock types and reveal distinctive elemental abundances and chondrite-normalised trace element patterns for specific rock types. There is a general trend of increasing trace element abundance in zircons from ultramafic through mafic to granitic rocks. The average content of REE is typically less than 50 ppm in kimberlitic zircons, up to 600–700 ppm in carbonatitic and lamproitic zircons and 2,000 ppm in zircons from mafic rocks, and can reach per cent levels in zircons from granitoids and pegmatites. Relatively flat chondrite-normalised REE patterns with chondrite-normalised Yb/Sm ratios from 3 to 30 cha-racterise zircons from kimberlites and carbonatites, but Yb/Sm is commonly over 100 in zircons from pegmatites. Th/U ratios typically range from 0.1 to 1, but can be 100– 1000 in zircons from some carbonatites and nepheline syenite pegmatites. The geochemical signatures charac-teristic of zircon from some rock types can be recognised in bivariate discriminant diagrams, but multivariate statistical analysis is essential for the discrimination of zircons from most rock types. Classification trees
based on recursive partitioning techniques provide a rapid means of relating parent rock type to zircon trace element analysis; zircons from many rock types can be discriminated at confidence levels of 75% or more. These trees allow recognition of the provenance of detrital zircons from heavy mineral concentrates, and signifi-cantly enhance the usefulness of zircon in regional crustal studies and as an indicator mineral in mineral explora-tion.
Introduction
Zircon is a remarkable mineral because of its ubiquitous occurrence, ranging from crustal rocks to mantle xeno-liths, lunar rocks, meteorites and tektites (e.g. Speer 1980). It is chemically resistant and refractory, and can survive both weathering and transport processes as well as high temperature metamorphism and anatexis. It can, therefore, be found in many igneous, metamorphic and sedimentary rocks and is particularly common in plu-tonic rocks.
Zircon is generally present as small, early-formed crystals, commonly enclosed in later-formed minerals, but may form large well-developed crystals in granite pegmatites and particularly in nepheline syenites (Deer et al. 1966) and carbonatites; large zircon megacrysts also are common in kimberlites and alkali basalts. Watson (1979) showed experimentally that the zircon saturation level in felsic liquids depends strongly on the molar (Na2O+K2O)/Al2O3ratio of the melts, with re-markably little sensitivity to temperature, SiO2 content or the Na2O/K2O ratio of the melt. For peraluminous melts and those lying in the quartz–orthoclase–albite compositional plane, less than 100 ppm Zr is required for zircon saturation (Watson and Harrison 1983). In peralkaline melts, however, zircon solubility shows pronounced and apparently linear dependence on (Na2O+K2O)/Al2O3with the amount of Zr in solution ranging up to 3.9 wt% at (Na2O+K2O)/Al2O3=2.0.
DOI 10.1007/s00410-002-0364-7
E.A. Belousova (&)ÆW.L. GriffinÆS.Y. O’ReillyÆN.I. Fisher GEMOC ARC National Key Centre,
Department of Earth and Planetary Sciences, Macquarie University,
NSW 2109, Australia
E-mail: [email protected] W.L. Griffin
CSIRO Exploration and Mining, North Ryde, NSW 2113, Australia N.I. Fisher
School of Mathematics and Statistics, University of Sydney,
NSW 2006, Australia
This low saturation level means that any felsic, non-peralkaline magma is likely to precipitate zircon.
The importance of this accessory mineral lies in the combination of its tendency to incorporate trace elements (including radionuclides), its chemical and physical durability and its remarkable resistance to high-temperature diffusive re-equilibration (Cherniak et al. 1997a, 1997b; Watson and Cherniak 1997). Although zircon abundance is commonly low, it may strongly affect the behaviour of many trace elements during the crystallisation of magma, and understanding its com-positional variation is thus important for petrological modelling (e.g. Nagasawa 1970; Watson 1979; Murali et al. 1983; Hoskin et al. 2000).
U–Pb dating of detrital zircons is already widely used in sediment provenance studies. Hf isotopic data ob-tained from zircons provide a powerful tool for the study of crustal evolution (Griffin et al. 2002a, 2002b), by adding another dimension to the geochronology. If the original rock parent type of detrital zircons in heavy mineral concentrates can be recognised, it could add another layer of information to such provenance studies, and greatly enhance their interpretability. One aim of this study has been to provide the basis for this enhanced interpretation.
In addition to its dominant role in controlling zirco-nium and hafzirco-nium distribution, zircon can have a sig-nificant influence on the behaviour of rare earth elements, Y, Th, U, Nb and Ta. Their large ionic radii and high charge make these elements incompatible in many rock-forming silicate minerals and they generally become concentrated in the residual melts and are in-corporated in the late-crystallising zircon as the crystal structure of zircon accommodates widely varying pro-portions of trace elements. The abundance and ratios of these trace elements are potentially useful in distin-guishing zircons from different sources (e.g. Chyi 1986; Heaman et al. 1990). Our approach, therefore, has been to analyse as wide a range of trace elements as possible, in zircons from a wide range of rock types, and to identify discriminants that can distinguish among these zircons.
Sampling
Zircon samples have been selected from a range of igneous rock types (kimberlites, lamproites, basalts, carbonatites, dolerite, granitoids, syenitic rocks, syenite pegmatites and nepheline–syenite pegmatites) from different geographical localities as listed in Table 1. The aim of this sampling was to collect zircons from a wide range of commonly occurring igneous rocks; samples from less common lithologies then were added, to ex-tend the range of bulk compositions represented. Zir-con macrocrysts from kimberlites, alkali basalts and lamproites have been included specifically to test the degree to which these xenocrysts represent distinct
populations, and to see if their ultimate source(s) can be identified by comparison with zircons from other rock types.
Zircons from kimberlites
Zircon is a widespread trace mineral in kimberlites, and is recognised as a member of the low-Cr suite of mantle-derived megacryst minerals (Moore et al.1992). Despite its low abundance in kimberlites, zircon is commonly recovered during diamond production because of its high density and X-ray fluorescence. Kimberlitic zircons are characterised by the almost complete absence of crystal faces; they are usually rounded to subrounded, apparently by resorption in the kimberlitic magma (Belousova et al. 1998). The other distinctive morpho-logical feature of the kimberlite zircons is their large size (typically several millimetres), although Kresten et al. (1975) and Lyakhovich (1996) have reported small euhedral grains of zircon in kimberlites. Kimberlitic zircons vary from colourless to reddish brown, with honey-yellowish colours most common. Some grains have a whitish coating previously identified as a mixture of monoclinic (baddeleyite) and tetragonal zirconia and thought to be a result of reaction with the magma (Kresten et al. 1975).
Trace element compositions were analysed in 155 zircon crystals from 35 kimberlite pipes of Southern Africa, Russia and Australia. Zircons from South African kimberlites are the best represented group, with 67 grains from 13 different kimberlite pipes (Table 1) available for this study. Preliminary results for these grains were reported by Belousova et al. (1998, 1999).
Yakutian kimberlitic zircons (Russia) are represented by 39 grains from 19 kimberlite pipes in eight kimberlite fields (Table 1). Chains of kimberlites stretching across the NE part of the Siberian Craton extend across the Archaean Magan and Anabar Provinces, into the Pro-terozoic Olenek Province. The Malo-Botuobiya, Alakit, Kharamai and Upper Muna fields occur in the on-cra-ton areas with thick Archean lithosphere and the low geotherm required for high diamond prospectivity. The Chomurdakh, Merchimden, Kuoika and West Ukukit fields are in off-craton (Proterozoic) settings, and none of these kimberlites is likely to be significantly diamon-diferous (Griffin et al. 1995, 1999).
Australian kimberlitic zircons are represented by 45 grains from three small kimberlite bodies: Orroroo from South Australia, Pteropus from the Kimberley Block and Timber Creek from the Northern Territory. The Timber Creek kimberlites (on the North Australian Craton) have a diamond grade of 1 carat/tonne (Ber-ryman et al. 1999); the Orroroo kimberlite pipe (on the Proterozoic Gawler craton) is known to contain rare diamonds, whereas Pteropus (possibly on an Archean craton) is barren.
Zircons from lamproites
Lamproitic zircons are represented by 11 grains from the Argyle lamproite pipe in the East Kimberley region of Western Australia and by 14 grains from lamproitic rocks of the Kirovograd Block of the Ukraine Shield (Belousova et al. 1999).
Argyle zircons are large (up to 2 mm), clear to light brown euhedral to subhedral fragments that were broken either during eruption or processing. Many of the surfaces are covered by iron oxides. SHRIMP ion probe U–Pb dating defined two groups of zircons with mean ages of ca. 1,650 and ca. 1,750 Ma (R. Page and L. Jaques, unpublished data; L. Jaques personal com-munication 1999). Both of these ages are older than the accepted age for the lamproite intrusion (ca. 1,180 Ma; Jaques et al. 1986), but younger than most U–Pb ages of crustal rocks in the area (1,800– 1,900 Ma).
Lamproitic zircons from the Kirovograd Block come from the Precambrian areas of the Ukrainian shield, a tectonic environment similar to that of the Kimberley Block of Western Australia (Yatsenko et al. personal communication 1999). In contrast to the Argyle lam-proite pipe, the lamproitic rocks of the Kirovograd
Block are not significantly diamondiferous (B. Panov, personal communication 1997). Kirovograd zircons vary from pink and orange to dark red and brown with grain sizes of 0.5–1 mm.
Zircon xenocrysts in basalt
Zircons of this type are represented by detrital zircon megacrysts derived from alkali basalts in NSW, Aus-tralia, Thailand and Cambodia, and a zircon intergrown with an anorthoclase xenocryst in basalt from Riley’s Peak, NSW.
Ten zircon grains that occur together with diamonds in the Dobe Lead palaeochannel, NSW, may be derived from the surrounding basalts (Griffin et al. 1989). They are orange, orange pink and brown and from 0.5 to 3.5 mm across. The brown and yellow zircons from In-verell, NSW are associated with detrital corundum (Griffin et al. 1989). Intergrowths of corundum + zircon and anorthoclase + zircon are known from the Inverell area, and zircon is a common inclusion in corundum from this location (Guo et al. 1996). These zircons are apparently part of a xenocryst suite carried to the sur-face by the basaltic lavas and pyroclastics, and are
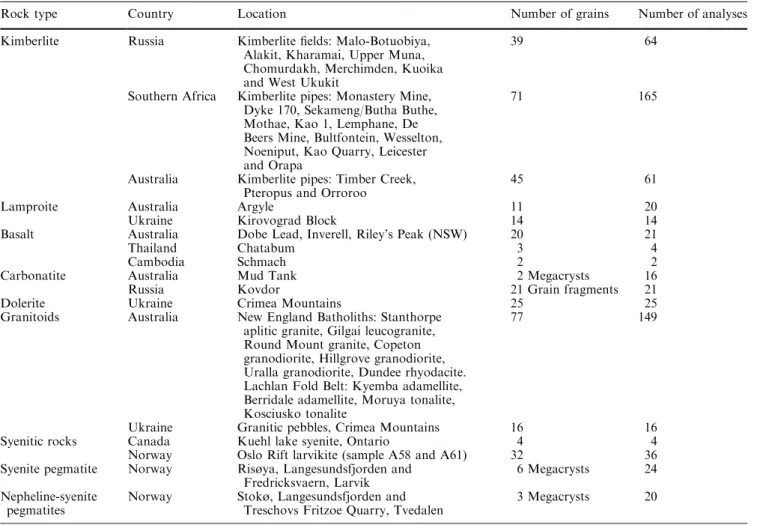
Table 1. Locations of host rocks for zircons of this study
Rock type Country Location Number of grains Number of analyses
Kimberlite Russia Kimberlite fields: Malo-Botuobiya,
Alakit, Kharamai, Upper Muna, Chomurdakh, Merchimden, Kuoika and West Ukukit
39 64
Southern Africa Kimberlite pipes: Monastery Mine, Dyke 170, Sekameng/Butha Buthe, Mothae, Kao 1, Lemphane, De Beers Mine, Bultfontein, Wesselton, Noeniput, Kao Quarry, Leicester and Orapa
71 165
Australia Kimberlite pipes: Timber Creek, Pteropus and Orroroo
45 61
Lamproite Australia Argyle 11 20
Ukraine Kirovograd Block 14 14
Basalt Australia Dobe Lead, Inverell, Riley’s Peak (NSW) 20 21
Thailand Chatabum 3 4
Cambodia Schmach 2 2
Carbonatite Australia Mud Tank 2 Megacrysts 16
Russia Kovdor 21 Grain fragments 21
Dolerite Ukraine Crimea Mountains 25 25
Granitoids Australia New England Batholiths: Stanthorpe aplitic granite, Gilgai leucogranite, Round Mount granite, Copeton granodiorite, Hillgrove granodiorite, Uralla granodiorite, Dundee rhyodacite. Lachlan Fold Belt: Kyemba adamellite, Berridale adamellite, Moruya tonalite, Kosciusko tonalite
77 149
Ukraine Granitic pebbles, Crimea Mountains 16 16
Syenitic rocks Canada Kuehl lake syenite, Ontario 4 4
Norway Oslo Rift larvikite (sample A58 and A61) 32 36
Syenite pegmatite Norway Risøya, Langesundsfjorden and Fredricksvaern, Larvik
6 Megacrysts 24
Nepheline-syenite pegmatites
Norway Stokø, Langesundsfjorden and Treschovs Fritzoe Quarry, Tvedalen
considered to be genetically unrelated to the basalts (Griffin et al. 1989; Guo et al. 1996).
Zircon megacrysts several millimetres long from Thailand and Cambodia are also xenocrysts in alkali basalts (P. Wathanakul, personal communication) that are mined for sapphire. A 2-mm zircon megacryst in-tergrown with anorthoclase comes from the nepheline basanite of Riley’s Peak in the Southern Highlands Basalt Province, New South Wales (Wass 1980). Cathodoluminescence reveals internal zoning with a blue core and yellow rim in this megacryst.
Zircon from carbonatites
Carbonatitic zircons are represented by megacrysts from the Mud Tank carbonatite complex, central Australia and the Kovdor carbonatite complex, Kola peninsula, Russia. Mud Tank zircons are large brown euhedra 1– 3 cm long parallel to the c-axis. Two megacrysts were sectioned for analytical work. Kovdor zircons available for this study were crushed fragments, 0.25–0.5 mm in size, of large megacrysts separated from the carbonatites of the complex. They are light green and contain car-bonate inclusions visible under cathodoluminescence.
Zircon from dolerite
Twenty-five representative grains were selected from a zircon concentrate separated from a Jurassic dolerite in the Crimea Mountains, Ukraine. They are transparent euhedral crystals with a grain size of 100–200lm.
Zircon from granitoid rocks
Four to twelve representative zircon grains were selected from each of 12 granitoid rock samples from the New England Batholith and the Lachlan Fold Belt, Australia, and from granitic pebbles from the Crimea Mountains, Ukraine. The granitoids in this study represent a range of rock composition from rhyodacite, tonalite and granodiorite (64–65 wt% SiO2) to felsic granite, leu-cogranite and aplitic granite (over 76 wt% SiO2).
The Palaeozoic New England Fold Belt underlies the north-eastern part of New South Wales and eastern Queensland in eastern Australia. Most of the Fold Belt is composed of tholeiitic and calc-alkaline igneous rocks, sediments and subduction-accreted oceanic rocks (Leitch et al. 1988). The Palaeozoic Lachlan Fold Belt of Eastern Australia is characterised by Ordovician flysch deposits into which I-and S-type granitoids (Chappell and White 1974, 1992) have intruded.
Granitic pebbles from the Upper Jurassic conglom-erates of the Crimea Mountains, and zircons from these pebbles, have been studied previously by Andreev et al. (1993) to obtain information on their provenance and on the geological history of the region. U–Pb dating of
these zircons yielded an age range of 1,000–1,500 Ma, with one sample giving an age of about 2,100 Ma (Andreev et al. 1993).
Most of the studied zircon crystals show complex internal structures (e.g. oscillatory zoning, inherited cores, resorption features, etc.) in backscattered-electron and cathodoluminescence images that are not visible in transmitted or reflected light under the petrographic microscope. The small size of the granitic zircons, rarely over 100–150lm, allowed only two analytical points by laser ablation microprobe on each grain to obtain the trace element data.
Zircon from syenitic rocks
Zircons from syenitic rocks are represented by fragments from a syenite (Ontario, Canada) and by grains from larvikites (monzonite-syenites) in the Oslo Rift, Norway. The Ontario sample (91500) consists of fragments (3– 4 mm in size) of a larger crystal used as a geochemical standard for calibrating the U–(Th)–Pb geochronometer and Hf isotopic analyses (Wiedenbeck et al. 1995). The location is the Kuehl Lake syenite, Ontario, Canada, where the predominant rock type is porphyroblastic syenite gneiss, which is cross cut by sheets or sills of syenite pegmatite (Wiedenbeck et al. 1995).
The Oslo Rift is an intracontinental rift zone that experienced extensive magmatism in Permian time. Fel-sic rocks of intermediate (monzonitic) composition make up about 40% of the exposed area (Neumann 1980). The most common variety is ‘larvikite’, a feldspar-rich (sy-enitic) rock produced by fractional crystallisation of mafic magmas. Most of the larvikites are slightly over-saturated to slightly underover-saturated in silica. Larvikitic zircons, separated from samples (A-58 and A-61) pro-vided and described by Andersen (1981, 1984), are honey-brown, transparent grains 0.25–0.5 mm in size.
Zircons from syenite and nepheline–syenite pegmatites
Large (0.3–0.8 cm) zircon crystals from syenite pegma-tites and nepheline–syenite pegmapegma-tites of the Oslo Permian igneous suite, Norway, are transparent and range from pale yellow to brownish in colour. They were prepared as polished thick (100 lm) sections and from three to seven analyses were made across each sample. Differentiation of the larvikites (Neumann 1980) has produced a series of feldspar–nepheline–femic silicate– apatite cumulate rocks known as lardalites, whereas the residual magmas form nepheline–syenite pegmatites. A series of nepheline-free ‘syenite pegmatites’ formed at earlier stages and represent volatile-rich portions of in-dividual magma chambers. The Risøya and Fred-ricksvaern zircons (Table 1) are from syenite pegmatites, whereas the Stokø and Tvedalen zircons are from nepheline–syenite pegmatites.
Analytical techniques
Zircon grains were hand-picked under a binocular microscope and mounted in epoxy blocks for analysis. Large crystals were prepared as polished sections about 100lm thick. Prior to analytical work, polished surfaces were examined for zoning using cathodolumi-nescence (CL) microscopy and back-scattered electron (BSE)/CL images taken on the electron microprobe.
Cathodoluminescence microscopy
A cold cathode luminescence stage CITL, Model CCL 8200 mk3, mounted on a petrographic microscope was used to study the in-ternal structure of grains with sizes exceeding 1 mm. The samples were irradiated in a vacuum chamber with an electron beam of 10– 15 kV produced by the electron gun supply. The operating vacuum was in the range from 0.2 to 0.08 Torr and an operating current of 400–500lA was used during observation.
Cameca CAMEBAX SX50 electron microprobe
Hf contents of the zircons were determined by electron microprobe so that Hf could be used as the internal standard for trace element determinations by laser ablation ICPMS. An accelerating voltage of 15 kV and a beam current of 20 nA were used for all analyses. The spatial resolution of the electron microprobe was about 2lm. The detection limit for Hf was 0.12% with a precision of 2.5% rsd at 1.5% HfO2.
Combined BSE/CL observations were made using the CAMEBAX SX50 electron microprobe with operating conditions of 15 kV accelerating voltage and 15–20 nA beam current. The images are a combination of BSE and CL phenomena obtained by operating the BSE detector at high gain amplification; the BSE image reflects differences in the mean atomic number of the zircon composition and CL is produced by the irradiation of the zircon with the electron beam.
The relationships between chemistry and CL/BSE response in kimberlitic and lamproitic zircons have been discussed by Belous-ova et al. (1998, 1999). In many of the other samples studied here, the zoning revealed by these studies is on a scale finer than the laser-microprobe spot size. A detailed discussion of the relation-ships between such zoning and the chemical and isotopic compo-sition of the zircon is outside the scope of this paper and will be presented elsewhere. In this work, the main use of the CL/BSE images was to avoid clearly altered areas of the crystals being analysed, and to distinguish magmatic zircons from possible late overgrowths.
Laser ablation ICPMS microprobe
Trace elements have been analysed by a UV laser ablation mi-croprobe coupled to either a Perkin–Elmer ELAN 5100 ICPMS or a Perkin–Elmer ELAN 6000 ICPMS at GEMOC, Macquarie University. Detailed descriptions of instrumentation and analytical and calibration procedures are given by Norman et al. (1996, 1998). The laser-ablation system is a Continuum Surelite I-20 Q-switched Nd: YAG laser with a fundamental infrared (IR) wavelength at 1,064 nm and a pulse width of 5–7 ns. Two frequency doubling crystals provide second and fourth harmonics in the visible (VIS, 532 nm) and ultraviolet (UV, 266 nm), respectively. The 266-nm beam was used for the trace element analyses reported here. Most of the analyses have been done with a pulse rate of 4 Hz (pulses per second) and a beam energy of 1 mJ per pulse, producing a spatial resolution of 30–50lm. Small grains (less than 100lm across) were analysed using a pulse rate of 2 Hz and a beam energy of about 0.5 mJ per pulse, achieving spatial resolution of about 30lm.
The NIST 610 standard glass was used as the external calibration standard. Quantitative results for 26 elements were
obtained through calibration of relative element sensitivities using the NIST-610 standard glass, and normalisation of each analysis to the electron-probe data for Hf as an internal standard. The refer-ence data for the NIST 610 calibration standard glass are given in Norman et al. (1996, 1998).
The NIST 610 standard glass was analysed as an unknown at least once for each 15 mineral analyses to assess the data quality. The precision and accuracy of these NIST 610 analyses are 2–5% for REE, Y, Sr, Nb, Ta, Hf, Th and U at the ppm concentration level, and from 8 to 10% for Mn, P, Fe, Ga, Sn and Pb.
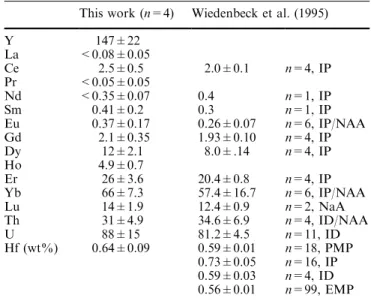
Zircon 91500, from an Ontario syenite, has been analysed for Hf, U and Th by several methods. Preliminary data on its REE contents has been obtained by ion microprobe and INAA (Wiedenbeck et al. 1995). A comparison of our analyses with the published data is shown in Table 2. This zircon is reasonably ho-mogeneous, but different analytical techniques show a range in Hf content from 0.56 to 0.73%; our value lies in the middle of this range. Our values for the REE, U and Th also overlap the available data within analytical uncertainties, but tend to lie higher than the mean of the ion probe and INAA data. More detailed comparisons will be facilitated by the ongoing interlaboratory calibration of this standard for trace element analysis (Wiedenbeck, personal com-munication 2001).
Results
Analytical data are presented in Tables 3, 4, 5 and 6 as the mean (±SD) and median values for zircons from each rock type. These data provide a summary of the absolute levels of each element, the range of variation, and the degree of skewness of the data. Chondrite-nor-malised averaged trace element abundances for zircons from each rock type are shown in Figs. 1 and 2. The individual data points for each rock type are shown in Figs. 3, 4 and 5.
Silica ranges from 30.9 to 33.3% SiO2and ZrO2from 63.0 to 68.3% in non-metamict zircons. In contrast, the trace element concentrations may vary over several orders of magnitude (Tables 3, 4, 5 and 6, Fig. 1).
Table 2. Trace element data (ppm) for the 91500 zircon standard compared with previously reported data (Wiedenbeck et al. 1995)
This work (n=4) Wiedenbeck et al. (1995)
Y 147±22 La <0.08±0.05 Ce 2.5±0.5 2.0±0.1 n=4, IP Pr <0.05±0.05 Nd <0.35±0.07 0.4 n=1, IP Sm 0.41±0.2 0.3 n=1, IP Eu 0.37±0.17 0.26±0.07 n=6, IP/NAA Gd 2.1±0.35 1.93±0.10 n=4, IP Dy 12±2.1 8.0±.14 n=4, IP Ho 4.9±0.7 Er 26±3.6 20.4±0.8 n=4, IP Yb 66±7.3 57.4±16.7 n=6, IP/NAA Lu 14±1.9 12.4±0.9 n=2, NaA Th 31±4.9 34.6±6.9 n=4, ID/NAA U 88±15 81.2±4.5 n=11, ID Hf (wt%) 0.64±0.09 0.59±0.01 n=18, PMP 0.73±0.05 n=16, IP 0.59±0.03 n=4, ID 0.56±0.01 n=99, EMP
Table 3. Trace element contents (ppm) of zircons from a range of rock types Rock type Kimberlite Lamproite Carbonatite Quartile Min. 1st Quart. Median 3rd Quart. Max. Min. 1st Quart. Median 3rd Quart. Max Min 1st Quart. Median 3rd Quart. Max P 2 1 4 9 6 1 7 7 343 64 107 149 221 543 21 38 52 69 144 Ti <1.9 12 18 24 779 <3.2 4.9 9.3 16 68 <3.6 – – – <22 Mn <0.06 – – <1.4 17 <0.58 – – <1.5 4.2 <0.37 – – <0.98 4,6 Fe <0.01 – – <21.3 819 <42 – – <66 142 <22 – – <49 59 Ga <0.06 – – <0.81 11 <0.38 – <1.0 1.3 2.6 <0.38 – – – <1.93 Sr <0.02 0.08 0.13 0.25 144 <0.12 – <0.39 0.57 2.1 <0.03 0.09 0.14 0,40 2,3 Y 4.0 20 31 56 194 53 215 399 701 1.081 22 159 379 471 757 Nb <0.44 2.2 2.9 4.1 23 0.16 0.87 1.3 1.6 5.2 0.70 3.0 10 42 116 Sn <0.05 – <0.44 0.73 5.5 <0.22 – <0.88 1.1 2.3 <0.38 – <0.66 0,9 2,5 Ba <0.02 – <0.15 0.29 12 <0.12 – <0.33 1.4 9.4 <0.07 – – <0.24 3,5 La <0.01 – <0.09 0.16 4.0 <0.06 – <0.2 0.3 2.3 <0.03 <0.06 0.17 0,61 2,9 Ce 0.16 0.63 0.87 1.2 6.7 2.3 5.6 7.9 12 30 0.34 1.1 4.5 8,3 20 Pr <0.01 – <0.08 0.15 2.0 <0.05 0.09 0.15 0.28 1.1 <0.03 <0.05 0.54 1,7 4,7 Nd <0.06 0.24 0.39 0.67 5.0 0.67 1.04 1.8 3.4 7.7 <0.23 0.60 6.2 17 37 Sm <0.08 0.30 0.53 0.86 4.2 0.48 1.5 3.3 5.0 9.5 <0.05 1.4 6.6 12 25 Eu <0.02 0.17 0.36 0.64 3.4 <0.06 0.28 0.50 0.77 3.3 <0.09 0.74 4.0 6,7 16 Gd <0.06 0.87 1.48 3.1 10 3.3 7.3 15 21 33 <0.29 4.8 20 31 69 Dy <0.13 2.46 4.14 7.7 25 6.9 29 37 68 106 3.1 18 56 69 128 Ho 0.13 0.73 1.28 2.1 7.7 1.5 7.4 14 24 36 0.8 6.1 15 19 34 Er 0.39 2.50 4.25 7.0 25 5.2 28 63 104 154 3.1 24 53 60 102 Yb 0.16 3.60 5.64 8.9 36 6.9 36 126 179 277 4.6 32 64 78 115 Lu 0.12 0.63 1.05 1.5 6.8 1.2 5.9 28 39 56 0.9 5.9 11 14 19 Hf (wt%) 0.57 1.14 1.31 1.5 2.3 0.79 0.94 1.00 1.13 1.30 0.79 0.94 1.04 1,15 1,27 Ta 0.10 1.89 2.38 3.0 13 0.07 0.25 0.45 0.74 2.1 1.1 3.1 6.1 8,6 26 Pb <0.03 <0.17 0.29 0.57 18 <1.0 3.8 6.6 13 29 0.5 3.8 7.7 11 18 Th 0.84 2.0 3.6 5.0 48 12 34 64 126 188 2.9 30 212 462 845 U 3.0 7.4 9.8 14 69 17 45 74 204 348 <0.03 <0.09 0.29 39 131 Number of analyses 284 34 37
Table 4. Trace element contents (ppm) of zircons from a range of rock types Rock type Basalt Dolerite Granitoid Quartile Min 1st Quart. Median 3rd Quart. Max. Min. 1st Quart. Median 3rd Quart. Max. Min. 1st Quart. Median 3rd Quart. Max. P 2 9 4 9 5 8 113 238 195 233 260 317 396 110 414 763 1,497 12,748 Ti <2.7 <4.9 6.0 9.7 17 <12 – <22 26 140 <9.5 25 44 182 24,305 Mn <2.4 – – <19 31 <1.6 – <5.2 6.2 11 <1.6 <6.8 23 91 2,951 Fe <83 – – <174 220 <93 – – <325 484 <91 <251 868 2,981 41,823 Ga <0.23 – – <1.24 4.3 <0.74 – -<2.3 6.6 <1.4 – <4.6 7.4 67 Sr <0.06 – – <0.35 1.1 <0.35 – <0.66 0.9 26 <0.23 <1.4 4.7 26 655 Y 8 3 282 417 899 2,342 821 1,797 2,334 3,192 4,415 376 1,438 2,515 5,602 67,922 Nb <0.22 1.4 3.8 5.2 76.0 <0.33 – <0.79 1.0 1.5 <0.48 2.4 4.3 39 3,460 Sn <0.14 <0.96 1.2 1.6 5.4 <0.65 – – <2.1 5.0 <0.89 – <3.7 7.3 2,222 Ba <0.03 – – <0.29 1.9 <0.33 – <0.59 0.9 13 <0.2 <1.2 5.1 28 1,833 La <0.03 – – <0.28 2.4 <0.21 – – <0.57 1.3 <0.17 2.4 12.0 52 7,144 Ce 0.6 1.2 2.1 4.4 76 3.5 5.4 7.1 8.3 19 1.5 18.6 61.0 283 15,615 Pr <0.02 <0.06 0.08 0.16 7.1 <0.18 – <0.25 0.3 1.1 <0.12 2.0 8.0 43 2,110 Nd <0.13 <0.68 0.9 2.4 65 <1.3 – <2.4 3.8 6.6 <0.66 10.1 44.7 198 8,456 Sm <0.6 0.9 1.8 4.3 50 <1.0 3.8 5.3 7.6 21 <0.5 7.4 21.5 131 2,167 Eu <0.2 0.7 1.6 2.8 22 <0.25 <0.47 0.9 1.3 2.6 <0.24 0.8 2.1 7 497 Gd <0.7 5.0 11 20 128 11 25 38 56 95 1.0 30 58 238 2,622 Dy 7.2 22 35 121 319 55 136 185 264 376 25 128 224 695 8,319 Ho 2.8 10 15 34 89 26 56 74 102 151 11 48 85 203 2,317 Er 15 46 65 142 330 131 271 352 481 671 60 214 378 781 8,906 Yb 31 101 118 230 610 305 558 659 862 1,149 173 459 769 1,694 17,860 Lu 5.1 22 25 42 117 73 118 153 179 235 34 86 150 299 2,470 Hf (wt%) 0.53 0.58 0.61 0.69 0.83 0.87 0.93 0.95 0.98 1.03 0.65 1.08 1.28 1.43 3.07 Ta 0.2 0.7 1.6 2.6 20 <0.19 – – <0.47 0.9 <0.3 1.1 2.3 8.6 266 Pb <0.13 – <0.78 1.1 34 <0.95 2.2 3.3 4.5 16 <0.26 4.1 8.8 32 2,806 Th 8 3 2 6 4 230 3,170 95 205 331 466 651 31 189 368 1,265 12,088 U 1 7 5 3 106 239 1,447 141 200 274 344 534 76 429 764 1,832 12,381 Number of analyses 38 25 154
Hafnium concentrations range from 0.5 to 3 wt% Hf with a mean of 1.18 wt%. The lowest Hf values are found in zircons from syenite 91500 (Wiedenbeck 1995; Table 2), the zircon megacryst from the Riley’s Peak basalt, NSW, some alluvial zircons associated with the basaltic megacryst suites and zircons from the Jwaneng kimberlite, Botswana. The highest Hf values are found in zircons from some granitoids and from nepheline syenite pegmatites (Fig. 3a).
Most concentrations of yttrium fall in the range from hundreds to thousands of ppm. The Y contents of kimberlitic zircons rarely exceed tens of ppm, whereas in crustal zircons Y may reach percent-level concentra-tions. A plot of Hf versus Y (Fig. 3a) shows a decrease in Hf/Y ratio from kimberlitic zircons (50 to over 1,000) towards zircons from granitoid rocks (1–15) and syenite (including larvikite) and nepheline–syenite pegmatites (0.8–4).
Phosphorus ranges from 20 to about 110 ppm for kimberlite zircons, but it varies from hundreds to thousands of ppm in zircons from granitoid rocks (Fig. 3b), and can reach levels of several percent in metamict grains. Metamict grains, with high U and Th, typically also show high levels of REE substitution, which is balanced in part by substitution of P for Si. The high P contents of metamict grains, therefore, are re-garded as a primary feature, and not an effect of metamictisation.
Titanium contents range from several ppm in zircons from lamproites, kimberlites, dolerite and carbonatite to 500–700 ppm in zircons from the granites of eastern Australia and the Canadian syenite (Tables 3, 4, 5 and 6). However, Ti concentrations commonly are below the detection limit (6 ppm), especially in zircons from kimberlites and mafic rocks.
Manganese concentrations in zircons are mostly be-low the detection limit (2–5 ppm). However, samples from granitic rocks have significantly higher Mn con-tents, ranging from 10 to 700 ppm with a mean of 148 ppm. Mn values reach 1,000 ppm in strongly metamict grains or rims (e.g. the Kyemba Adamellite, NSW).
Iron concentrations are generally below the detection limit (60 ppm); the LAM-ICPMS background is high because of ArO interference. In general, higher Fe con-tents are typical of zircons from the dolerite. Metamict zircons from granitoids have Fe concentrations up to 1– 3%; these are considered to be related to secondary al-teration.
Gallium and strontium rarely show concentrations higher than 1–2 ppm and often are below the detection limit (1 and0.5 ppm, respectively). Metamict zircons from granitoids show the highest values, which are 7 and 36 ppm for Ga and Sr, respectively.
Tantalum and niobium concentrations range from 0.2 to 21 ppm Ta and from 0.4 to 120 ppm Nb; higher
Table 5. Trace element contents (ppm) of zircons from a range of rock types
Rock type Syenite Larvikite
Quartile Min. 1st Quart. Median 3rd Quart. Max. Min. 1st Quart. Median 3rd Quart. Max.
P n.a. 861 1,095 1,269 1,469 2,191 Ti 659 659 659 674 719 106 168 204 226 531 Mn n.a. <1.5 – <8.5 14 84 Fe n.a. <18 <42 147 442 5,389 Ga <0.45 – – – <0.74 <0.18 – <0.27 0.53 10 Sr <0.07 – <0.08 0.11 0.15 0.46 0.61 0.70 1.1 11 Y 120 136 148 159 171 3,075 4,941 5,702 7,069 11,326 Nb 0.75 0.83 0.89 0.92 0.94 6.9 9.0 12.2 16.2 24.3 Sn n.a. <0.92 1.3 1.5 1.9 9.0 Ba <0.05 – – – <0.08 <0.31 0.4 0.6 1.3 47.0 La <0.05 – – <0.09 0.16 0.13 0.85 0.98 1.2 3.1 Ce 2.0 2.2 2.4 2.6 3.1 58 72 83 99 140 Pr <0.03 – <0.03 0.05 0.12 0.7 3.1 3.8 4.2 5.1 Nd 0.28 <0.30 0.33 0.38 0.45 11 39 47 55 104 Sm <0.25 0.28 0.36 0.49 0.69 17 44 51 58 82 Eu 0.19 0.28 0.34 0.43 0.60 2.6 6.4 7.8 9.2 14 Gd 1.7 1.9 2.1 2.2 2.6 75 156 183 215 330 Dy 8.6 11 12 13 14 301 530 603 727 1,130 Ho 4.0 4.5 5.0 5.3 5.5 108 181 207 258 407 Er 21 23 26 28 29 473 737 864 1,055 1,689 Yb 56 63 67 70 73 985 1,372 1,678 1,959 3,013 Lu 12 13 14 15 16 192 257 309 365 558 Hf (wt%) 0.59 0.59 0.59 0.59 0.59 0.86 0.96 1.03 1.09 1.31 Ta 0.4 0.4 0.4 0.4 0.5 3.8 5.3 6.9 9.1 15 Pb 1.9 2.0 2.4 3.0 3.4 5.8 11 17 23 36 Th 24 28 31 34 35 258 381 595 826 1,453 U 71 78 88 98 104 304 399 662 908 1,450 Number of analyses 4 36
contents are found only in metamict grains from the Kyemba Adamellite, NSW. These elements show a strong positive correlation over the whole range of
concentration (Fig. 3c). The Nb/Ta ratio of zircons varies from 0.3 to 48 with an average of 3, and is broadly correlated with Y (and HREE) contents (Fig. 3d); the
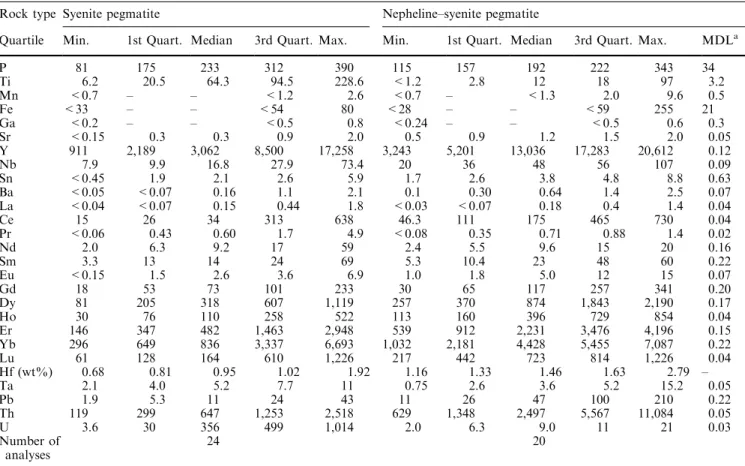
Table 6. Trace element contents (ppm) of zircons from a range of rock types
Rock type Syenite pegmatite Nepheline–syenite pegmatite
Quartile Min. 1st Quart. Median 3rd Quart. Max. Min. 1st Quart. Median 3rd Quart. Max. MDLa
P 81 175 233 312 390 115 157 192 222 343 34 Ti 6.2 20.5 64.3 94.5 228.6 <1.2 2.8 12 18 97 3.2 Mn <0.7 – – <1.2 2.6 <0.7 – <1.3 2.0 9.6 0.5 Fe <33 – – <54 80 <28 – – <59 255 21 Ga <0.2 – – <0.5 0.8 <0.24 – – <0.5 0.6 0.3 Sr <0.15 0.3 0.3 0.9 2.0 0.5 0.9 1.2 1.5 2.0 0.05 Y 911 2,189 3,062 8,500 17,258 3,243 5,201 13,036 17,283 20,612 0.12 Nb 7.9 9.9 16.8 27.9 73.4 20 36 48 56 107 0.09 Sn <0.45 1.9 2.1 2.6 5.9 1.7 2.6 3.8 4.8 8.8 0.63 Ba <0.05 <0.07 0.16 1.1 2.1 0.1 0.30 0.64 1.4 2.5 0.07 La <0.04 <0.07 0.15 0.44 1.8 <0.03 <0.07 0.18 0.4 1.4 0.04 Ce 15 26 34 313 638 46.3 111 175 465 730 0.04 Pr <0.06 0.43 0.60 1.7 4.9 <0.08 0.35 0.71 0.88 1.4 0.02 Nd 2.0 6.3 9.2 17 59 2.4 5.5 9.6 15 20 0.16 Sm 3.3 13 14 24 69 5.3 10.4 23 48 60 0.22 Eu <0.15 1.5 2.6 3.6 6.9 1.0 1.8 5.0 12 15 0.07 Gd 18 53 73 101 233 30 65 117 257 341 0.20 Dy 81 205 318 607 1,119 257 370 874 1,843 2,190 0.17 Ho 30 76 110 258 522 113 160 396 729 854 0.04 Er 146 347 482 1,463 2,948 539 912 2,231 3,476 4,196 0.15 Yb 296 649 836 3,337 6,693 1,032 2,181 4,428 5,455 7,087 0.22 Lu 61 128 164 610 1,226 217 442 723 814 1,226 0.04 Hf (wt%) 0.68 0.81 0.95 1.02 1.92 1.16 1.33 1.46 1.63 2.79 – Ta 2.1 4.0 5.2 7.7 11 0.75 2.6 3.6 5.2 15.2 0.05 Pb 1.9 5.3 11 24 43 11 26 47 100 210 0.22 Th 119 299 647 1,253 2,518 629 1,348 2,497 5,567 11,084 0.05 U 3.6 30 356 499 1,014 2.0 6.3 9.0 11 21 0.03 Number of analyses 24 20 a
Typical minimum detection limits for the Perkin–Elmer ELAN 6000 ICPMS
Fig. 1. Chondrite-normalised averaged trace element abun-dances of zircons from different rock types. Data from Tables 3, 4, 5 and 6. Chondrite values are from Taylor and McLennan (1985)
highest ratios are found in zircons from syenite and nepheline–syenite pegmatites and some granitoids.
Zircon does not contain significant amounts of tin or barium. Their concentrations are typically at ppb levels and thus below detection. Slightly higher concentrations of Sn (2–8 ppm) are found in zircons from Norwegian syenite and nepheline–syenite pegmatites and levels of Sn and Ba exceeding 10–100 ppm are found in some zircons from the granitic rocks of eastern Australia.
Previous studies have pointed out the large range of uranium and thorium concentrations in zircon (Ahrens et al. 1967; Speer 1980; Heaman et al. 1990; Belousova et al. 1998; Hoskin and Ireland 2000). The present study shows ranges from 0.1 ppm to over 1% for U and from 1 ppm to 1% for Th. Low values of 6–60 ppm U and 2– 15 ppm Th are characteristic of kimberlitic zircon (Fig. 4a, b). In contrast, zircons from granitoid rocks and pegmatites have the highest contents of these ele-ments.
The Th/U ratio commonly ranges from 0.1 to 1. However, Th/U of 100–1,000 or more is found in zircons from some Norwegian syenite and nepheline–syenite pegmatites, and zircons from the Kovdor carbonatite complex have Th/U of 103–104. Such high Th/U values reflect the unusually low concentrations of U in zircons
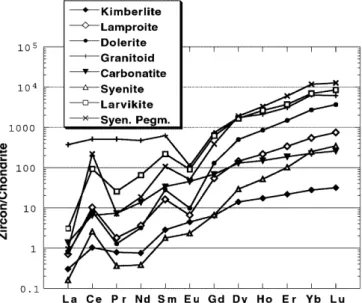
Fig. 2. Chondrite-normalised averaged REE patterns of zircons from a range of rock types. Data from Tables 3, 4, 5 and 6
Fig. 3. Trace element composition of zircons from different rock types
from these rocks: less than 0.1 to 1.12 ppm for the Kovdor carbonatite complex and from 2 to 36.7 ppm for Norwegian pegmatites (Fredricksvaern syenite pegma-tite, Tvedalen and Langesundsfjorden nepheline–syenite pegmatites), whereas Th concentrations are relatively high.
Lead contents commonly range from 2 to 30 ppm, and are generally below the detection limit (1–2 ppm) in zircons from kimberlites and basalts. The presence of Pb in higher amounts reflects the radioactive decay of U and Th, and high Pb concentrations (sometimes over 100 ppm) are found only in metamict grains extremely enriched in U and Th.
The average content of rare earth elements in zircons studied in this work is 1,800 ppm. However, there is a range of REE concentrations from tens to several tens of thousand ppm in zircons of different origins (Tables 3, 4, 5 and 6). Zircons from pegmatites and granitoid rocks contain the highest concentrations of REE. The highest values, over 4.2 wt%, have been found in the metamict rims of zircons from the Round Mount granite, Ebor, NSW. These high levels of REE are considered to be
primary, and to reflect the broad correlation between REE (Y), U and Th contents (Fig. 4a) rather than an effect of metamictisation. However, relative enrichment in the LREE appears to be especially correlated with metamictisation, and may be a secondary feature. Slightly lower amounts of REE are typical for grains from mafic rocks (basalts and dolerite), with concen-trations from several hundred to 1,000 ppm and rarely over 2,000 ppm. The total REE content of carbonatite and lamproite zircons seldom exceeds 600–700 ppm. The lowest REE concentrations, commonly less than 50 ppm, are a characteristic feature of kimberlitic zircons (Belousova et al. 1998, 1999).
The typical chondrite-normalised REE patterns of zircon rise rapidly from Sm to Lu (Fig. 2). The (Yb/ Sm)N ratio can be used as a measure of the HREE enrichment of zircons. The average (Yb/Sm)N value for the zircons presented in this work is 44. The most pronounced HREE enrichment is found in pegmatitic zircons (Fig. 4c, d), where (Yb/Sm)N is commonly over 100–300. In contrast, relatively flat chondrite-normalised REE patterns [(Yb/Sm)N=3–30] are char-acteristic of zircons from kimberlites and carbonatites; some samples show no HREE enrichment with Yb/ Sm1.
Fig. 4. Trace element composition of zircons from different rock types
A positive Ce anomaly is typical of most of the zir-cons analysed in this study (Figs. 2 and 5). The size of the Ce anomaly is given by Ce/Ce*, where Ce is the chondrite-normalised Ce concentration and Ce* is the average of the chondrite-normalised La and Pr concen-trations. Zircons from syenitic pegmatites show the most pronounced Ce anomalies (Ce/Ce* from 2 to over 300), whereas weak Ce anomalies (Ce/Ce* from 1 to 10) are typical of zircons from kimberlites, carbonatites and granitoids. Zircons from rocks other than granitoids may show a positive correlation between Ce/Ce* and Y contents (Fig. 5a), but most zircons from granitoids have Ce/Ce* within a restricted range from 1 to 3, and fall out of the main trend.
The Eu anomaly is calculated as Eu/Eu*, where Eu is the chondrite-normalised Eu value and Eu* is the av-erage of the chondrite-normalised Sm and Gd concen-trations. The depth of the negative Eu anomaly shows a broad positive correlation with Y content (Fig. 5b). The mean kimberlitic and carbonatitic zircons show little or no Eu anomaly. It becomes more significant in zircons
from more felsic, fractionated rock types. The strongest Eu anomalies are found in U, Th, REE-rich (metamict) zircons that crystallised from late magmas) from the Gilgai Leucogranite, Inverell, NSW. There may be a weak positive correlation between the depth of Eu anomalies and Nb/Ta (Fig. 5c), whereas no obvious correlation is observed between Eu and Ce anomalies (Fig. 5d).
Discussion
Element abundances and substitutions
Trace element analyses of zircons from different rock types show a wide range in the concentrations of mea-sured trace elements. Although each class shows a range of zircon compositions, the mean abundances of many trace elements, and the shape and slope of chondrite-normalised trace element patterns, are distinctive for zircons of different origins (Tables 3, 4, 5 and 6, Fig. 1). The broadest trend observed is the general increase of trace element concentrations from zircons of mantle origin (e.g. kimberlitic) towards grains from mafic rock
Fig. 5. Trace element correlations for zircons from different rock types
types and further to those from evolved granitoids and pegmatites.
Many elements behave coherently because they par-ticipate in a coupled substitution in the zircon crystal structure. For example, phosphorus concentrations show a positive correlation with Y and total REE
con-tent over a wide range of zircon composition from dif-ferent sources (Fig. 3b), reflecting the substitution: (REE, Y)3++P5+=Zr4++Si4+. Niobium and Ta correlate positively with Y, SREE and Fe, indicating (REE, Y)3++(Nb, Ta)5+=>2Zr4+ and (REE, Fe)3++(Nb, Ta)5+=>2Zr4+ coupled substitutions.
Uranium and Th substitute directly for Zr; however, they both show a positive correlation with Y (Figs. 4a, b and 6a), as well as with REE and P. This broadly reflects the trace element composition of the parental rocks,
Fig. 6. The fields of zircon compositions used as discriminants for different rock types. ‘Granitoids’ include:1 aplites and leucogra-nites;2granites;3granodiorites and tonalites
where the incompatible element concentrations tend to be higher in the most evolved, fractionated rock types. The Th/U ratios commonly lie in a range from 0.1 to 1 (Tables 3, 4, 5 and 6), whereas the crustal average is about 4, showing that the zircon structure accepts U more easily than Th. Ahrens et al. (1967) suggested that U4+ is preferentially accepted into the zircon structure (relative to Th4+) because its ionic radius is closer to that of Zr4+ (Shannon 1976). However, Th/U reaches almost 1,000 in zircons from some Norwegian syenite and nepheline–syenite pegmatites and 10,000 in the Kovdor carbonatite complex. Such high Th/U values are a result of the unusually low concentrations of U in zircons from these rocks (Fig. 4a), whereas Th concen-trations are moderate to relatively high. Such a rela-tionship reflects Th enrichment of the host rock; the Norwegian pegmatites commonly contain thorite (Neumann 1980).
As mentioned above, the coupled substitution of REE and phosphorus into the zircon structure (Speer 1980; Hinton and Upton 1991) results in high REE abundances in zircon (Tables 3, 4, 5 and 6). The large range of REE concentrations, from tens of ppm to several per cent, distinguishes zircons of different origin. Zircons from pegmatites and granitoids contain the highest concentrations of REE (SREE up to 1.5–2 wt%). Lower amounts of REE (SREE 90–480 ppm) are typical for zircons from mafic rocks, and the lowest SREE (typically less than 50 ppm) concentrations are a char-acteristic feature of kimberlitic zircons. This progression once again reflects the degree of whole rock fractiona-tion.
Because the ionic radii of the REE decrease from La3+to Lu3+(Shannon 1976), the substitution into the zircon lattice becomes progressively easier for the REE of higher atomic number (Nagasawa 1970; Watson 1980; Fujimaki 1986; Heaman et al. 1990; Hinton and Upton 1991; Hanchar et al. 2001). Thus, the typical chondrite-normalised REE zircon patterns increase rapidly from Sm to Lu (Fig. 2). In general, the Yb/Sm ratio shows a positive correlation with Y content, re-flecting the degree of host rock fractionation; the overall shape of the REE patterns reflects an interplay between magma chemistry and the crystal chemistry of the zir-con. LREE enrichment in zircons has been reported previously (Speer 1980; Krasnobayev 1986); some of these bulk analyses may have contained REE-rich in-clusions. The data presented here indicate that LREE enrichment is observed mainly in strongly metamict zircons, and it may not be a primary feature; the de-struction of the lattice during metamictisation would loosen the crystal–chemical constraints on LREE sub-stitution.
A positive Ce anomaly is typical of most of the studied zircons. When Ce3+ is oxidised to Ce4+, it be-haves more like Zr or Hf, and thus is preferred by zircon over the LREE (Figs. 5a and 6c). Zircons from peg-matites show the most pronounced Ce anomalies. In contrast, kimberlitic and carbonatitic zircons show
al-most no Ce anomalies, which may indicate a low oxi-dation state of the parental magma (Shnukov et al. 1989). There is a general positive correlation between the amplitude of the Ce anomaly and the Y content (Fig. 6c), but samples from granitoids have weak Ce anomalies and lie off the main trend. Furthermore, no correlation between zircon Ce anomalies and whole rock Fe2O3/ FeO ratios has been found so far (Belousova 2000). These observations confirm the conclusions of Hinton and Upton (1991) and Guo et al. (1996) that the Ce anomaly is an ambiguous indicator of the oxidation state of the environment.
The depth of the Eu anomaly is also correlated with Y content (Fig. 5b). The kimberlitic zircons show es-sentially no Eu anomaly, but it becomes stronger in the samples from more fractionated and evolved rock types. Eu2+ is less compatible in zircon than Eu3+, but the absence of a negative Eu anomaly in some zircons, and its ubiquitous appearance in zircons from fractionated and relatively oxidised rocks such as granitoids, where most Eu would be expected to be divalent, suggests that these anomalies largely reflect partitioning of Eu2+into plagioclase during magmatic evolution. There is a weak positive correlation between the depth of the Eu anomaly and the Nb/Ta ratio (Fig. 5c). However, no correlation has been observed between the Eu and Ce anomalies in zircon (Figs. 5d and 6d).
The Nb/Ta ratio of zircons analysed in this study varies from 0.3 to 48 with an average value of 3, whereas the chondritic ratio is about 17 (Anders and Grevesse 1989). The low Nb/Ta ratio in zircons can be explained by the fact that Ta can oxidise more easily to 5+valence, whereas some Nb remains in the 4+valence state. In this case, the ionic radius of Ta would be smaller than that of Nb (Shannon 1976), and Ta would go preferentially into the Zr (Hf) lattice site. There is a positive correlation between Nb/Ta and the Y content of zircon (Figs. 3c and 6e). The lowest Nb/Ta values are typical of kim-berlitic zircons and the highest values are found in zir-cons from the most fractionated rocks (granitoids and pegmatites).
Discriminant diagrams
The correlations between rock type and the trace ele-ment compositions of zircon from a wide range of ig-neous rocks can be illustrated with a series of discriminant plots (Fig. 6). The fields for zircons some rock types, e.g. kimberlite, carbonatites and pegmatites, are very distinct in several plots, but those for grains of other origins overlap to different degrees in most plots. A single plot is sufficient for the discrimination of zir-cons from rocks such as kimberlites and nepheline–sye-nite pegmatites, but comparison of several plots can identify zircons from some other igneous rocks. For example, plots of Y versus U, Y versus Yb/Sm and Nb versus Ta (Fig. 6a, b, f) will allow the recognition of dolerite zircons.
Statistical analysis (CART)
In a situation where several populations overlap to dif-ferent degrees in different bivariate spaces, multivariate analysis can identify the combinations of characteristics that distinguish the different populations. For this pur-pose, we have used CART (classification and regression trees), a diagnostic statistical program (Breiman et al. 1984) that was developed for classifying a set of objects, based on multivariate measurements of characteristics (in this case, the chemical analyses) of each of the objects (the mineral grains). This approach has been previously applied to the classification of chromites in diamond exploration samples (Griffin et al. 1997).
The result of a CART analysis is a CART tree (Fig. 7). It resembles a botanical key, with binary switches defined by element concentrations or values of ratios, and thus is easy to use and interpret. An un-known sample (zircon grain) is run through the tree and ends up in a terminal node, which has been assigned a class label (rock type) defined by the majority of the grains in the node. The proportion of grains from the defined class gives an approximate estimate of the probability that an unknown grain falling into this node has been correctly classified. Although the initial devel-opment of the tree is computer intensive, the tree itself consists of easily understood variables and requires no further use of the CART program to classify new sam-ples.
The complete list of elements from the database generated in this study was used to construct an initial CART classification tree (Fig. 7), and to calculate an estimate of its reliability as a predictor of the correct classification of a future sample. In practice, a randomly chosen subset (25%) of the database is kept aside and not used in setting up the tree; this subset then is used for
cross validation of the tree. This cross-validation ap-proach is essential to ensure that the tree has predictive power, i.e. that it can be applied to data other than those used to generate it.
This first tree (Fig. 7) has nine binary splits, based on the concentration of an element or the value of an ele-ment ratio. The eleele-ment-switches selected by the CART program in generating this tree are in good agreement with the those already recognised as useful by inspection of the discriminant plots (Fig. 6), where plots using Y (representing the HREE), U, Ta, Nb, Ce/Ce* and Eu/ Eu* define fields characteristic of zircons from particular rock types.
Table 7 gives the error-rate matrix for the classifica-tion of zircons from different rock types, using this tree. In many cases it shows very high correlation between true and predicted classes (e.g. kimberlite 89%, larvikite 100%). Zircons from the one dolerite studied form a very distinctive group. The high success rate in recogn-ising zircons from some rock types (kimberlite, syenite, larvikite, syenite pegmatites) emphasises the distinctive trace element composition of zircons from these par-ageneses, as represented in this database, and that the discrimination shown in the plots (Fig. 6) is real.
Using this tree, it is possible to recognise a grain from a granitic rock type with a probability of correct pre-diction over 80%. However, the breakdown into classes based on the SiO2 content of the host rock is more ambiguous, with probabilities varying from 13 to 68%; the correlation between predicted and true classes im-proves with increasing whole rock silica content.
Some ‘misclassification’ cases carry useful petroge-netic information. For instance, the partial overlap be-tween kimberlitic and carbonatitic zircons (Table 7) reflects the common spatial and inferred genetic rela-tionship between these two rock types. Similarly, the
Fig. 7. CART tree for the recognition of zircons from different rock types. Terminal nodes indicate predicted rock type, estimated probability and number of observations. Error rate matrix for this classifica-tion is in Table 7
large degree of misclassification of zircons from low-SiO2granitoid rocks to the next higher-SiO2 class (e.g. for granitoids with <65% and 65–70% SiO2) suggests that most of these zircons crystallised from the late-stage magmas, which had higher SiO2than the bulk rock.
Some of the zircon xenocrysts in basalts are distinc-tive enough to classify separately, but a large degree of misclassification of indicates that the xenocrystic mega-cryst zircons in alkali basalts are not a coherent class, but are derived from a variety of crustal and/or mantle rock types. Similarly, the zircons from lamproites are not a coherent group, and classify as derived from a variety of granitoid and syenitic rock types; this suggests that they are crustally derived xenocrysts, as was concluded by Belousova et al. (1999). These examples suggest the
usefulness of this classification for the recognition of source rocks for zircons of unknown origin.
A second CART analysis was carried out, using a short list of elements (U, Th, Y, Yb, Lu and Hf) that are commonly reported in the literature, and which can be collected as part of an integrated U–Pb and Hf-isotope analysis (Griffin et al. 2002b). This ‘short tree’ is shown in Fig. 8 and its error-rate matrix in Table 8. The values for each element switch in this tree are at levels well above the common detection limits for EMP analysis (Y, Hf) or LAM-ICPMS analysis (U, Lu, Yb). This tree also discriminates zircons from several rock types with a high degree of probability: zircons from kimberlites, car-bonatites, mafic rocks (diabase + basalt), syenitic rocks (syenites + larvikites) and Ne–syenite pegmatites are
Table 7. Error-rate matrix for the CART zircon classification Predicted class (%) True class Kimber-lite Carbo-natite Dole-rite Sye-nite Granitoid Ne-syenite and Basalt Larvi-kite <65% SiO2 65–70% SiO2 70–75% SiO2 >75% SiO2 syenite pegmatites Kimberlite 89 14 0 0 0 0 0 0 0 0 0 Carbonatite 10 84 0 0 3 0 2 0 0 14 0 Dolerite 0 0 84 0 16 6 5 3 0 0 0 Syenite 1 3 0 100 0 0 0 0 0 11 0 Granitoid <65% SiO2 0 0 0 0 13 20 2 0 0 3,5 0 Granitoid 65–70% SiO2 0 0 4 0 45 51 7 13 0 7,5 0 Granitoid 70–75% SiO2 0 0 0 0 10 11 58 3 0 0 0 Granitoid >75% SiO2 0 0 0 0 3 11 16 68 0 0 0
Ne-syenite and syenite pegmatites
0 0 0 0 0 0 0 0 93 0 0
Basalt 0 0 0 0 0 0 2 3 0 47 0
Larvikite 0 0 12 0 10 0 7 11 7 18 100
Fig. 8. ‘Short’ CART tree for the recognition of zircons from different rock types. Error rate matrix for this classifica-tion is in Table 8
recognised with a probability of correct classification exceeding 80%. Zircons from granitoids (as a group) are recognised with a probability of >75%, whereas the division of these into groups of different SiO2content is more ambiguous, as with the longer tree. Zircons from granitoids with 65–70% SiO2 consistently classify as coming from rocks with either higher (40%) or lower (30%) SiO2contents. For zircons from the other granite classes, the probability of correct classification by SiO2 group ranges from 49% for those with 70–75% SiO2, to 63% for those with >75% SiO2. Despite this ambiguity, we find that this tree can provide useful information on the broad composition of the source rocks contributing to a given detrital zircon sample.
It is important to note that a CART analysis and the resulting tree are specific to the database used as input (Griffin et al. 1997). Changes in the database can pro-duce a tree with different switches or with similar switches in a different sequence. However, as long as the database is well constructed, the resulting level of dis-crimination (the error rates) should be similar to those reported above. This analysis, therefore, indicates that zircons from different rock types can be recognised at a high level of probability. As further samples are added to the database, and the CART analysis is run again, we expect that this discrimination will improve, although a future CART tree might have a different appearance altogether.
Application to data from the literature
The data generated in this study can be compared with some previously published analyses. In Fig. 9a, we show the mean contents of Hf and Y for zircons from several rock types (data from Tables 3, 4, 5 and 6), together with the discriminant framework proposed by Shnukov et al. (1997). This scheme is in general agreement with the data from this study, but there are several differences in
detail. For example, few of the larvikite samples are quartz-bearing, but the mean Hf–Y value for larvikite zircons falls in the high-Si field of Shnukov et al. (1997). Figure 9b shows other data from the literature; most of these show a similar distribution to the data reported here, and some of the same discrepancies with the scheme of Shnukov et al. (1997). The data of Hoskin et al. (2000) stand out because their Hf contents and Hf/ Y are generally much higher than those reported by other studies.
The data of Hoskin et al. (2000) can be analysed using the long CART tree (Fig. 7). Data reported in other published works (Nagasawa 1970; Murali et al. 1983; Fujimaki 1986; Heaman et al. 1990; Hinton and Upton 1991; Barbey et al. 1995; Ashwal et al. 1999; Pupin and Persoz 1999; Hoskin and Ireland 2000) do not have the full set of elements needed for the ‘long’ CART analysis. However, these data could be tested using the ‘short’ CART tree (Fig. 8). The results of the CART analysis are shown in Table 9.
Using the long CART tree, the data of Hoskin et al. (2000) show a high degree of misclassification. This is directly related to the very high Hf values noted above. These high Hf contents were measured by SHRIMP ion microprobe, using a glass standard, and their anoma-lous nature suggests an analytical problem. Hoskin et al. (2000) present analyses of zircons from several rocks, in which the REE were analysed both by ion-probe and by LAM-ICPMS; the ion-probe value for Hf was used as the internal standard for the LAM-ICPMS analysis. A comparison of the two data sets (Table 10) shows that the mean LAM-ICPMS values for the REE are higher than the mean ion-probe values for zircons from the same rocks by factors from 1.7 to 3.9. This strongly suggests that the ion-probe Hf values are overestimated by two to three times, consistent with their anomalous positions in Fig. 9b. The discrepancy between the LAM-ICPMS values and the ion-probe values in Hoskin et al. (2000) diminishes from the LREE and
Table 8. Error-rate matrix for the ‘short’ CART zircon classification Predicted class (%) True class
Kimb-erlite
Carbo-natite
Mafic rocks Syenitic rocks Granitoids Ne
syenite/ Dolerite Basalt Syenite Monzon./
syenite <65% SiO2 65–70% SiO2 70–75% SiO2 >75% SiO2 pegmatite Kimberlite 88 14 Carbonatite 10 84 18 2 3 Dolerite 80 14 3 23 17 16 Basalt 50 Syenite 2 7 100 Monzonite/syenite 4 75 6 5 11 4 Granitoid <65% SiO2 8 4 55 31 9 5 Granitoid 65–70% SiO2 4 13 6 2 5 Granitoid 70–75% SiO2 4 8 10 26 49 13 Granitoid >75% SiO2 14 14 16 63 Ne syenite/pegmatite 3 7 96
MREE to heavier elements (Th and U). This trend cannot be explained simply by an error in the internal standard value, and suggests a calibration problem in one or both data sets. If the trace element values re-ported by Hoskin et al. (2000) are too high by factors of 1–4, their misclassification using the ‘long’ CART tree is not surprising.
Using the short CART tree, which does not rely on the lighter REE, Nb or Ta, the data of Hoskin et al. (2000) show an improved level of correct classification, similar to the error rates inherent to the tree (Fig. 7,
Table 7). Zircons from a leuconorite (Ashwal et al. 1999) classify mainly as syenitic, consistent with zircon crys-tallisation from late residual magmas, as suggested above. Zircons from an andesite (Fujimaki 1986) and a syenitic xenolith (Hinton and Upton 1991) classify as derived from mafic rocks. Kimberlitic zircons are clearly identified, whereas zircons from a carbonatite (Heaman et al. 1990) are evenly divided between the ‘carbonatite’ and ‘syenitic rocks’ groups. This misclassification, and the fact that our mean carbonatite zircon falls outside the carbonatite field of Shnukov et al. (1997), suggests
Fig. 9. Average Hf and Y concentrations in zircon relative to the fields of zircon composi-tion defined by Shnukov et al. (1997), whereadata from this study,bdata from previous works
that discrimination of carbonatite zircons will be im-proved by a larger database.
Hoskin and Ireland (2000) studied the REE abun-dances of zircons from a several rock types and con-cluded that zircon composition is not generally useful as an indicator of the provenance of zircons in sediments or of inherited zircons in igneous rocks. However, the re-sults of the present study, which incorporates a wider range of rock types and a larger number of trace ments, demonstrate that the distribution of trace ele-ments in zircon reflects host rock composition and crystallisation environment.
Conclusions
This study of zircon trace element signatures has shown that elemental abundances and the shape and slope of chondrite-normalised trace element patterns carry fea-tures characteristic for zircons of particular origins. By taking a multivariate statistical approach, and using a
range of trace elements including at least Hf, U, Th, Y and the HREE, the original rock type of individual zircon grains can be distinguished with a useful degree of confidence. This ability to recognise zircons from specific rock types, with a reasonable degree of confidence, is useful in several situations where the origin of the zircon is not apparent from its geological context.
1. Inherited cores in the zircons of many felsic igneous or metamorphic rocks carry potential information on the original source rock.
2. The parental rock for xenocrystic zircons, such as those found in some alkali basalts or lamproites, can be recognised. For example, Belousova et al. (1999) showed that zircon xenocrysts from lamproites were derived from a range of more felsic crustal rocks. 3. Detrital zircons in sedimentary rocks can be assigned
to specific source lithologies; this adds information to the information (U–Pb age, Hf isotope composition) commonly used to study the provenance of sedi-ments.
Table 9. The results of the CART analysis using data from the literature
True host rock type Long CART tree Short CART tree
Diorite (Hoskin et al. 2000) 57% Mafic/dolerite 71% Granitoid <65% SiO2
29% Granitoid 70–75% SiO2
Granodiorite (Hoskin et al. 2000) 89% Syenitic rocks 62.5% Granitoid 70–75%
SiO2
11% Granitoid 65–70% SiO2 25% Syenitic rocks
12.5% Granitoid <65% SiO2
Adamellite (Hoskin et al. 2000) 71% Syenitic rocks 100% Granitoid 70–75% SiO2
29% Insufficient parameters
Aplite (Hoskin et al. 2000) 100% Syenitic rocks 100% Granitoid <65% SiO2
Leuconorite (Ashwal et al. 1999) Insufficient parameters 92% Syenitic rocks
8% Mafic rock
Andesite (Fujimaki 1986) Insufficient parameters 100% Mafic rock
Xenolith in alkali basalt (Hinton and Upton 1991)
Insufficient parameters 100% Mafic rock
Kimberlite (Heaman et al. 1990) Insufficient parameters 100% Kimberlite
Carbonatite (Heaman et al. 1990) Insufficient parameters 25% Carbonatite
25% Syenitic rocks 50% insufficient parameters
Table 10. Comparison of zircon trace element data reported by Hoskin et al. (2000)
Ce Gd Er Lu Th U BP39 (diorite) SIMS (n=7) 5.5 16.5 109 51 351 415 LAM (n=7) 16.5 35 271 105 393 484 f (LAM/SIMS) 3.00 2.12 2.49 2.06 1.12 1.17 BP7 (granodiorite) SIMS (n=6) 18.4 34 235 109 516 504 LAM (n=7) 46.7 81 535 188 845 758 f (LAM/SIMS) 2.54 2.38 2.28 1.72 1.64 1.50 BP22 (adamellite) SIMS (n=7) 15.7 15.4 95.9 47 118 156 LAM (n=5) 31.4 48 278 109 237 281 f (LAM/SIMS) 2.00 3.12 3.9 2.31 2.01 1.80 BP11 (adamellite) SIMS (n=7) 15.1 13.1 89 52 121 (n=1) 170 (n=1) LAM (n=2) 53 45.5 347 144 322 447 f (LAM/SIMS) 3.51 3.47 3.90 2.76 2.66 2.63
4. Because zircon survives through weathering and erosion cycles, it is commonly found in heavy-mineral samples collected from drainages and soil profiles during geochemical exploration. Recognition of zir-cons related to mineralised rocks can provide a rapid and cost-effective way to find that mineralisation by more detailed sampling. For example, the identifica-tion of kimberlitic zircons can be useful in diamond exploration.
5. The approach outlined here can be applied to detrital zircons collected from modern drainages, to enhance the information obtained by in-situ U–Pb dating and Hf-isotope analysis in large-scale studies of crustal evolution (Bodet and Scha¨rer 2000; Griffin et al. 2002b).
Acknowledgements We are grateful to Peter Kresten and Rory Moore for providing zircon samples from South African kimber-lites and to Dr I.P. Ilupin for supplying zircons from Yakutian kimberlites. We also are grateful to Prof Bruce Chappell (Mac-quarie University), Prof Tom Andersen (Mineralogisk-Geologisk Museum, Oslo), Mr Torgeir Garmo (Lom, Norway) and Dr Sergey Shnukov and Mr Sergey Savenok (Kiev State University) for provision of other samples. The assistance of Norm Pearson and Ashwini Sharma with electron microprobe and ICPMS analyses is very much appreciated. The LAM-ICPMS was purchased from an ARC RIEFP grant with contributing funds from Macquarie University and industry. The laser microprobe used in this work was constructed and installed by Dr Simon Jackson. The manu-script was improved by reviews from Bruce Watson and from Paul Hoskin, who drew attention to the anomalous character of his data. E. Belousova has been partly supported by a Rio Tinto (formerly CRAE) postgraduate scholarship to GEMOC, an Aus-tralian Postgraduate Award, GEMOC funds and a Macquarie University Postgraduate Research Grant. Funding for this study was contributed from several sources including an Australian Research Council grant (WLG), internal Macquarie University grants, ARC National Key Centre funding and industry support. This is publication number 269 from the ARC National Key Centre for Geochemical Evolution and Metallogeny of Continents (www.es.mq.edu.au/GEMOC/).
References
Ahrens LH, Cherry RD, Erlank AJ (1967) Observation on the Th– U relationship in zircons from granitic rocks and from kim-berlites. Geochim Cosmochim Acta 31:2379–2387
Anders E, Grevesse N (1989) Abundances of the elements: mete-oritic and solar. Geochim Cosmochim Acta 53:197–214 Andersen T (1981) En geokjemisk-petrologisk undersøkelse av de
intrusive bergartene i Sande Cauldron, Oslofeltet (in Norwe-gian). Cand Real Thesis, University of Oslo, Norway
Andersen T (1984) Hybridization between larvikite and nord-markite in the Oslo region, SE Norway: a case study from the Sande Cauldron central pluton. Norsk Geol Tidsskr 64:221–233 Andreev AV, Shnyukova EE, Shnyukov SE, Cheburkin AK, Bel-ousova EA, Savenok SP (1993) Geochemical peculiarities and age of heterogeneous accessory zircon populations from gran-itic pebbles of Jurassic conglomerates from Crimea Mountains region. Geol J (Ukraine) 6:128–135
Ashwal LD, Tucker RD, Zinner EK (1999) Slow cooling of deep crustal granulites and Pb-loss in zircon. Geochim Cosmochim Acta 63:2839–2851
Barbey P, Alle´ P, Brouand M, Albare`de F (1995) Rare-earth pat-terns in zircons from the Manaslu granite and Tibetan Slab migmatites (Himalaya):insights in the origin and evolution of a crustally-derived granite magma. Chem Geol 125:1–17
Belousova EA (2000) Trace elements in zircon and apatite: appli-cation to petrogenesis and mineral exploration. PhD Thesis, Macquarie University, Australia
Belousova EA, Griffin WL, Pearson NJ (1998) Trace element composition and cathodoluminescence properties of southern African kimberlitic zircons. Mineral Mag 62(3):355–366 Belousova EA, Griffin WL, O’Reilly SY (1999)
Cathodolumines-cence and geochemical properties of kimberlitic and lamproitic zircons. The 7th International Kimberlite Conference Pro-ceedings, Cape Town, J.B. Dawson Volume, pp 23–29 Berryman AK, Steifenhofer J, Shee SR, Wyatt BA, Belousova EA
(1999) The discovery and geology of the Timber Creek kim-berlites, Northern Territory, Australia. The 7th International Kimberlite Conference Proceedings, Cape Town, J.B. Dawson Volume, pp 30–39
Bodet F, Scha¨rer U (2000) Evolution of the SE-Asian continent from U–Pb and Hf isotopes in single grains of zircon and baddeleyite from large rivers. Geochim Cosmochim Acta 64:2067–2091
Breiman L, Friedman JH, Olshen RA, Stone CJ (1984) Classifi-cation and regression trees. Wadsworth, Belmont, CA Chappell BW, White AJR (1974) Two contrasting granite types.
Pac Geol 8:173–174
Chappell BW, White AJR (1992) I-and S-type granites in the Lachlan Fold Belt. Trans R Soc Edinb Earth Sci 83:1–26 Cherniak DJ, Hanchar JM, Watson EB (1997a) Diffusion of
tetravalent cations in zircon. Contrib Mineral Petrol 127:383– 390
Cherniak DJ, Hanchar JM, Watson EB (1997b) Rare-earth diffu-sion in zircon. Chem Geol 134:289–301
Chyi LL (1986) Characteristics and genesis of zirconium and haf-nium deposits. In: Mineral parageneses. Theophrastus Publi-cations SA, Athens, pp 387–408
Deer WA, Howie RA, Zussman J (1966) An introduction to the rock-forming minerals. Longman Group Limited, London Fujimaki H (1986) Partition coefficients of Hf, Zr, and REE
be-tween zircon, apatite, and liquid. Contrib Mineral Petrol 94:42– 45
Griffin W L, Suter GF, Ryan CG, Sie SH (1989) Proton microp-robe analysis of zircons from kimberlites and other sources (restricted report no 80R). CSIRO Australia, Division of Ex-ploration Geoscience
Griffin WL, Kaminsky FV, O’Reilly SY, Ryan CG, Sobolev NV (1995) Mapping the Siberian lithosphere with garnets and spi-nels. In Sixth International Kimberlite Conference Proceeding, Russia, pp 194–195
Griffin WL, Fisher NI, Friedman JH, Ryan CG (1997) Statistical techniques for the classification of chromites in diamond ex-ploration samples. J Geochem Explor 59:233–249
Griffin WL, Ryan CG, Kaminsky FV, O’Reilly SY, Natapov LM, Win TT, Kinny PD, Ilupin IP (1999) The Siberian lithosphere traverse: mantle terranes and the assembly of the Siberian Craton. Tectonophysics 310:1–35
Griffin WL, Wang X, Jackson SE, Pearson NJ, O’Reilly SY, Xu X, Zhou X (2002a) Zircon chemistry and magma genesis, SE China: in-situ analysis of Hf isotopes, Tonglu and Pingtan Ig-neous Complexes. Lithos (in press)
Griffin WL, Belousova EA, Shee SR, Pearson NJ, O’Reilly SY (2002b) Archean crustal evolution in the northern Yilgarn Craton: U–Pb and Hf-isotope evidence from detrital zircons. Precambrian Res (submitted)
Guo J, O’Reilly SY, Griffin WL (1996) Zircon inclusions in co-rundum megacrysts I: trace element geochemistry and clues to the origin of corundum megacrysts in alkali basalts. Geochim Cosmochim Acta 60:2347–2363
Hanchar JM, Finch RJ, Hoskin PWO, Watson EB, Cherniak DJ, Mariano AN (2001) Rare earth elements in synthetic zircon: part I. synthesis, and rare earth element and phosphorus dop-ing. Am Mineral 86:667–680
Heaman LM, Bowins R, Crocket J (1990) The chemical composi-tion of igneous zircon suites: implicacomposi-tions for geochemical tracer studies. Geochim Cosmochim Acta 54:1597–1607