Hybrid modelling based on support vector regression with genetic
algorithms in forecasting the cyanotoxins presence in the Trasona reservoir
(Northern Spain)
P.J. Garcı´a Nieto
a,n, J.R. Alonso Ferna´ndez
b, F.J. de Cos Juez
c, F. Sa´nchez Lasheras
d, C. Dı´az Mun
˜ iz
b aDepartment of Mathematics, Faculty of Sciences, University of Oviedo, 33007 Oviedo, SpainbCantabrian Basin Authority, Ministry of Agriculture, Food and Environment, 33071 Oviedo, Spain c
Mining Exploitation and Prospecting Department, University of Oviedo, 33004 Oviedo, Spain d
Department of Construction and Manufacturing Engineering, University of Oviedo, 33204 Gijo´n, Spain
a r t i c l e
i n f o
Article history: Received 21 May 2012 Received in revised form 29 October 2012 Accepted 2 January 2013 Available online 29 January 2013 Keywords:
Statistical machine learning techniques Cyanobacteria
Cyanotoxins
Genetic algorithms (GAs) Support vector regression (SVR)
a b s t r a c t
Cyanotoxins, a kind of poisonous substances produced by cyanobacteria, are responsible for health risks in drinking and recreational waters. As a result, anticipate its presence is a matter of importance to prevent risks. The aim of this study is to use a hybrid approach based on support vector regression (SVR) in combination with genetic algorithms (GAs), known as a genetic algorithm support vector regression (GA–SVR) model, in forecasting the cyanotoxins presence in the Trasona reservoir (Northern Spain). The GA-SVR approach is aimed at highly nonlinear biological problems with sharp peaks and the tests carried out proved its high performance. Some physical–chemical parameters have been considered along with the biological ones. The results obtained are two-fold. In the first place, the significance of each biological and physical–chemical variable on the cyanotoxins presence in the reservoir is determined with success. Finally, a predictive model able to forecast the possible presence of cyanotoxins in a short term was obtained.
&2013 Elsevier Inc. All rights reserved.
1. Introduction
Cyanobacteria are photosynthetic prokaryotes lacking the
typi-cal membrane-bound organelles Z such as nuclei and choloroplasts
found in true algae. Consequently they are now classified as
bacteria and known most correctly as cyanobacteria although the
term ‘‘blue green algae’’ is still used frequently. Cyanobacteria can
be found in almost every conceivable environment: in oceans, lakes
and rivers as well as on land. Even they flourish in Artic and
Antarctic lakes (
Quesada et al., 2006
;
Reynolds, 2006
), hotsprings
and wastewater treatments plants. Under favourable conditions,
certain cyanobacteria can dominate the phytoplankton within a
water body and form nuisance blooms. Cyanobacteria have come to
the attention of public health workers because many freshwater
and brackish species can produce a range of potent toxins called
cyanotoxins (
Spoof et al., 2006
;
Reynolds, 2006
), and in freshwater
ecosystems are the most common cause of eutrophication. The
blooms are not always green (
Smith et al., 2008
;
Huisman et al.,
2010
). They can be blue, and even some cyanobacteria species
are coloured brownish-red. Furthermore, the water can become
malodorous when the cyanobacteria in the bloom die.
Therefore, cyanotoxins are an important environmental problem
in reservoirs (
Vasconcelos, 2006
;
Stewart et al., 2006
). Water is
never perfectly clean and polluted water is also a continuing threat
to human health and welfare (
Dası´ et al., 1998
;
de Hoyos et al.,
2004
). The toxins include neurotoxins, hepatotoxins, cytotoxins,
and endotoxins (
Dixit et al., 2005
;
Willame et al., 2005
;
Seckbach,
2007
;
David et al., 2009
;
Peschek et al., 2011
). Most reported
incidents of poisoning by microalgal toxins have occurred in
fresh-water environments, and they are becoming more common and
widespread (
Negro et al., 2000
).
Cyanotoxins are often implicated in what are commonly called
red tides or harmful algal blooms (HABs) (
Fogg et al., 1973
). Lakes
and oceans contain many single-celled organisms called
phytoplank-ton. Under certain conditions, particularly when nutrient
concentra-tions are high, these organisms reproduce exponentially. The
resulting dense swarm of phytoplankton is called an algal bloom.
These can cover hundreds of square kilometres and can be easily seen
in satellite images. Individual phytoplankton rarely live more than a
few days, but blooms can last weeks (
de Hoyos et al., 2004
).
On the one hand, a genetic algorithm (GA) is a search heuristic
that mimics the process of natural evolution (
Goldberg, 1989
;
Davis, 1991
;
Sivanandam and Deepa, 2010
). In this study, this
heuristic is used to carry out a dimensional reduction by identifying
patterns in the experimental data set. This technique permits the
selection of six main variables from a total number of 24 predicting
Contents lists available at
SciVerse ScienceDirect
journal homepage:
www.elsevier.com/locate/envres
Environmental Research
0013-9351/$ - see front matter&2013 Elsevier Inc. All rights reserved. http://dx.doi.org/10.1016/j.envres.2013.01.001
n
Corresponding author. Fax:þ34 985 103354.
variables in this complex problem, with minimal loss of
informa-tion. GAs belong to the larger class of evolutionary algorithms (EA)
(
Haupt and Haupt, 2004
;
Engelbrecht, 2007
), using techniques
inspired by natural evolution, such as inheritance, mutation,
selec-tion, and crossover. On the other hand, support vector regression
(SVR) is a novel learning technique based on statistical learning
theory and the structural risk minimization principle, which has
been successfully used for nonlinear system modelling (
Vapnik
et al., 1997
;
Taboada et al., 2007
;
de Cos Juez et al., 2010
;
Sa´nchez
Lasheras et al., 2010
;
Sua´rez Sa´nchez et al., 2011
). The SVR
parameters must be determined carefully in order to obtain the
most efficient SVR model (
Vapnik, 1998
;
Keerthi, 2002
;
Sch ¨olkopf
and Smola, 2002
;
Shawe-Taylor and Cristianini, 2004
). In other
words, an inappropriate choice of the SVR hyperparameters will
result in over-fitting or under-fitting, and different hyperparameter
settings may also give place to significant differences in
perfor-mance (
Cristianini and Shawe-Taylor, 2000
;
Steinwart and
Christmann, 2008
). Therefore, the optimal selection of SVR
hyper-parameters is an important step in a SVR fit.
The aim of this research work is to construct a hybrid GA–SVR
model to identify spatial cyanotoxins in waterways in the Trasona
reservoir (Principality of Asturias, Northern Spain)
(see Fig. 1)
. The
GA-SVR technique is aimed at highly nonlinear biological
pro-blems with sharp peaks and the tests carried out in this research
work proved its high performance. It is a non-parametric regression
technique and can be seen as an extension of linear models that
automatically models non-linearities and interactions as those
analysed in this innovative research work successfully.
The Trasona reservoir, which was initially destined to the
industrial supply, is complemented at present with a recreational
utilization as a high performance training centre of canoeing. It is an
eutrophic ecosystem, which has been characterized for
cyanobac-teria outcrops in certain periods, which sometimes has produced
variable concentrations of cyanotoxins, mainly mycrocistins.
This innovative research work is structured as follows. In the
first place, the necessary materials and methods are described to
carry out this study. Next the obtained results are shown and
discussed. Finally, the main conclusions drawn from the results
are exposed.
2. Materials and methods 2.1. Experimental data set
The data set used for the hybrid GA–SVR model developed here were collected over 6 years (from 2006 to 2011) from lots of samples in Trasona reservoir and the total number of data processed was about 151 values. The supplementary site-specific experimental data set associated with this article can be found at the following online link:http://dl.dropbox.com/u/36679320/Trasona_reservoir_data_sc.xls. The information of the biological parameters is expressed in biovolume (cubic millimetres per liter) of phytoplankton species. Specifically, this reservoir was sampled several times a month from January 1, 2006 to December 31, 2011, following the sampling protocols for lakes and reservoirs of the Spanish Ministry of Agriculture, Food and Environment, which are consistent with the guidelines established by the European Union and international agencies dealing with these issues (Quesada et al., 2004). In practice, a single point of sampling is taken into account in the place of greater depth of the reservoir. The samples were taken with a Niskin hydrographic bottle at different depths in the euphotic zone (Dası´ et al., 1998). The values of phytoplankton and concentrations of cyanotoxins, chlorophyll and other physicochemical parameters were determined from a sample composed of five homogeneous subsamples obtained with the hydrographic bottle at various equidistant depths in the euphotic zone (Quesada et al., 2004; Reynolds, 2006). In this research work, we have taken into account the two dominant species of the cyanobacteria community:Microcystis aeruginosa(seeFig. 2left) and Woronichinia naegeliana(seeFig. 2right).
The main goal of this research work was to obtain the dependence relationship of cyanotoxins (output variable), expressed in micrograms per liter, as a function of the following two groups of input variables (Reynolds, 2006):
a. Biological parameters
M. aeruginosa(mm3/l) is a type of harmful blue-green algae which is also referred to as colonial cyanobacteria (seeFig. 2left). W. naegeliana(mm3/l) is a kind of cyanobacteria present in waters of a lower trophic status (seeFig. 2right).
Other cyanobacteria (mm3/l): All cyanobacteria excluding the two pre-vious ones. Examples of these species may include some potentially toxic species such as Microcystis flos-aquae, Microcystis novacekii, Anabaena flos-aquaeandAnabaena crassa.
Diatoms (mm3/l) are a major group of algae, and are one of the most common types of phytoplankton.
Chrysophytes (mm3/l) are small flagellates that are a yellowish brown colour. They can also be found singly or in a colony.
Chlorophytes (mm3/l) refer to a highly paraphyletic group of all green algae within the green plants group.
Other phytoplankton species (mm3/l): They represent the rest of the phytoplankton species excluding the previous ones. Chlorophyll concentration (mg/l): Chlorophyll is an extremely important biomolecule, critical in photosynthesis, which allows plants to obtain energy from light.b. Physical–chemical parameters
Water temperature (1C): This is a measurement of the intensity (not amount) of heat stored in a volume of water. Temperature affects the solubility of many chemical compounds and can therefore influence the effect of pollutants on aquatic life. Ambient temperature (1C): Simply means that the temperature of the Trasona reservoir’s surroundings that affects water temperature.Fig. 1.(a) Aerial photograph of the city of Avile´s (Northern Spain) (2) and the Trasona reservoir (1); and (b) an aerial photograph of the Trasona reservoir in great detail.
/l): This is the measurement of the most oxidized and stable form of nitrogen in a water body. Nitrate is the principle form of combined nitrogen found in natural waters. It results from the complete oxidation of nitrogen compounds. Excessive amounts of nitrogen may result in phytoplankton or macrophyte proliferations.
Nitrite concentration (mg NO2/l): This is a measure of a form of nitrogen that occurs as an intermediate in the nitrogen cycle. It is an unstable form that is either rapidly oxidized to nitrate (nitrification) or reduced to nitrogen gas (de-nitrification). This form of nitrogen can also be used as a source of nutrients for plants. Nitrite is toxic to aquatic life at relatively low concentrations.
Ammonium ion concentration (mg/l): This is a measure of the most reduced inorganic form of nitrogen in water. Excess ammonia contributes to eutrophication of water bodies. This results in prolific algal growths that have deleterious impacts on other aquatic life, drinking water supplies, and recreation. Ammonia at high concentrations is toxic to aquatic life. It can be easily oxidized to nitrate in oxidizing environments. Dissolved oxygen concentration (mg O2/l): This is a measure of the amount of oxygen dissolved in water. The dissolved oxygen concentration is subject to diurnal and seasonal fluctuations that are due, in part, to variations in temperature and photosynthetic activity. Dissolved oxygen is essential to the respiratory metabolism of most aquatic organisms. It affects the solubility and availability of nutrients, and therefore the productivity of aquatic ecosystems. Conductivity (mS/cm): This is the measurement of the ability of water to conduct an electric current, that is to say, the greater the content of ions in the water, the more current the water can carry. Ions are dissolved metals and other dissolved materials. Conductivity may be used to estimate the total ion concentration of the water, and is often used as an alternative measure of dissolved solids. Alkalinity (mg CaCO3/l): This is the measurement of the water’s ability to neutralize acids. It usually indicates the presence of carbonate, bicarbonates,or hydroxides. Alkalinity results are expressed in terms of an equivalent amount of calcium carbonate. Waters that have high alkalinity values are considered undesirable because of excessive hardness and high concentra-tions of sodium salts. Water with low alkalinity have little capacity to buffer acidic inputs and are susceptible to acidification (low pH).
Calcium concentration (mg/l) is essential for living organisms, in particular in cell physiology. The hardness of water is generally due to the presence of calcium and magnesium in the water. Harder water has the effect of reducing the toxicity of some metals (i.e., copper, lead, zinc, etc.). pH: Measures the acidity or basicity of an aqueous solution. Is themeasurement of the hydrogen-ion concentration in the water. High pH values tend to facilitate the solubilization of ammonia, heavy metals and salts. The precipitation of carbonate salts (marl) is encouraged when pH levels are high. Low pH levels tend to increase carbon dioxide and carbonic acid concentrations. Lethal effects of pH on aquatic life occur below pH 4.5 and above pH 9.5.
At the same time we have an information that it is quantitative on the abundance of phytoplankton species. They are measured in number of cells per mililiter.Fig. 3(a) shows the evolution of chlorophyll concentration and cyanobac-teria cell number per millilitre in the Trasona reservoir from January of 2006 to December of 2011. Higher levels of both variables are observed at certain periods of the years 2006, 2007 and 2008, which are significantly greater than the values obtained in the years 2009, 2010 and 2011. The peaks inFig. 3(a) correspond to the cyanobacteria blooms: summer and fall of those years. However, there are no cyanobacteria blooms in years 2009, 2010 and 2011.Fig. 3(b) shows the evolution of cyanotoxins concentration and cyanobacteria cell number per millilitre in the Trasona reservoir from January of 2006 to December of 2011. Similarly, the peaks inFig. 3(b) correspond to the cyanobacteria blooms and large concentrations of cyanotoxins.
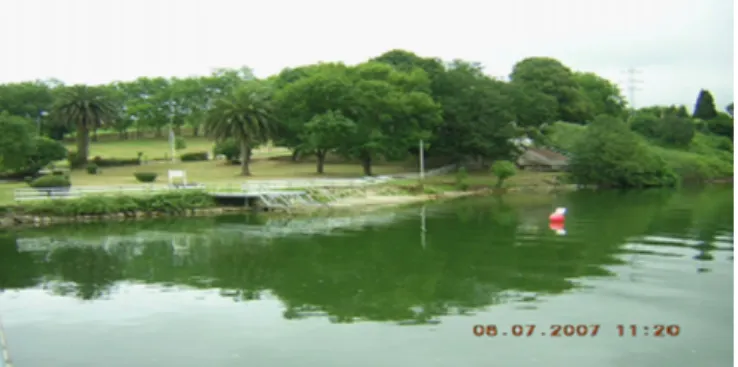
Fig. 4shows a photograph of the Trasona reservoir with a dense bloom of cyanobacteria in 2007.
Specifically, cyanobacteria cell number per millilitre was less than 50,000 and cyanotoxins concentration was always zero in 2009, 2010 and 2011. In this sense, Fig. 5shows a photograph of the Trasona reservoir in summer of 2009 without a bloom of cyanobacteria.
In fact, the Trasona reservoir is an eutrophic ecosystem (Pe´rez-Martı´nez and Sa´nchez-Castillo, 2004;A´lvarez Cobelas and Arauzo, 2006) which has been char-acterized for the presence of cyanobacteria. These last ones sometimes have produced variable concentrations of cyanotoxins, mainly microcystins (Chorus and Bartram, 1999;Quesada et al., 2004). Once the problem has been identified, civil works have been carried out in order to diminish the nutrients contributions to the reservoir. The guideline values for safe recreational water quality raises alert level 2 (World Health Organization, 1998) with values greater than 100,000 cells per millilitre and a microcystin concentration greater than 20.0
mg/l (see
Fig. 3(a) and (b)).The inventories of cells were taken through an inverted microscope on settled samples. The cyanotoxins have been analysed by means of the high-performance liquid chromatography (HPLC) technique (American Public Health Association, 1998). The Trasona reservoir is located near the industrial city of Avile´s (Asturias, Northern Spain). Practically chained to the Trasona reservoir, it is possible to observe a wetland created artificially in order to shelter one changeable aquatic avifauna. This lagoon is able to store approximately 50,000 m3of water and the almost constant level of the water sheet of this lagoon allows the building of nests of different species of birds.
2.2. Genetic algorithms
Mathematical modelling has always been an integral part of behavioural ecology from its inception (Ruxton and Beauchamp, 2008). Mathematical modelling provides an opportunity to formulate hypotheses about ecological behaviour in a rigorous way
Fig. 3.(a) Evolution of chlorophyll concentration and cyanobacteria cell number per millilitre as a function of time in the Trasona reservoir from January of 2006 to December of 2011; and (b) evolution of cyanotoxins concentration and cyanobacteria cell number per millilitre as a function of time in the Trasona reservoir from January of 2006 to December of 2011.
and the solutions that emerge illuminate the relationships between variables thought to be important in driving behaviour. The complexity of models inevitably increases, as relationships among independent variables are refined. While the predictions of more complex models are often subtler, the practical task of solving the equations of the model to find solutions becomes more difficult. This arises for two reasons. First, finding analytic solutions to complex models is challenging and often, remarkably even for relatively simple equations, beyond current capacity (Vrugt and Robinson, 2007;Ruxton and Beauchamp, 2008). Second, tractable solutions are often beyond the abilities of mathematically challenged researchers who are not always very familiar with mathematical techniques. This is especially the case in an empirically strong field like cyanobacterial ecology (Hense and Burchard, 2010;Wang et al., 2010). Heuristic search algorithms provide a mean to locate solutions in less tractable models. These algorithms involve the use of computer programs that search from the solution systematically in a predefined search space. Genetic algorithms (GAs), one particular class of search algorithms, have been used widely in fields as varied as biology, chemistry and economics (Goldberg, 1989;Davis, 1991;Haupt and Haupt, 2004; Sivanandam and Deepa, 2010).
The genetic algorithms (GAs) are based upon Darwin’s Theory of Evolution (Goldberg, 1989;Davis, 1991;Haupt and Haupt, 2004;Sivanandam and Deepa, 2010). The genetic algorithms are modelled on a relatively simple interpretation of the evolutionary process. However, it has proven to be a reliable and powerful optimization technique in a wide variety of applications. Holland in 1975 was the first to propose the use of genetic algorithms for problem-solving (Holland, 1975; Goldberg, 1989;Davis, 1991). The GA uses the current population of strings to create a new population whereby the strings in the new generation are on average better than those in the current population. The selection depends on their fitness value. The selection process determines which string in the current will be used to create the next generation. The crossover process determines the actual form of the string in the next generation (Engelbrecht, 2007;Ordo´n˜ ez Gala´n et al., 2011). Weak individuals are discarded and only the strongest survive. In this way, how do they work?
Initialization: Initially many individual solutions are randomly generated to form an initial population. The population size depends on the nature of the problem, but typically contains hundreds or even thousands of possible solutions. Traditionally, the population is generated randomly,covering the entire range of possible solutions (the search space). Occasion-ally, the solutions may be ‘‘seeded’’ in areas where optimal solutions are likely to be found.
Evaluation: An evaluation function is applied in order to know the goodness of each of the solutions of the population. Stop criterion: The GA will stop when the optimum solution is found or after a certain number of iterations/generations. If the stop criterion is not accom-plished then a new iterative loop is carried out. Selection: During each successive generation, a proportion of the existing population is selected to breed a new generation. Individual solutions are selected through a fitness-based process, where fitter solutions (as measured by a fitness function) are typically more likely to be selected. Certain selection methods rate the fitness of each solution and preferentially select the best solutions. Other methods rate only a random sample of the population, as this process may be very time-consuming. The fitness function,f, maps a chromo-some representation into a scalar value so thatGrepresents the data type of the elements of annx-dimensional chromosome (Haupt and Haupt, 2004; Engelbrecht, 2007;Ordo´n˜ ez Gala´n et al., 2011):f:Gnx-R ð1Þ
Crossover: In genetic algorithms, crossover is a genetic operator used to vary the programming of a chromosome or chromosomes from one generation to the next. It is analogous to reproduction and biological crossover, upon which genetic algorithms are based. Crossover operators can be divided into three main categories based on the arity (i.e. the number of parents used) of the operator. This gives rise to three main classes of crossover operators (Engelbrecht, 2007; Ordo´n˜ ez Gala´n et al., 2011): (1) asexual, where an offspring is generated from one parent; (2) sexual, where two parents are used to produce one or two offspring (the operator employed in the present research) and (3) multi-recombination, where more than two parents are used to produce one or more offspring. Mutation: A genetic operator, used to maintain genetic diversity from one generation of a population of algorithm chromosomes to the next. It is analogous to biological mutation. Mutation is used in support of crossover to ensure that the full range of allele is accessible for each gene. Mutation is applied at a certain probability,pm, to each gene of the offspring,x~iðtÞ, to produce the mutated offspringxiðtÞ. The mutation probability, also referred to as the mutation rate, is usually a small value,pmA½0,1, to ensure that good solutions are not distorted too much. Given that each gene is mutated at probabilitypm, the probability that an individual will be mutated, taking into account that the individual containsnxgenes, is given by (Haupt and Haupt, 2004;Ordo´n˜ ez Gala´n et al., 2011)Probðx~iðtÞis mutatedÞ ¼11pm
nx ð2Þ
Replacement: The least-fit population is replaced with new individuals.2.3. Support vector machines for regression
SVMs are a set of related supervised learning methods used for classification and regression that can universal approximate any multivariate function to any level of accuracy (Cortes and Vapnik, 1995;Vapnik, 1998). SVMs were originally developed to solve classification problems (Taboada et al., 2007). They were later generalized to solve regression problems (Vapnik et al., 1997;de Cos Juez et al., 2010;Sa´nchez Lasheras et al., 2010;Sua´rez Sa´nchez et al., 2011) in a method called support vector regression (SVR). The model produced by support vector classification only depends on a subset of the training data, because the cost function for building the model ignores training points that lie beyond the margin. Analogously, the model produced by SVR only depends on a subset of the training data, because the cost function for building the model ignores any training data that are close (within a threshold
e
) to the model prediction.The basic idea of SVR is briefly described here. Rather than classify new unseen variables!x^ into one of two categoriesy^¼71, we want to predict a real-valued output fory0. Hence, the training data is of the formf!x
i,tig, wherei¼1,2,:::,L,yAR, x
!
ARD(Steinwart and Christmann, 2008;Fletcher, 2009): yi¼w
!
U!xiþb ð3Þ
The SVR uses a more sophisticated penalty function: a penalty is not imposed if the predicted valueyiis less than a distance
e
away from the actual valueti, i.e., if 9tiyi9oe
. Referring toFig. 6, the region bound byyi7e8iis called ane
-insensitive tube. Another modification to the penalty function is that output variables outside the tube are allocated one of two slack variable penalties, depending on whether they lie abovexþor below x
ð Þthe tube, wherexþ4 0, x4 08i(Fletcher, 2009): tiryiþ
e
þxþ ð4Þ tiZyie
x ð5ÞFig. 4.Dense bloom of cyanobacteria on the Trasona reservoir in 2007.
Fig. 5.A photograph of the Trasona reservoir in summer of 2009 without a bloom of cyanobacteria.
The SVM problem can be formulated as follows (Fletcher, 2009; Sua´rez Sa´nchez et al., 2011): min w ! ,b,n 1 2 :w !:2 þCX L i¼1 ðxþ i þx iÞ ( ) /!w,cð!xiÞSþbyiZ
e
þxþ i yið/!w,cð!xiÞSþbÞZe
þx i xþ i ,x iZ0 0 B B @ 1 C C Ai¼1,:::,L ð6Þwherec:X-Zis a transformation of the input space into a new spaceZ, usually a larger dimension space, where we define an inner product by means of a positive definite functionk(kernel trick) (Cristianini and Shawe-Taylor, 2000; Shawe-Taylor and Cristianini, 2004;Steinwart and Christmann, 2008):
/cð!xÞ,cð!x0ÞS¼X i ciðx ! Þciðx !0 Þ ¼kð!x,!x0Þ ð7Þ
The above problem is quadratic with linear constraints, and so the Kuhn– Tucker optimality conditions are necessary and sufficient. The solution, which can be obtained from the dual problem, is a linear combination of a subset of sample points denominated support vectors (s.v.) as follows (Steinwart and Christmann, 2008;Fletcher, 2009): w ! ¼X s:v: bicðx ! iÞ )fw,bðx ! Þ ¼X s:v: bi/cðx ! iÞ,cð!xÞSþb¼ X s:v: bikðx ! i,!xÞ þb ð8Þ The reason that this kernel trick is useful is that there are many regression problems that cannot be linearly regressed in the space of the inputs!x, which might be in a higher dimensional feature space given a suitable mapping. Different kernel functions are described in the bibliography, for example:
Radial basis function (RBF) (Shawe-Taylor and Cristianini, 2004;Fletcher, 2009): kð!xi,!xjÞ ¼eð
99!xi!xj992=2s2Þ
ð9Þ
Polynomial kernel (Shawe-Taylor and Cristianini, 2004;Fletcher, 2009): kð!xi,x
!
jÞ ¼ ðx
!
iU!xjþaÞb ð10Þ
whereaandbare parameters defining the kernel’s behaviour.
To sum up, to use an SVM to solve a regression problem for data that is not linearly separable, we need to first choose a kernel and relevant parameters that can be expected to map the nonlinearly separable data into a feature space where it is linearly separable.
3. Analysis of results and discussion
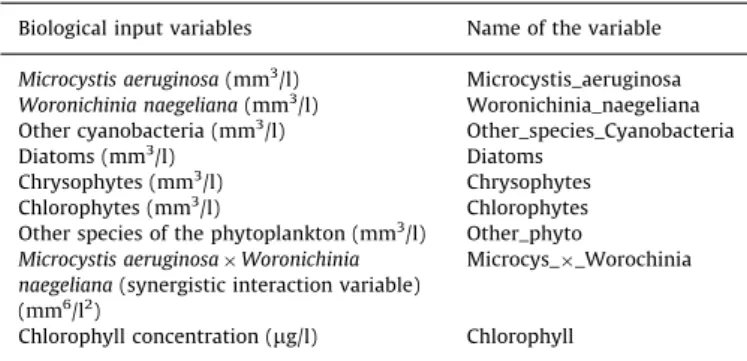
The biological and physical–chemical input variables considered
in this research work are shown in
Tables 1 and 2
, respectively
(
Whitton and Potts, 2000
;
Reynolds, 2006
;
Gault and Marler, 2009
;
Huisman et al., 2010
). Note that one of the variables is equal to the
product of the variable
M. aeruginosa
multiplied by the variable
W. naegeliana
due to the coexistence of these two species of
cyanobacteria in order to reproduce their dynamics without
inter-vention of external factor. This mathematical formulation adds a
multiplicative additional term to take into account the interaction
of both species according to a more realistic modelling in Biology
(
Allman and Rhodes, 2003
;
Barnes and Chu, 2010
). Furthermore,
the information of the biological parameters is expressed here in
biovolume (cubic millimetres per liter) of phytoplankton species
while cyanotoxins (output variable) and chlorophyll concentrations
in micrograms per liter. Therefore, the total number of predicting
variables used was 24 in this study.
It is important to select a model that best fits the experimental
data. In this research work, the fitted hybrid GA–SVM model has a
coefficient of determination
R
2equal to 0.95 and a correlation
coefficient equal to 0.98. These results indicate an important
goodness of fit, that is to say, a good agreement is obtained
between our model and the observed data.
In attempting to model real-world problems or concepts using
computational methods, the selection of an appropriate
repre-sentation is of considerable importance (
Vapnik, 1998
;
de Cos
Juez et al., 2009
). The selection of features can have a considerable
impact on the effectiveness of the overall resulting regression
algorithm: the hybrid GA–SVM model. The main purpose of
feature selection is to reduce the number of features used in
regression while maintaining an acceptable accuracy. This matter
is carried out using an appropriate genetic algorithm in the first
step of the analysis. To fix ideas, a genetic algorithm (GA) is
typically defined by following types of parameters (
Haupt and
Haupt, 2004
;
Engelbrecht, 2007
;
Sivanandam and Deepa, 2010
;
Ordo´n
˜ ez Gala´n et al., 2011
): size of the population, number of
generations, mutation probability, if clones are allowed or not,
criterion to judge the quality of subsets and cardinality of the
subset. In this research work, the basic GA parameters and their
values are shown in
Table 3
.
According to the results shown in
Table 4
, the 24 original
variables of this nonlinear complex problem are reduced to six
main variables with minimal loss of information. In this sense, the
most significant variable in cyanotoxins prediction (output
vari-able) is
W. naegeliana. The second significant variable is the
product of the concentration of
M. aeruginosa
by the
concentra-tion of
W. naegeliana
(Microcys_
_Worochinia), the third is water
Table 1
Set of biological input variables used in this study.
Biological input variables Name of the variable Microcystis aeruginosa(mm3 /l) Microcystis_aeruginosa Woronichinia naegeliana(mm3 /l) Woronichinia_naegeliana Other cyanobacteria (mm3 /l) Other_species_Cyanobacteria Diatoms (mm3 /l) Diatoms Chrysophytes (mm3/l) Chrysophytes Chlorophytes (mm3/l) Chlorophytes Other species of the phytoplankton (mm3
/l) Other_phyto Microcystis aeruginosaWoronichinia
naegeliana(synergistic interaction variable) (mm6
/l2 )
Microcys__Worochinia
Chlorophyll concentration (mg/l) Chlorophyll
Table 2
Set of physical–chemical input variables used in this study. Physical–chemical input variables Name of the variable Water temperature (1C) Water_temperature Ambient temperature (1C) Ambient_temperature Secchi disk depth (m) Secchi_disk_depth Turbidity (NTU) Turbidity Total phosphorus (mg P/l) Total_phosphorus Phosphates concentration (mg PO43
/l) Phosphates_concentration Total nitrogen concentration (mg N/l) Total_nitrogen_concentration Nitrate concentration (mg NO3
/l) Nitrate_concentration Nitrite concentration (mg NO2
/l) Nitrite_concentration Ammonium concentration (mg/l) Ammonium_concentration Dissolved oxygen concentration (mg O2/l) Dissolved_oxygen_concentration Conductivity (mS/cm) Conductivity
Alkalinity (mg CaCO3/l) Alkalinity
Calcium concentration (mg/l) Calcium_concentration
pH values pH_ values
temperature, the fourth is turbidity, the fifth is total phosphorus
and finally the sixth is alkalinity.
The 24 variables are reduced to six variables with minimal loss
of information and they are sufficient to predict the blooms of
cyanobacteria with production of cyanotoxins in the Trasona
reservoir. The cyanobacteria community in this reservoir is
mainly composed by
M. aeruginosa
and
W. naegeliana. If
W. naegeliana
increase significantly its presence, this will be a
clear warning that we may be near a bloom of cyanobacteria with
risk of cyanotoxins. If we add a significant increase in the
presence of
M. aeruginosa, the two cyanobacteria species (M.
aeruginosa
and
W. naegeliana) produce a result greater than the
sum of their individual effects. Thus, the cyanotoxins production
seems to be increased in a nonlinear way by the combined
presence of both species. The physical–chemical parameters
(water temperature, turbidity, total phosphorus and alkalinity)
are also important in the cyanotoxins forecasting since
cyano-bacterial composition of the reservoir depends on them. These
last four variables are directly related to most of the physical–
chemical parameters considered in this study so that it is a logical
result the variables reduction carried out. Thus, water
tempera-ture is a consequence of ambient temperatempera-ture. They are directly
related if no thermal discharge takes place. Obviously, water
temperature is the most influential parameter in the
cyanobac-terial growth, and this variable is kept after the mathematical
process as a main variable. Dissolved oxygen is also related to the
water temperature since as water temperature increases,
dis-solved oxygen decreases. This same behaviour is observed for
turbidity and Secchi disk depth: the higher turbidity, the lower
Secchi disk depth. Total phosphorus is another of the selected
variables while phosphates not. However, phosphates were
implicitly considered since the total phosphorus includes all kind
of phosphorus compounds. The remaining parameters removed
such as the conductivity and nitrogen compounds (total nitrogen,
nitrates, nitrites and ammonium) have very little influence on
cyanobacterial growth. Indeed, it is well known that
cyanobac-teria are able to fix nitrogen from the atmosphere so that it is not
a limiting nutrient as the phosphorus.
At the same time, 15 reservoirs were studied from 2006 to
2011 to fulfil their levels of eutrophication (
Ortiz-Casas and Pen
˜ a
Martı´nez, 1984
). These reservoirs are located in the Cantabrian
basin (Northern Spain). Twelve of these reservoirs have less than
1% of the cyanobacterial biovolume with respect to the overall
biovolume of the samples. Only two of them, the San Andre´s
reservoir and the La Barca reservoir, have more than 30% of the
cyanobacterial biovolume with respect to the overall biovolume
of phytoplankton. Therefore, these two reservoirs are similar to
the Trasona reservoir. However, the Trasona reservoir is singular,
because the cyanobacterial biovolume in case of blooms of
cyanobacteria was equal to 100% with respect to the overall
biovolume of the samples (
Sabater and Nolla, 1991
).
The cyanobacteria community of the San Andre´s reservoir is
mainly composed by
M. aeruginosa
(75%) and
W. naegeliana
(18%).
The values of
W. naegeliana
and high values of the synergistic
variable (Microcys_
_Woronichinia_) warn of a high risk of
cyano-toxins. The water temperature (its high values indicate a shallow
reservoir), the turbidity (high values of an eutrophicated reservoir,
ratified by the high values of the total phosphorus) and the alkalinity
indicate the high risk of cyanotoxins along with the another set of
physicochemical variables discussed above (
Peretyatko et al., 2010
).
The cyanobacteria community of the La Barca reservoir is mainly
composed by
M. aeruginosa
(57%) and
W. naegeliana
(25%). In a
similar way, the values of
W. naegeliana
and the high values of the
synergistic variable warn of a high risk of cyanotoxins. Water
temperature (its high values are characteristic of a reservoir used
to cool a coal power plant). This reservoir is eutrophicated (high
values of the turbidity and total phosphorus). Furthermore, these
values of turbidity are high because it is a shallow reservoir. The
values of a eutrophicated reservoir are ratified by the high values of
total phosphorus. Similarly, the physical–chemical variables
dis-cussed above along with the alkalinity indicate the high risk of
cyanotoxins presence (
Peretyatko et al., 2010
).
As a consequence,
W. naegeliana
is the most important variable
in the generation of cyanotoxins. Specifically, the cyanobacteria
community of the Trasona reservoir is mainly composed by
M. aeruginosa
and
W. naegeliana. It is well known that
M.
aeruginosa
is potentially toxic. Up to now, there is only a partial
evidence of toxicity of
W. naegeliana
(
Willame et al., 2005
). The
majority of the samples which contained cyanotoxins were
dominated by
M. aeruginosa
(47%), followed by
W. naegeliana
(38%). These data do not necessarily indicate that the dominant
cyanobacteria is the largest producer of cyanotoxins (
Willame
et al., 2005
).
In order to take into account the intereraction between input
variables
M. aeruginosa
and
W. naegeliana, not considered in other
works (
Chorus and Bartram, 1999
;
Willame et al., 2005
;
Seckbach,
2007
); it was necessary to add a new input variable equal to the
product of the concentrations of the two above input variables in
additioni to other variables empirically measured in the Trasona
reservoir. The consideration of this interaction is known as synergy
or synergistic behaviour. Therefore, the production of cyanotoxins
from
M. aeruginosa
or from
W. naegeliana
increases due to the
combined presence of both species:
M. aeruginosa
and
W. naegeliana.
The term synergy comes from the Greek word ‘synergos’,
meaning working together (
Corning, 2012
). Among biologists,
the use of the term synergy has been limited until recently
mainly to certain especialized areas, such as the neurochemistry,
cell biology and endocrinology. Moreover, most biologists
recog-nize the subset of synergy known as ‘emergent effects’, as well as
the synergies associated with coevolution. Synergistic response is
a complicating factor in environmental modelling. Synergy has
been advanced as a hypothesis on how complex systems operate.
Environmental systems may react in a nonlinear way to
perturba-tions, so that the outcome may be greater than the sum of the
individual component alterations. Synergy is a room without
walls in terms of which kinds of cooperative relationships are
applicable and it is relevant at every level of living systems, from
enzymes to ecosystems. The synergistic phenomenon has been
Table 4
Evaluation of the importance of the variables that form the model: best variable-subset selected.
Order of relevance Variable
1 Woronichinia_naegeliana 2 Microcystis_aeruginosaWoronichinia_naegeliana 3 Water_temperature 4 Turbidity 5 Total_phosphorus 6 Alkalinity Table 3
Training basic parameters and their values for the genetic algorithm.
Parameters Value
Size of the population 150
Number of generations 100
Mutation probability 1%
Clones allowed No
Criterion (indicates which criterion is to be used in judging the quality of the subsets)
Standard coefficient of determinationR2 Cardinality of the subset that is wanted 6
observed in the two cyanobacteria species (M. aeruginosa
and
W.
naegeliana) and it produces a result greater than the sum of their
individual effects. Therefore, the cyanotoxins production is
increased in a nonlinear way due to the combined presence of
both species (
Reynolds, 2006
;
Corning, 2012
).
On the one hand, water temperature affects the solubility of
many chemical compounds and can therefore influence in the
effect of pollutants on aquatic life. On one hand, the metabolic
oxygen demand grows as water temperature increases, which in
conjunction with reduced oxygen solubility, affects many species
in a negative way (
Arp and Yin, 1992
;
Blais et al., 1998
). On the
other hand, the synthesis of cyanotoxins is more frequent in
warm waters than in cold waters. Temperature affects algal
growth directly, but this growth is also concerned indirectly by
the water temperature due to their influence on solubility of
many chemical compounds. At the same time, ambient
tempera-ture affects the temperatempera-ture of the Trasona reservoir’s
surround-ings and thus it also concerns the water temperature and aquatic
plants growth.
Turbidity is a measurement of the suspended particulate
matter in a water body and is usually produced by anthropogenic
sources as forest harvesting, road building, agriculture, urban
developments, sewage treatment plant effluents, mining and
industrial effluents (
France and Peters, 1995
). High levels of
turbidity increase the total available surface area of solids in
suspension upon which bacteria can grow. High turbidity reduces
light penetration (
Nicholls et al., 2003
) Therefore, it impairs
photosynthesis of submerged vegetation and algae. In turn, the
reduced plant growth may suppress fish productivity. The growth
of phytoplanton contributes to turbidity. High levels of turbidity
increase the total available surface area of solids in suspension
upon which bacteria can grow. High turbidity reduces light
penetration. Therefore, it impairs the photosynthesis of the
submerged vegetation and algae. This situation favours the
dominance of some cyanobacteria as
M. aeruginosa
(main
pro-ductor of cyanotoxins), because of their ability to move up or
down into the water column according to its need of light
irradiance (
Deng et al., 2007
).
Total phosphorus is an essential plant nutrient and is often the
most limiting nutrient to plant growth in fresh water.
Anthro-pogenic sources of total phosphorus are: sewage treatment plant
effluent, agriculture, urban developments (particularly from
detergents), and industrial effluents. Since phosphorus is
gener-ally the most limiting nutrient, its input to fresh water systems
can cause extreme proliferation of algal growth. Inputs of
phos-phorus are the prime contributing factors to eutrophication in
most fresh water systems (
Smol et al., 1983
;
Likens, 1985
;
Prepas
et al., 2001
). Phosphorus can be present as dissolved or
particu-late matter. It is an essential nutrient for plants and it is often the
most limiting nutrient in the growth of the plants in fresh water.
The phosphates concentration (mg PO
43/l) is a measurement of
the oxidized form of the soluble inorganic phosphorus. High
concentrations of orthophosphate generally occur in conjunction
with algal blooms. It is a limiting nutrient in ecological
environ-ments. Its availability may govern the growth rate of the aquatic
organisms. High phosphate concentrations give place to
eutro-phication processes that increases cyanobacterial biomass with
the subsequent cyanotoxins production.
Alkalinity is the measurement of the water’s ability to
neu-tralize acids. It usually indicates the presence of carbonate,
bicarbonates or hydroxides. Waters that have high alkalinity
values are considered undesirable because of excessive hardness
and high concentrations of sodium salts. Water with low
alkali-nity have little capacity to buffer acidic inputs and are susceptible
to acidification (low pH). Acidic precipitation, mining and
indus-trial effluents are anthropogenic sources that lower alkalinity
(
Noges, 1992
;
Keenan and Kimmins, 1993
). Alkalinity is the
measurement of the water’s ability to neutralize acids. It usually
indicates the presence of carbonates, bicarbonates, or hydroxides.
However, carbonates and bicarbonates are part of the carbonate
system with three soluble components in equilibrium: carbonate
(CO
32), bicarbonate (HCO
3) and carbon dioxide (CO
2). When CO
2concentration is increased both carbonate and bicarbonate
con-centrations are decreased (low alkalinity) because of the
men-tioned equilibrium. In these conditions, green algae
(non-cyanobacterial
biomass)
are
favoured
over
cyanobacteria
(
Shapiro, 1984
;
Reynolds, 2006
). Conversely, if the alkalinity is
high, CO
2-limiting conditions, cyanobacteria are predominant
because they possess an environmental adaptation known as a
CO
2concentrating mechanism (
Price, 2011
). Alkalinity results are
expressed in terms of an equivalent amount of the calcium
carbonate.
In the final step of this analysis, once selected the six main
variables by using an appropriate GA, a regression model based on
support vector machines (SVR model) was carried out with
success in order to determine the cyanotoxins concentration in
the Trasona reservoir. Cross validation was the standard
techni-que used here for finding a suitable set of hyperparameters of the
SVR model. The data set is randomly divided into
l
disjoint
subsets of equal size, and each subset is used once as a validation
set, whereas the other
l
1 subsets are put together to form a
training set. In the simplest case, the average accuracy of the
l
validation sets is used as an estimator for the accuracy of the
method. The combination of the hyperparameters with the best
performance is chosen (
Sch ¨olkopf and Smola, 2002
;
Shawe-Taylor
and Cristianini, 2004
;
Steinwart and Christmann, 2008
). In this
way, 10-fold cross-validation was used.
Table 5
shows the
optimal hyperparameters of the fitted SVM model.
Table 5
Optimal hyperparameters of the fitted SVM model.
Parameter Value
SVM-type
n
-regression SVM-kernel Radial basis functiong
0.1666667v 0.26
Number of support vectors 59
0 20 40 60 80 100 120 140 160 0 200 400 600 800 1000 1200 1400 1600 1800 Observation number Cyanotoxin ( µ g/l) Real values Predicted values
Fig. 7.Comparison between the three blooms of cyanobacteria observed and predicted by the model on the Trasona reservoir from 2006 to 2011.
Finally, this research work was able to estimate the presence
of cyanobacteria blooms from 2006 to 2011 in agreement to the
actual cyanobacteria blooms observed with great accurateness
and success (see
Fig. 7
).
4. Conclusions
To summarize, cyanotoxins are a very common and serious
problem for recreational reservoirs throughout the world. The
commonly used diagnostic techniques, like limnological studies,
require high costs for its implementation both from the material
and human points of view. In this sense, there is an absolute
necessity in developing alternative diagnostic techniques such as
the hybrid GA–SVR approach used in this innovative study. The
main findings of this analysis can be summarized as follows:
In the first place, the main purpose of this research work
was to build a cyanotoxin diagnostic model by using a
hybrid GA–SVR approach in Trasona reservoir with the
site-specific experimental data and this goal was achieved
in this study successfully. We have used the biological
input variables (phytoplankton species expressed in
bio-volume and the chlorophyll concentration) in combination
with the most important physical–chemical parameters.
Secondly, a correlation coefficient equal to 0.98 was
obtained when the hybrid GA–SVR technique was applied
to the experimental data set. The predicted results for the
model have demonstrated to be consistent with the
history of observed actual cyanobacteria blooms from
2006 to 2011.
Thirdly, one of the main findings of this study was to set the
order of significance of the variables involved in the
predic-tion of the cyanotoxins presence. Specifically,
W. naegeliana
and the synergetic effect of the variable
M. aeruginosa
multiplied by
W. naegeliana, are the two most influential
variables in the cyanotoxins production. The third variable
is water temperature, the fourth is turbidity, the fifth is total
phosphorus and finally the sixth is alkalinity.
Finally, the authors of this research work have confidence
that the results obtained will be useful to tackle new
future studies in other similar reservoirs and lakes by
applying the same methodology developed here in
pre-dicting the presence of cyanotoxins.
Acknowledgments
Authors wish to acknowledge the computational support
provided by the Departments of Mathematics, Construction and
Mining Exploitation at University of Oviedo as well as pollutant
data in the Trasona Reservoir of Avile´s (Northern Spain) supplied
by the Cantabrian Basin Authority (Ministry of Agriculture, Food
and Environment of Spain). Furthermore, authors would like to
express their gratitude to the Department of Education and
Science of the Principality of Asturias for its partial financial
support (Grant reference FC-11-PC10-19). Finally, the English
grammar and spelling of the manuscript have been revised by a
native person.
References
Allman, E.S., Rhodes, J.A., 2003. Mathematical Models in Biology: An Introduction. Cambridge University Press, New York.
A´lvarez Cobelas, M., Arauzo, M., 2006. Phytoplankton 457 responses to varying time scales in a eutrophic reservoir. Arch. Hydrobiol. Ergeb. Limnol. 40, 69–80.
American Public Health Association, 1998. American Water Works Association, Water Environment Federation. Standard Methods for the Examination of Water and Wastewater, no. 20. APHA/AWWA/WEF, Washington.
Arp, P.A., Yin, X., 1992. Predicting water fluxes through forests from monthly precipitation and mean monthly air temperature records. Can. J. For. Res. 22, 864–877.
Barnes, D.J., Chu, D., 2010. Introduction to Modeling for Biosciences. Springer, New York.
Blais, J.M., France, R.L., Kimpe, L.E., Cornett, R.J., 1998. Climatic changes in northwestern Ontario have had a greater effect on erosion and sediment accumulation than logging and fire: evidence from 210Pb chronologhy in lake sediments. Biogeochemistry 43, 235–252.
Chorus, I., Bartram, J., 1999. Toxic Cyanobacteria in Water: A Guide to their Public Health Consequences, Monitoring and Management. Spon Press, New York. Corning, P., 2012. Nature’s Magic: Synergy in Evolution and the Fate of
Human-kind. Cambridge University Press, New York.
Cortes, C., Vapnik, V., 1995. Support vector networks. Mach. Learn. 20, 273–297. Cristianini, N., Shawe-Taylor, J., 2000. An Introduction to Support Vector Machines
and Other Kernel-based Learning Methods. Cambridge University Press, Cambridge, UK.
Dası´, M.J., Miracle, M.R., Camacho, A., Soria, J.M., Vicente, E., 1998. Summer phytoplankton assemblages across trophic gradients in hard-water reservoirs. Hydrobiologia 369–370, 27–43.
David, P., Fewer, D.P., K ¨oykk ¨a, K., Halinen, K., Jokela, J., Lyra, C., Sivonen, K., 2009. Culture-independent evidence for the persistent presence and genetic diver-sity of microcystin-producing Anabaena (Cyanobacteria) in the Gulf of Finland. Environ. Microbiol. 11 (4), 855–866.
Davis, L., 1991. Handbook of Genetic Algorithms. Van Nostrand Reinhold, New York.
de Cos Juez, F.J., Sa´nchez Lasheras, F., Garcı´a Nieto, P.J., Sua´rez Sua´rez, M.A., 2009. A new data mining methodology applied to the modelling of the influence of diet and lifestyle on the value of bone mineral density in post-menopausal women. Int. J. Comput. Math 86 (10–11), 1878–1887.
de Cos Juez, F.J., Garcı´a Nieto, P.J., Martı´nez Torres, J., Taboada Castro, J., 2010. Analysis of lead times of metallic components in the aerospace industry through a supported vector machine model. Math. Comput. Model 52 (7–8), 1177–1184.
de Hoyos, C., Negro, A., Aldasoro, J.J., 2004. Cyanobacteria distribution and abundance in the spanish water reservoirs during thermal stratification. Limnetica 23 (1–2), 119–132.
Deng, D.-G., Xie, P., Zhou, Q., Yang, H., Guo, L.-G., 2007. Studies on temporal and spatial variations of phytoplankton in lake Chaohu. J. Integr. Plant Biol. 49 (4), 409–418.
Dixit, A., Dhaked, R.K., Alam, S.I., Singh, L., 2005. Military potential of biological neurotoxins. Toxin Rev. 24 (2), 175–207.
Engelbrecht, A.P., 2007. Computational Intelligence: An Introduction. Wiley, New York.
Fletcher, T., 2009. Support Vector Machines Explained: Introductory Course. Internal Report. University College London (UCL), London.
Fogg, G.E., Stewart, W.D.P., Fay, P., Walsby, A.E., 1973. The Blue-green Algae. Academic Press, London.
France, R.L., Peters, R.H., 1995. Predictive model of the effects on lake metabolism of decreased airborne litterfall through riparian deforestation. Conserv. Biol. 9 (6), 1578–1586.
Gault, P.M., Marler, H.J., 2009. Handbook on Cyanobacteria: Biochemistry, Biotechnology and Applications. Nova Science Publishers, New York. Goldberg, D.E., 1989. Genetic Algorithms in Search, Optimization and Machine
Learning. Addison-Wesley, New York.
Haupt, R.L., Haupt, S.E., 2004. Practical Genetic Algorithms. Wiley-Interscience, New York.
Hense, I., Burchard, H., 2010. Modelling cyanobacteria in shallow coastal seas. Ecol. Model. 221 (2), 238–244.
Holland, J.H., 1975. Adaptation in Natural and Artificial Systems. The University of Michigan Press, Ann Arbor.
Huisman, J., Matthijs, H.C.P., Visser, P.M., 2010. Harmful Cyanobacteria. Springer, New York.
Keenan, R.J., Kimmins, J.P., 1993. The ecological effects of clear-cutting. Environ. Rev. 1, 121–144.
Keerthi, S.S., 2002. Efficient tuning of SVM hyper-parameters using radius/margin bound and iterative algorithms. IEEE Trans. Neural Networks 13 (5), 1225–1229. Likens, G.E., 1985. An Ecosystem Approach to Aquatic Ecology: Mirror Lake and its
Environment. Springer-Verlag.
Negro, A.I., de Hoyos, C., Vega, J.C., 2000. Phytoplankton structure and dynamics in Lake Sanabria and Valparaı´so reservoir (NW Spain). Hydrobiologia 424, 25–37. Nicholls, K.H., Steedman, R.J., Carey, E.C., 2003. Changes in phytoplankton com-munities following logging in the drainage basins of three boreal forest lakes in north-western Ontario. Can. J. Fish. Aquat. Sci. 60, 43–54.
Noges, P., 1992. Changes in the ionic composition of Lake Vorts ¨arv (Estonian Republic). Limnologia 22, 115–120.
Ortiz-Casas, J.L., R., Pen˜ a Martı´nez, 1984. Applicability of the OECD eutrophication models to Spanish reservoirs. Verh. Int. Ver. Limnol. 22 (3), 1521–1535. Ordo´n˜ ez Gala´n, C., Rodrı´guez-Pe´rez, J.R., Martı´nez Torres, J., Garcı´a Nieto, P.J., 2011.
Analysis of the influence of forest environments on the accuracy of GPS measurements by using genetic algorithms. Math. Comput. Model. 54 (7–8), 1829–1834.
Pe´rez-Martı´nez, C., Sa´nchez-Castillo, P., 2004. Temporal occurrence ofCeratium hirundinellain spanish reservoirs. Hydrobiologia 452 (1–3), 101–107. Peretyatko, A., Teissier, S., De Backer, S., Triest, L., 2010. Assessment of the risk of
cyanobacterial bloom occurrence in urban ponds: probabilistic approach. Ann. Limnol.-Int. J. Limnol. 46 (2), 121–133.
Peschek, G.A., Obinger, C., Renger, G., 2011. Bioenergetic Processes of Cyanobac-teria: From Evolutionary Singularity to Ecological Diversity. Springer, New York.
Prepas, E.E., Pinel-Alloul, B., Planas, D., Method, G., Paquet, S., Reedyk, 2001. Forest harvest impacts on water quality and aquatic biota on the boreal plain: introduction to the TROLS program. Can. J. Fish. Aquat. Sci. 58, 421–436. Price, G.D., 2011. Inorganic carbon transporters of the cyanobacterial CO2
con-centrating mechanism. Photosynth. Res. 109, 47–57.
Quesada, A., Sanchis, D., Carrasco, D., 2004. Cyanobacteria in spanish reservoirs. How frequently are they toxic? Limnetica 23 (1–2), 109–118.
Quesada, A., Moreno, E., Carrasco, D., Paniagua, T., Wormer, L., de Hoyos, C., Sukenik, A., 2006. Toxicity ofAphanizomenon ovalisporum(cyanobacteria) in a spanish water reservoir. Eur. J. Phycol. 41 (1), 39–45.
Reynolds, C.S., 2006. Ecology of Phytoplankton. Cambridge University Press, New York.
Ruxton, G.D., Beauchamp, G., 2008. The application of genetic algorithms in behavioural ecology, illustrated with a model of anti-predator vigilance. J. Theor. Biol. 250, 435–448.
Sabater, S., Nolla, J., 1991. Distributional patterns of phytoplankton in Spanish reservoir: first results and comparison after fifteen years. Verh. Int. Ver. Limnol. 24 (2), 1371–1375.
Sa´nchez Lasheras, F., Vila´n Vila´n, J.A., Garcı´a Nieto, P.J., del Coz Dı´az, J.J., 2010. The use of design of experiments to improve a neural network model in order to predict the thickness of the chromium layer in a hard chromium plating process. Math. Comput. Model. 52 (7–8), 1169–1176.
Sch ¨olkopf, B., Smola, A.J., 2002. Learning with Kernels: Support Vector Machines, Regularization, Optimization and Beyond. The MIT Press, Cambridge, MA. Seckbach, J., 2007. Algae and Cyanobacteria in Extreme Environments. Springer,
New York.
Shapiro, J., 1984. Blue-green dominance in lakes: the role and management significance of pH and CO2. Int. Rev. Gesamten Hydrobiol. 4 (69), 765–780. Shawe-Taylor, J., Cristianini, N., 2004. Kernel Methods for Pattern Analysis.
Cam-bridge University Press, New York.
Sivanandam, S.N., Deepa, S.N., 2010. Introduction to Genetic Algorithms. Springer, New York.
Smith, M.J., Shaw, G.R., Eaglesham, G.K., Ho, L., Brookes, J.D., 2008. Elucidating the factors influencing the biodegration of cylindrospermopsin in drinking water sources. Environ. Toxicol. 23 (3), 421–423.
Smol, J.P., Brown, S.R., McNeely, R.N., 1983. Cultural disturbances and trophic history of a small meromictic lake from central Canada. Hydrobiologia 103, 125–130.
Spoof, L., Berg, K.A., Rapala, J., Lahti, K., Lepisto, L., Metclaf, J.S., Codd, G.A., Meriluoto, J., 2006. First observation of cylindrospermopsin in Anabaena lapponica isolated from the boreal environment (Finland). Environ. Toxicol. 21 (6), 552–560.
Steinwart, I., Christmann, A., 2008. Support Vector Machines. Springer, New York. Stewart, I., Webb, P.M., Schluter, P.J., Shaw, G.R., 2006. Recreational and occupa-tional field exposure to freshwater cyanobacteria—a review of anecdotal and case reports, epidemiological studies and the challenges for epidemiologic assessment. Environ. Health 5 (6), 1–13.
Sua´rez Sa´nchez, A., Garcı´a Nieto, P.J., Riesgo Ferna´ndez, P., del Coz Dı´az, J.J., Iglesias-Rodrı´guez, F.J., 2011. Application of an SVM-based regression model to the air quality study at local scale in the Avile´s urban area (Spain). Math. Comput. Model. 54 (5–6), 1453–1466.
Taboada, J., Matı´as, J.M., Ordo´n˜ ez Gala´n, C., Garcı´a Nieto, P.J., 2007. Creating a quality map of a slate deposit using support vector machines. J. Comput. Appl. Math. 204 (1), 84–94.
Vapnik, V., Golowich, S.E., Smola, A., 1997. Support vector method for function approximation, regression estimation, and signal processing. Adv. Neur. In. 9, 281–287.
Vapnik, V., 1998. Statistical Learning Theory. Wiley-Interscience, New York. Vasconcelos, V., 2006. Eutrophication, toxic cyanobacteria and cyanotoxins: when
ecosystems cry for help. Limnetica 25 (1–2), 425–432.
Vrugt, J.A., Robinson, B.A., 2007. Improved evolutionary optimization from genetically multimethod search. Proc. Natl. Acad. Sci. 104, 708–711. Wang, Z., Huang, K., Zhou, P., Guo, H., 2010. A hybrid neural network model for
cyanobacteria bloom in Dianchi lake. Proc. Environ. Sci. 2, 67–75.
Whitton, B.A., Potts, M., 2000. The Ecology of Cyanobacteria: Their Diversity in Time and Space. Springer, New York.
Willame, R., Jurckzak, T., Iffly, J.F., Kull, T., Meriluoto, J., Hoffman, L., 2005. Distribution of hepatotoxic cyanobacterial blooms in Belgium and Luxem-bourg. Hydrobiologia 551, 99–117.
World Health Organization, 1998. Guidelines for Drinking-water Quality: Health Criteria and Other Supporting Information, vol. 2, Geneva.