Mineta Transportation Institute Publications
7-2017
Feasibility Study of a Campus-Based Bikesharing
Program at UNLV
Hualiang Teng
University of Nevada, Las Vegas Boniphace Kutela
University of Nevada, Las Vegas Eneliko Mulokozi
University of Nevada, Las Vegas Bingyi Hu
Beijing Jiaotong University Yang Jiao
University of Nevada, Las Vegas
See next page for additional authors
Follow this and additional works at:http://scholarworks.sjsu.edu/mti_publications Part of theTransportation Commons
This Report is brought to you for free and open access by SJSU ScholarWorks. It has been accepted for inclusion in Mineta Transportation Institute Publications by an authorized administrator of SJSU ScholarWorks. For more information, please [email protected].
Recommended Citation
Hualiang Teng, Boniphace Kutela, Eneliko Mulokozi, Bingyi Hu, Yang Jiao, and Haiqing Li. "Feasibility Study of a Campus-Based Bikesharing Program at UNLV"Mineta Transportation Institute Publications(2017).
MNTRC Report 12-64
Funded by U.S. Department of Transportation D etr oit R eg ion al T ra ns it St ud y: A St ud y o f F ac to rs t ha t E na ble a nd I nh ibi t E ffe cti ve R eg ion al T ra ns it M NT RC R epo rt 1 2-2 2 M ar ch 20
Feasibility Study of a Campus-Based
Bikesharing Program at UNLV
The Mineta Transportation Institute (MTI) was established by Congress in 1991 as part of the Intermodal Surface Transportation Equity Act (ISTEA) and was reauthorized under the Transportation Equity Act for the 21st century (TEA-21). MTI then successfully competed to be named a Tier 1 Center in 2002 and 2006 in the Safe, Accountable, Flexible, Efficient Transportation Equity Act: A Legacy for Users (SAFETEA-LU). Most recently, MTI successfully competed in the Surface Transportation Extension Act of 2011 to be named a Tier 1 Transit-Focused University Transportation Center. The Institute is funded by Congress through the United States Department of Transportation’s Office of the Assistant Secretary for Research and Technology (OST-R), University Transportation Centers Program, the California Department of Transportation (Caltrans), and by private grants and donations.
The Institute receives oversight from an internationally respected Board of Trustees whose members represent all major surface transportation modes. MTI’s focus on policy and management resulted from a Board assessment of the industry’s unmet needs and led directly to the choice of the San José State University College of Business as the Institute’s home. The Board provides policy direction, assists with needs assessment, and connects the Institute and its programs with the international transportation community.
MTI’s transportation policy work is centered on three primary responsibilities:
Research
MTI works to provide policy-oriented research for all levels of government and the private sector to foster the development of optimum surface transportation systems. Research areas in -clude: transportation security; planning and policy development; interrelationships among transportation, land use, and the environment; transportation finance; and collaborative labor-management relations. Certified Research Associates conduct the research. Certification requires an advanced degree, gener -ally a Ph.D., a record of academic publications, and profession-al references. Research projects culminate in a peer-reviewed publication, available both in hardcopy and on TransWeb, the MTI website (http://transweb.sjsu.edu).
Education
The educational goal of the Institute is to provide graduate-lev-el education to students seeking a career in the devgraduate-lev-elopment and operation of surface transportation programs. MTI, through San José State University, offers an AACSB-accredited Master of Science in Transportation Management and a graduate Certifi -cate in Transportation Management that serve to prepare the na-tion’s transportation managers for the 21st century. The master’s degree is the highest conferred by the California State
Univer-sity system. With the active assistance of the California Department of Transportation, MTI delivers its classes over a state-of-the-art videoconference network throughout the state of California and via webcasting beyond, allowing working transportation professionals to pursue an advanced degree regardless of their location. To meet the needs of employers seeking a diverse workforce, MTI’s education program promotes enrollment to under-represented groups. Information and Technology Transfer
MTI promotes the availability of completed research to professional organizations and journals and works to integrate the research findings into the graduate education program. In addition to publishing the studies, the Institute also sponsors symposia to disseminate research results to transportation professionals and encourages Research Associates to present their findings at conferences. The World in Motion, MTI’s quarterly newsletter, covers innovation in the Institute’s research and education pro-grams. MTI’s extensive collection of transportation-related publications is integrated into San José State University’s world-class Martin Luther King, Jr. Library.
DISCLAIMER
MTI/MNTRC BOARD OF TRUSTEES
Karen Philbrick, Ph.D. Executive Director Peter Haas, Ph.D. Education Director
Directors
MNTRC
Hilary Nixon, Ph.D. Research and Technology Transfer Director Brian Michael Jenkins National Transportation Safety and Security CenterBen Tripousis
National High-Speed Rail Connectivity Center Asha Weinstein Agrawal, Ph.D. National Transportation Finance Center Founder, Honorable Norman
Mineta (Ex-Officio)
Secretary (ret.), US Department of Transportation
Vice Chair
Hill & Knowlton, Inc.
Honorary Chair, Honorable Bill Shuster (Ex-Officio)
Chair
House Transportation and Infrastructure Committee United States House of Representatives
Honorary Co-Chair, Honorable Peter DeFazio (Ex-Officio)
Vice Chair
House Transportation and Infrastructure Committee United States House of Representatives
Chair, Nuria Fernandez (TE 2017)
General Manager and CEO Valley Transportation Authority
Vice Chair, Grace Crunican (TE 2019)
General Manager
Bay Area Rapid Transit District
Executive Director, Karen Philbrick, Ph.D.
Mineta Transportation Institute San José State University
Joseph Boardman (Ex-Officio)
Chief Executive Officer Amtrak
Anne Canby (TE 2017)
Director OneRail Coalition
Donna DeMartino (TE 2018)
General Manager and CEO San Joaquin Regional Transit District
William Dorey (TE 2017)
Board of Directors Granite Construction, Inc.
Malcolm Dougherty (Ex-Officio)
Director
California Department of Transportation
Mortimer Downey* (TE 2018)
President
Mort Downey Consulting, LLC
Rose Guilbault (TE 2017)
Board Member
Peninsula Corridor Joint Powers Board (Caltrain)
Ed Hamberger (Ex-Officio)
President/CEO
Association of American Railroads
Steve Heminger* (TE 2018)
Executive Director Metropolitan Transportation Commission
Diane Woodend Jones (TE 2019)
Principal and Chair of Board Lea+Elliot, Inc.
Will Kempton (TE 2019)
Executive Director Transportation California
Art Leahy (TE 2018)
CEO Metrolink
Jean-Pierre Loubinoux (Ex-Officio)
Director General
International Union of Railways (UIC)
Abbas Mohaddes (TE 2018)
CEO
The Mohaddes Group
Jeff Morales (TE 2019)
CEO
California High-Speed Rail Authority
Beverley Swaim-Staley (TE 2019)
President
Union Station Redevelopment Corporation
Michael Townes* (TE 2017)
President
Michael S. Townes, LLC
Marlene Turner, Ph.D. (Ex-Officio)
Interim Dean, College of Business San José State University
Richard A. White (Ex-Officio)
Interim President and CEO American Public Transportation Association (APTA)
Bud Wright (Ex-Officio)
Executive Director
American Association of State Highway and Transportation Officials (AASHTO)
Edward Wytkind (Ex-Officio)
President
Transportation Trades Dept., AFL-CIO
(TE) = Term Expiration or Ex-Officio * = Past Chair, Board of Trustee
A publication of
Mineta National Transit
Reseaerch Consortium
College of BusinessFEASIBILITY STUDY OF A CAMPUS-BASED
BIKESHARING PROGRAM AT UNLV
Hualiang (Harry) Teng, PhD Boniphace Kutela Eneliko Mulokozi Bingyi Hu, PhD Yang Jiao Haiqing Li July 2017
1. Report No. 2. Government Accession No. 3. Recipient’s Catalog No.
4. Title and Subtitle 5. Report Date
6. Performing Organization Code
7. Authors 8. Performing Organization Report
9. Performing Organization Name and Address 10. Work Unit No. 11. Contract or Grant No.
12. Sponsoring Agency Name and Address 13. Type of Report and Period Covered 14. Sponsoring Agency Code
15. Supplemental Notes 16. Abstract
17. Key Words 18. Distribution Statement
CA-MNTRC-16-1248
Feasibility Study of a Campus-Based Bikesharing Program at UNLV July 2017
MTI Report 12-64 Hualiang (Harry) Teng, PhD, Boniphace Kutela, Eneliko Mulokozi, Bingyi Hu, PhD,
Yang Jiao, and Haiqing Li
Mineta National Transit Research Consortium College of Business
San José State University San José, CA 95192-0219 U.S. Department of Transportation Office of the Assistant Secretary for Research and Technology
University Transportation Centers Program 1200 New Jersey Avenue, SE
Washington, DC 20590
Final Report
No restrictions. This document is available to the public through The National Technical Information Service, Springfield, VA 22161
DTRT12-G-UTC21
Bicycle sharing; bike sharing; nonmotorized transportation; active transportation; bicycle travel
Bikesharing systems have been deployed worldwide as a transportation demand management strategy to encourage active modes and reduce single-occupant vehicle travel. These systems have been deployed at universities, both as part of a city program or as a stand-alone system, to serve for trips to work, as well as trips on campus. The Regional Transportation Commission of Southern Nevada (RTCSNV) has built a public bikesharing system in downtown Las Vegas, approximately five miles from the University of Nevada, Las Vegas (UNLV). This study analyzes the feasibility of a campus-based bikesharing program at UNLV. Through a review of the literature, survey of UNLV students and staff, and field observations and analysis of potential bikeshare station locations, the authors determined that a bikesharing program is feasible at UNLV.
Transportation Research Center Sciences and Engineering Building, Room 3253
University of Nevada, Las Vegas 4505 S. Maryland Parkway Las Vegas, NV 89154-4007
To order this publication, please contact: Mineta National Transit Research Consortium
College of Business San José State University San José, CA 95192-0219
Tel: (408) 924-7560 Fax: (408) 924-7565 Email: [email protected]
transweb.sjsu.edu/mntrc
Library of Congress Catalog Card Number: 2017949396
ACKNOWLEDGMENTS
The authors would like to thank Dr. Bruce Turner at UNLV for his contribution to this project. Dr. Turner helped develop the scope, reviewed the survey, and provided a peer review of the report. The authors would also like to thank Mr. David Swallow at the Regional Transportation Commission of Southern Nevada (RTCSNV), who provided the data for this research project.
The authors thank MTI staff, including Executive Director Karen Philbrick, Ph.D.; Publication Support Coordinator Joseph Mercado; and Executive Administrative Assistant Jill Carter.
TABLE OF CONTENTS
Executive Summary 1 Background 1 Methodology 1 Study Findings 2 Conclusions 4 I. Introduction 5II. Research Framework and Methods 9
Research Framework 9
Methods 10
III. Literature Review 11
Bikesharing Technologies 11
Demand for Campus Bikesharing Programs 12
Operation of Campus Bikesharing Programs 13 Financial Aspects of Campus Bikesharing Programs 14
IV. Goals of a Bikesharing Program at UNLV and Performance Metrics
to Assess Program Implementation 15
V. Forecasting Demand for a Bikesharing Program at UNLV 17
Survey Design, Distribution, and Collection 17
Findings 21
Demand Analysis Methodology 28
VI. Determination of Locations for Docking Stations on and Around Campus 46
Benefit and Cost Analysis 46
Financial Analysis 53
VII. Analysis of Transit/Bikesharing Connectivity at UNLV 55
Presence of Bus Stops, Pedestrian Crossing Facilities, and Bike Lanes 55
Bus Frequencies and Ridership 62
Distance from Bus Stops to Bike Stations 63
VIII. Developing a Coherent Program of Improvements 66
University Master Development Plan 76
IX. Recommendations to Minimize Modal Conflicts Between Bike
Riders and Pedestrians 84 X. Conclusions and Recommendations for Future Research 88
Appendix A: Before-Study Survey of the RTC Bikesharing Program 92
Appendix B: After-Study Survey of the RTC Bikesharing Program 98
Appendix C: Goals and Metrics of the Bikesharing Program in
Downtown Las Vegas 103
Appendix D: Summary of Select City Bikesharing Programs 106
Appendix E: A Bikesharing Program for the UNLV Community 112
Appendix F: Enrolled Student Counts for Spring 2014 Classes and
Fall 2014 Classes 122
Abbreviations and Acronyms 132
Endnotes 133
Bibliography 139
About the Authors 143
LIST OF FIGURES
1. Location of the University of Nevada, Las Vegas with Respect to
Downtown Las Vegas, Located Several Miles North of the Campus 7
2. Research Framework 9
3. Proposed Locations for Bikesharing Stations on the Main Campus of UNLV 19 4. Traffic Flow In and Out of the UNLV Campus 20 5. Distribution of the Respondents by Zip Code 24 6. Forecast of Casual and Regular Members for Commuting Using the
Bikesharing Program 36
7. Forecast of Casual and Regular Faculty Members for Commuting 36 8. Forecast of Casual and Regular Staff Members for Commuting 37 9. Forecast of Casual and Regular Student Members for Commuting 37 10. Forecasted Casual and Regular Members for On-Campus Travel 38 11. Forecasted Casual and Regular Faculty Members for On-Campus Travel 39 12. Forecasted Casual and Regular Staff Members for On-Campus Travel 39 13. Forecasted Casual and Regular Student Members for On-Campus Travel 40 14. Relationship between Bike Trips and Bike Population Density 44 15. Relationship between Bike Trips and Bike Acre Density 45 16. Flowchart of Simulation Program for the Proposed Bikesharing Program
at UNLV 49
17. Possible Locations for a Bikesharing Station at Flamingo Road and
Claymont Street 55
18. Possible Locations for Bikesharing Station 1 on Flamingo Road or
Claymont Street 56
19. Bike Route from Station 1 to Campus 56
21. Possible Locations for Bikesharing Station 2 on Maryland Parkway 58 22. Possible Locations for Bikesharing Station 3 on Maryland Parkway 58 23. Possible Locations for Bikesharing Station 3 59 24. Possible Location for the Bikesharing Station on Tropicana Avenue 59 25. Possible Locations for Bikesharing Station 4 60 26. The Sidewalk and Unmarked Crossings at Tropicana Avenue and Wilbur Street 60 27. Possible Bikesharing Station Locations at Tropicana Avenue and
Swenson Street 61
28. Photos at Bikesharing Station 5 61
29. Possible Bikesharing Station Locations on Swenson Street 62
30. Photos at Bikesharing Station 6 62
31. Procedure to Measure the Distance from a Bus Stop to a Bikesharing Station 64 32. Existing Bike Racks and Proposed Bike Stations 66 33. Station 7 at the Health Science Building 67 34. Proposed Site for Bikesharing Station 7 67 35. Station 8 at the Engineering Buildings 68 36. Proposed Sites for Bikesharing Station 8 68
37. Station 9 at Lied Library 69
38. Proposed Sites for Bikesharing Station 9 69 39. Station 10 at the Florence Dungan Humanities Building and the Student Union 70 40. Proposed Site for Bikesharing Station 10 70 41. Station 11 at the Classroom Building Complex 71 42. Proposed Site of Bikesharing Station 11 71
44. Proposed Site of Bikesharing Station 12 72 45. Station 13 at UNLV’s RTC Transit Center 73 46. Bike Racks Located at the Proposed Site for Station 13 73 47. Station 14 at the Tropicana Parking Garage 74 48. Proposed Location for Station 14 at the Tropicana Parking Garage 74 49. Station 15 at the Student Recreation and Wellness Center 75 50. Proposed Site for Bikesharing Station 15 75 51. Existing Conditions and the Proposed 10-year Plan for Expansion at UNLV 76 52. Visualization of Future Expansion at UNLV 77 53. Existing and Proposed Pedestrian and Bicycle Circulation on Campus 78 54. Existing and Proposed Transit on Campus 79 55. Existing Parking Spaces on Campus at UNLV 80
56. Proposed Parking Spaces at UNLV 81
57. Alternate Route for Rail Transit 83
58. Proposed Bike Routes at UNLV 84
59. Identified Locations for Conflict Among Pedestrians, Bicycles, and Vehicles 85 60. Vehicle Conflict at Locations 1 and 3 86 61. Traditional Bike-Lane Markings and Signs 86
62. Walk Your Bike Sign 87
63. Narrow Path Close to the College of Engineering and a Share the Road Sign 87 64. Enrolled Student Counts for Spring 2014 Classes. Scheduled Times from
7:00 a.m. to 8:30 a.m. 122
65. Enrolled Student Counts for Spring 2014 Classes. Scheduled Times from
66. Enrolled Student Counts for Spring 2014 Classes. Scheduled Times from
2:30 p.m. to 4:00 p.m. 124
67. Enrolled Student Counts for Spring 2014 Classes. Scheduled Times from
4:30 p.m. to 6:00 p.m. 125
68. Enrolled Student Counts for Spring 2014 Classes. Scheduled Times from
6:15 p.m. to 8:30 p.m. 126
69. Enrolled Student Counts for Fall 2014 Classes. Scheduled Times from
7:00 a.m. to 8:30 a.m. 127
70. Enrolled Student Counts for Fall 2014 Classes. Scheduled Times from
9:00 a.m. to 2:00 p.m. 128
71. Enrolled Student Counts for Fall 2014 Classes. Scheduled Times from
2:30 p.m. to 4:00 p.m. 129
72. Enrolled Student Counts for Fall 2014 Classes. Scheduled Times from
4:30 p.m. to 6:00 p.m. 130
73. Enrolled Student Counts for Fall 2014 Classes. Scheduled Times from
LIST OF TABLES
1. Age Distribution of the Respondents 22
2. Education Profile of the Respondents 22
3. Income Profile of the Respondents 23
4. Respondents’ Distribution by Current Mode of Transportation 23 5. Likeliness to Use a Bikesharing Program 25 6. Frequency of Use of the Bikesharing Program 25
7. Purpose for Using the Bikes 26
8. Motives for Using the Bikesharing Program 26 9. Stations for Commuting and for On-Campus Activities 27
10. Description of Variables 29
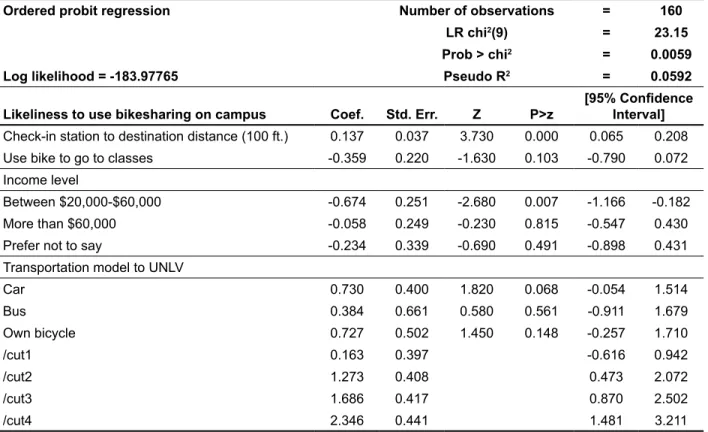
11. Ordered Probit Model for the Likelihood of Using the Bikesharing Program
for Commuting 31
12. Ordered Probit Model for the Frequency for Commuting 32 13. Ordered Probit Model for the Likeliness of Using the Bikesharing Program
for On-Campus Travel 33
14. Ordered Probit Model for the Frequency of On-Campus Travel 34 15. Stated Preference for Data Discount Factors 40
16. Demand and Projected Trips per Day 41
17. Origin-Destination Matrix 42
18. Bikesharing Ridership Data for Other Universities 43 19. Sources for Bikesharing Ridership Data for Other Universities 44
20. Peak-Hour Flow 46
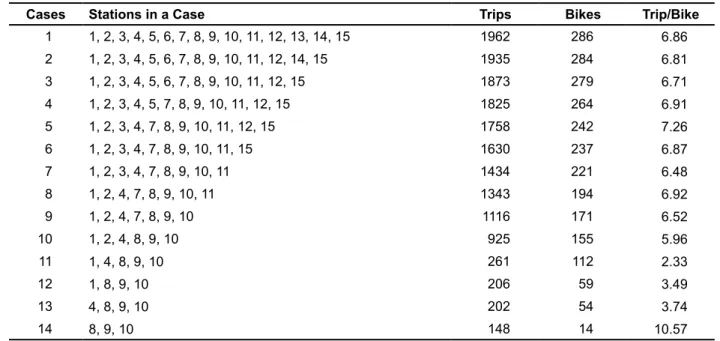
21. Set of Bikesharing Stations Considered in the Selection Process 47 22. Costs and Benefits Smart-Dock System 54
23. Costs and Revenues Smart-Bike System 54 24. Distance from Bike Stations to Bus Stops 64
EXECUTIVE SUMMARY
BACKGROUNDBikesharing systems have been deployed worldwide as a transportation demand management strategy to encourage active modes and reduce single-occupant vehicle travel. Bikesharing may be one strategy to mitigate roadway congestion. Additionally, bikesharing systems have been deployed at universities — as part of a city program or as a stand-alone system — that serve both for trips to work as well as trips on campus. The Regional Transportation Commission of Southern Nevada (RTCSNV) has built a public bikesharing system in downtown Las Vegas, approximately five miles from the University of Nevada, Las Vegas (UNLV). This study analyzes the feasibility of a campus-based bikesharing program at UNLV.
METHODOLOGY
To achieve the objectives of this study, the authors conducted a literature review on university bikesharing systems in the U.S. and abroad. The goals of the proposed program at UNLV were developed as well as metrics to use when monitoring the program’s performance. A questionnaire was distributed to UNLV faculty, staff, and students to obtain the users’ preferences regarding the locations of proposed bikesharing stations as well as the likelihood and frequency that respondents would use the program. Survey responses were used to estimate the demand for a bikesharing system on and around the UNLV campus.
In addition, various cases of bikesharing programs were analyzed, and each case consisted of a different number and location of stations. The demand corresponding to these stations was used as input for a simulation model developed in this study in order to determine the number of docks in stations and bicycles in the system. These sizing parameters were then used in a cost-benefit analysis to determine which cases could achieve the maximum benefit, given a limitation in initial costs. The revenue generated in each case was calculated by estimating the demand. Comparing the revenue with the costs, the cases that could generate sufficient funds for the proposed bikesharing system to be sustainable were determined. After determining the system’s scale, connections with transit were evaluated based on the location of the bikesharing stations and the presence of bus stops in close proximity to the stations.
Researchers performed field observations to identify existing bike racks and their usage. University officials were interviewed about future developments on and off campus to determine the influence of these developments on the bikesharing program. The bike paths between proposed stations were examined to identify which locations might have greater conflicts between bicycles and pedestrians, and identify possible measures to reduce conflicts. Researchers also identified recommendations for infrastructure improvements to enhance safety, reduce potential collisions, and improve cyclist wayfinding.
STUDY FINDINGS
The primary goal of the bikesharing program at UNLV is to reduce congestion on nearby roads by increasing the use of public transportation. This could be achieved by providing enhanced bicycle infrastructure to facilitate first- and last-mile connectivity. In addition, the proposed bikesharing program could improve productivity on campus. The performance metrics included the number of customers using the system for commuting and on-campus travel as well as metrics on fleet usage and customer service.
In total, 241 faculty (n=37), staff (n=94), and students (n=110) responded to a survey that was distributed to the entire university community of 31,500 faculty, staff, and students. Even with a small response rate of 0.76, the sample size was sufficient to conduct a demand analysis. About 50% of those participating in the survey expressed a willingness to use the bikesharing system for commuting, and 60% said they were willing to use the system for on-campus travel. Commuting and on-campus travel are two different types of travel, and the factors determining whether an individual would use a bikesharing system are quite different for each.
For commuting to school, factors that were important to the respondents included: • distance from where they returned the bikes to their destination;
• proximity to a bus line connecting from where they live; • income;
• whether they currently drive to school;
• whether they come to school for work or classes before 8 a.m.; and • education level.
The factors that influenced the frequency of the respondents using a bikesharing system for commuting were quite different. These factors included:
• gender;
• whether they have an office on campus; • whether they are a faculty member; and • education level.
For on-campus travel, the distance from the bikesharing station where the users returned the bikes to their destination, as well as income, were critical factors in choosing to use
The factors that determined frequency of use for on-campus travel included: • gender;
• whether they have an office on campus; • whether the customer is a faculty member; • education level; and
• whether they would use the bikes to attend classes.
Based on a travel demand analysis for a bikesharing system with 16 stations (six on the periphery and 10 on campus), it was estimated that there would be 3,450 members for a program at UNLV, with each making trips of varying frequencies and producing 1,966 trips per day. Some of the stations would only serve a small proportion of total demand, so they may not be worth installing. If one of the six stations on the periphery and three of the 10 stations on campus were installed, the system would serve 216 trips per day. This estimate was based on the average of trips served by bikesharing programs at other universities in the U.S., and thus can be viewed as reasonable.
This study evaluated 14 bikesharing systems, each with a different size in terms of the number of docks, bikes, and locations of stations. Among these cases, two that were considered to be cost-effective included one station on the periphery and three stations on campus. The initial equipment, installation, and operations costs were calculated to be less than $300,000, based on cost data from other universities. The revenue generated from this system was estimated to be greater than the operating cost. The researches recommend these two cases be considered when planning for implementation of a bikesharing system at UNLV.
This study considered six stations along the campus periphery; each located within 400 meters (1/4 mile) from a bus stop to facilitate connections to the transit system. The locations of the proposed stations were identified, taking into consideration the existing bike racks on campus. Spaces are available for every proposed station. In addition, the UNLV master plan and other off-campus development projects were reviewed, which provided strategic direction for possible future expansion of the bikesharing program.
The bike paths connecting all of the stations were identified. Potential conflicts between cyclists and pedestrians were identified, along with recommendations for safety improvements to mitigate these risks. In addition, researchers evaluated overall bicycle network connectivity. The evaluation noted potential improvements that can be made to the bicycle network; however, no critical gaps were identified.
CONCLUSIONS
This study concludes that a bikesharing program is feasible at UNLV. However, several improvements should be implemented before program deployment.
1. The spatial distribution of the demand for a bikesharing program should be confirmed to determine the precise locations of stations on and off campus.
2. Bike paths connecting the stations on and off campus should be developed to ensure a seamless connection with public transportation and safe operations. 3. A cost-effective system (e.g., a dock-smart or bike-smart system) should be chosen
that takes into consideration the trends in technology development.
4. The proposed bikesharing system should be integrated with existing bicycle and trans-portation demand management programs at UNLV to maximize complementarity. For the success of the system, a fee structure better suited to UNLV should be developed to attract people to participate in the program. Resources to operate the system in terms of personnel and equipment, such as bicycle-redistributing vehicles, should be dedicated. Sufficient resources should be made available to maintain the system in a timely manner. In terms of the number and location of stations and the number of bikes and docks, the system should be adjusted with changing dynamics over time. For example, class schedules, which determine travel temporal patterns and spatial patterns, change each semester.
I. INTRODUCTION
Bicycles are an important transportation mode for many travelers and, in recent years, bikesharing systems have been implemented worldwide facilitating first- and last-mile connections to public transportation. Public bikesharing — the shared use of a fleet of bicycles owned and operated by a public or private entity — have been installed in a number of cities and closed-campus communities (e.g., Washington D.C. and Purdue University). Bikesharing programs in the United States and Canada have shown great growth in the years since the first program was introduced in 1994. The introduction of programs that take advantage of information technology (IT) coincided with significant system growth. By 2009, seven systems existed in the U.S. and Canada, including four conventional reservation systems and three IT-based systems. By 2012, 39 systems were in operation in North America — 17 IT-based programs in the U.S. and four IT-based programs in Canada — as well as 18 conventional first- and second-generation bikesharing programs in the U.S. and Canada, representing a 229% increase in three years.According to a study by the Toole Design Group and the Pedestrian and Bicycle Information Center, Tulsa, Oklahoma and Washington, D.C. were early adopters of IT-based bikesharing in the United States.Many studies on bikesharing focus on such aspects as demand forecasting, location design of bike parking, bike equipment, marketing, and business models.
In Las Vegas, a total of three bikesharing program exist. Two are hosted by private companies and are closed systems available only to their employees or renters, respectively: Zappos.com and the Molasky Corporate Center. Zappos.com provides 10 Electra Townie cruisers for employees to ride around downtown Las Vegas. During office hours, employees can check out bikes from the front desk and return them after they use them.A large-scale program with 100 bikes was planned where dockless technology was proposed. This system was not implemented. The Molasky Corporate Center, located in downtown Las Vegas, unveiled the city’s first bikesharing program, making 10 Electra Townie model bikes available at no charge to the building’s 1,000 tenants (Warren and Sebelius, 2012). The bikes are available at the building’s property services desk, and helmets and bike locks are provided as well.
In contrast to the two private systems, the Regional Transportation Commission of Southern Nevada (RTCSNV) implemented a public bikesharing system in downtown Las Vegas. Through a partnership with Bicycle Transit Systems (Bike Transit) and BCycle, 180 bicycles were distributed among 21 stations and are available 24 hours a day.Users can check out bikes for the first 30 minutes for free, and daily passes and monthly memberships are available. Initially, the authors had planned to conduct a before-and-after analysis of the RTCSNV bikesharing program. During to project scheduling, however, this part of the study was not conducted. However, copies of the surveys developed are available in Appendix A and Appendix B and can be used as a reference for other studies. In addition, a detailed description of the downtown Las Vegas bikesharing program is available in Appendix C.
UNLV is the largest public agency in Las Vegas, and trips to and from the university contribute significantly to road congestion. According to Southern Nevada Strong, Maryland Parkway, which connects downtown Las Vegas, McCarran International Airport, and UNLV’s campus, has a bus line that carries the second highest bus ridership outside the Las Vegas Strip.To mitigate the congestion on a regional scale, the researchers propose to develop a bikesharing system at UNLV that has stations close to bus stops on one end and campus buildings on the other end. The researchers realize that bicycles available for work trips to UNLV could also be available for trips between buildings on campus, since these two types of trips are generated during different time periods. Additional stations could be added to fully serve the trips on campus.
The primary purpose of this study was to evaluate the feasibility of such a bikesharing program at UNLV. Specifically, the study addressed the following questions:
• Is there sufficient demand for the bikesharing program? • How big should the system be to serve the demand? • Can the system run in a sustainable manner?
• Would the bikesharing stations be well connected to bus stops or terminals?
• Does the university have future development plans that might influence the system? • Is there a bicycle and pedestrian infrastructure on and off campus sufficient to allow
travelers to travel from their origin to their destination?
It should be noted that the proposed bikesharing system at UNLV is isolated from the system in downtown Las Vegas, as shown in Figure 1. This setting, in which UNLV is located far from the downtown system, makes it different from bikesharing systems in other cities such as New York City, where New York University is part of the downtown system. Due to this difference, there would be no bikesharing trips generated between downtown and UNLV.
Downtown
UNLV
Figure 1. Location of the University of Nevada, Las Vegas (UNLV) with Respect to Downtown Las Vegas, Located Several Miles North of the Campus
To achieve the objectives of this study, the authors conducted a literature review on university bikesharing systems in the U.S. and abroad. The goals of the proposed bikesharing program at UNLV were developed, as well as metrics to monitor the program’s performance. A questionnaire was distributed to UNLV faculty, staff, and students to obtain their preferences as to the locations of the proposed bikesharing stations, and the likelihood that and frequency with which they might use bikesharing. The authors used the survey responses to estimate the demand for the bikesharing system on and around the UNLV campus.
Researchers analyzed bikesharing cases with different numbers of bicycles and station locations. The demand corresponding to these stations was used as an input to a simulation model developed in this study to determine the number of docks needed at UNLV for each station and the number of bicycles in the system. These sizing parameters were used in a cost-benefit analysis to determine which scenario could achieve the maximum benefit given the limitation of the initial costs. In addition, the revenue to be generated for each case was calculated based on the estimated demand. The revenue was compared to the costs to determine which scenarios could generate sufficient funds to make the bikesharing system financially sustainable.
After determining the scale of the bikesharing system, potential multimodal nodes were evaluated, based on the location of the stations and proximity to bus transit. Researchers performed field observations to identify existing bike racks and their usage. Researchers interviewed university officials and reviewed the UNLV master plan regarding future development on and off campus in order to determine the influence these developments might have on the bikesharing program. The bike paths between the proposed bikesharing stations were audited to identify which locations might have higher conflicts between bicycles and pedestrians as well as to identify possible measures to reduce conflicts. In
addition, researchers developed recommendations regarding roadway infrastructure to facilitate safer bicycling to and from campus and regarding on-campus infrastructure to facilitate bicycle navigation.
This report is organized as follows:
• Section II presents the research framework and briefly discusses the research methods.
• Section III presents a literature review that focused on university bikesharing programs in order to gather information regarding what type of system might be needed at UNLV.
• Section IV presents the goals for the proposed bikesharing system at UNLV as well as the performance metrics that could be used in monitoring the proposed system. • Section V presents the methods and findings from a survey conducted of the university’s faculty, staff, and students. In addition, a demand analysis for the bike-sharing program is estimated.
• Section VI presents a cost-benefit and financial analysis of the bikesharing program. • Section VII analyses the transit and bikesharing connectivity at UNLV.
• Section VIII examines the existing transportation program on campus as well as future development both on and off campus.
• Section IX presents recommendations to minimize conflicts between bicycles and pedestrians.
II. RESEARCH FRAMEWORK AND METHODS
RESEARCH FRAMEWORKThe primary purpose of this study was to evaluate the feasibility of such a bikesharing program at UNLV. Specifically, the study addressed the following questions:
• Is there sufficient demand for the bikesharing program? • How big should the system be to serve the demand? • Can the system run in a sustainable manner?
• Would the bikesharing stations be well connected to bus stops or terminals?
• Does the university have future development plans that might influence the system? • Is there a bicycle and pedestrian infrastructure on and off campus sufficient to allow
travelers to travel from their origin to their destination?
The proposed system cannot go into operation without these issues being addressed. In this study, these issues are investigated, one by one, by following the framework shown in Figure 2.
METHODS
First, the goal of the bikesharing system was developed by examining the trips that would be served by the system. With this type of investigation, it is ensured that the bikesharing system to be installed has customers to serve. These customers are the basis of the system’s market for which demand can be estimated.
Second, demand for the bikesharing system was estimated based on a survey of members of the university community and ridership data from existing university bikesharing systems. The demand was analyzed to make sure that customers would use the system for real and reasonable purposes.
Third, the system’s size was determined with an optimization-based, cost-benefit analysis. The benefits of having a bikesharing system include a savings in travel time by using bicycles for travel rather than walking. The costs include capital, installation, and operating costs for the lifetime of the system. The optimization process involved looking at a set of stations and the corresponding docking and fleet size to determine what could attract a sufficient number of customers to make the system sustainable. This process recognizes the relationship between the potential market and the market to be served by considering the size of the bikesharing program. To fully address the interrelationship among the number of bikesharing stations, docks, and bicycles, a simulation model was developed, making sure that these critical parameters were not estimated based on data from other systems. In addition to the cost-benefit analysis, the authors conducted a cost-revenue analysis to take into consideration the membership pricing and make sure that sufficient funds could be generated from the system’s operation.
Fourth, the connectivity of the proposed bikesharing stations with transit was evaluated to ensure that buses pass close to the stations.
Fifth, the future development at UNLV was evaluated to make sure that the proposed bikesharing system could accommodate it.
Sixth, the potential for the bikesharing system to cause safety hazards was evaluated to make sure that there was sufficient roadway capacity for using bicycles. The major routes connecting the bikesharing stations were reviewed, and safety concerns were examined. This report suggests some ways to improve the roadways to support bikesharing and increased bicycle ridership on the UNLV campus.
III. LITERATURE REVIEW
Campus-based bikesharing has recently gained prominence due to the rapid expansion of bikesharing more broadly and new information technologies (IT) being deployed that support closed-campus bikesharing operations. Various studies have identified universities as the main sources and attractors for bikesharing trips. This section provides an overview of bikesharing technologies, demand for based programs, operations of campus-based systems, and financial aspects of these programs. The authors also conducted a review of selected city bikesharing programs which is available in Appendix D.
A study by El-Assi et al. analyzed a station-level commercial program in Toronto and evaluated the effects of the built environment and the weather on bikesharing demand.1 It
was found that university campuses outpaced transit zones, employment density zones, and populated zones in the use of bikesharing. In a study of Minneapolis and St. Paul, Minnesota, Wang et al. revealed that the average trips taken when using city bikesharing stations located within university campuses were at least 42.6% higher than the ones located outside this zone.2 However, in studying Bike Share Toronto, El-Assi et al. noted
that the higher positive correlation between bikesharing trips and the zones on university campuses was seasonal, with fall and winter seasons exhibiting higher coefficients and reflecting student use during the academic year.3 Their finding that university campuses
are attractive to bikesharing users was consistent with findings by Hampshire and Marla from a study based in the cities of Barcelona and Seville, Spain.4
BIKESHARING TECHNOLOGIES
Existing literature categorizes public bikesharing into four key phases or generations:5
1. First Generation—Free Bikes: Bicycles were placed throughout an area that could be freely accessed by the public.
2. Second Generation—Coin-deposit Systems: Users were required to deposit a coin into a dock, check out a bicycle, and return the bicycle to a dock where their deposit was returned.
3. Third Generation—IT-based Systems: Bicycles are made available at digital bike-sharing kiosks that are capable of accepting RFID, credit, and/or debit cards for membership payment or usage.
4. Fourth Generation—Advanced IT-based Bikesharing Systems: Bikesharing networks that include advanced IT features such as demand-responsive rebalancing (e.g., real-time information that informs the system where there are imbalances in supply and demand) and may include dockless station strategies; electric bikes; transit linkages; and mobile, solar docking stations.6
Third and fourth generation IT-based bikesharing (the focus of this feasibility study) utilize electronic and wireless communications for bicycle pick up, drop off, and tracking. North America’s first IT-based bikesharing system, Tulsa Townies, started operating in 2007 in
The typical design of third and fourth generation IT-based systems include docking stations; kiosks or user interface technology for check in and check out; and advanced technology (e.g., magnetic stripe cards, smartcards, smart keys). Typically, these systems enable program operators to track bicycles and access user information that can improve system management and deter bicycle theft. More recent innovations include multimodal billing integration, real-time transit information integration, GPS tracking of bicycles, dynamic pricing (to reduce the need to “rebalance” or relocate bicycles), and flexible and dockless bikesharing systems.
A number of bikesharing vendors, such as Social Bicycles (known as SoBi), offer flexible and dockless equipment using smart bikes. Typically, these bicycles host the locking system on the bicycle itself, enabling users to pick up and drop off bicycles anywhere within a geographic area by either “docking” the bicycle to a station or “locking” the bicycle to an existing bicycle rack or street furniture.7 With flexible and dockless systems, users
identify bicycle availability and locations in real time through mobile or Internet applications or bikesharing kiosk screens. Finally, the geographic proximity of a bikesharing bicycle (docked and dockless systems) may be limited through a technique known as “geofencing.” A geofence is a virtual perimeter that limits the range of mobility of an enabled bicycle by comparing the GPS satellite coordinates of the bicycle, preventing usage outside of the allowable geographic area.8
Bikesharing can be deployed as either “open systems” available to the public or “closed community systems” with access limited to predefined groups, such as members of a university community, residents of an apartment complex, or employees of a particular employer or office park (Shaheen, et al., 2016).9 These closed-campus systems are
available only to the particular campus community they serve. Closed systems typically exclude ineligible users through a combination of mechanisms such as limiting user access as well as employing techniques like geofencing to limit equipment functionality outside a designated campus area.
As of 2013, at least 33 universities in the United States had a bikesharing program (Maynard, 2013).10 In the fall of 2016, Zipcar announced a partnership with Zagster to
launch Zipbike, a campus-based bikesharing program, on 10 college campuses across the United States in January 2017 (McFarland, 2016).11
DEMAND FOR CAMPUS BIKESHARING PROGRAMS
Various studies have utilized a questionnaire to quantify the demand for a bikesharing program.12 Brougham et al. at Dalhousie University in Halifax, Nova Scotia analyzed 800
responses and showed “… that 63% of Dalhousie students were interested in a bike-sharing program; 43% of students would use a bike-bike-sharing program for free or for a small fee and 20% would only use the program if it were free.”13 Bowmick and Varble conducted
the feasibility study for having a bikesharing program at Indiana State University. These authors distributed more than 12,000 online questionnaires to faculty and students through the Student Government Association, and 398 valid surveys were used for the
The same trend was observed by Zonobi and Melara at San José State University in California, where results showed that 69% of the students and 57% of employees would use the program. The survey response rate was 6.2% and 10.3% for students and employees, respectively.15 At Bridgewater State University in Massachusetts, Ashley collected 252
responses (32 electronically and 220 by paper) from students, faculty, administrators, and staff. It was discovered that 84% of the respondents would like to participate in a bikesharing program.16 Among these studies on university bikesharing programs, most
(40%) wanted to use the system for travel between classes, with a typical use of four times or more every week during the semester.17
Actual demand may differ significantly from survey results. Kyung summarized the results of a survey across 41 universities located in the United States that had bikesharing or bike rental programs. Kyung revealed that 83% of these universities had 1,000 members or fewer, and more than 50% had 250 members or fewer.18 This situation calls for more
advanced methodologies to quantify the demand prior to establishing the program.
OPERATION OF CAMPUS BIKESHARING PROGRAMS
Campus bikesharing programs can be owned either by the university, a private company, or jointly; bikes can be rented by means of traditional renting, a bike library, or the use of smart docks/bikes. Kyung found a significant portion (37%) of bikesharing programs were owned by universities, and 73% were operated by universities. Traditional renting and a bike library were the rental modes used by most university programs (45%). Smart bikes accounted for only 5%, and kiosks accounted for 15%. Further, 44% of the universities operated their bikesharing programs year-round, and 77% of the programs operated during semester breaks. A significant number of universities stopped operating the program between January and February.19
At Purdue University in Indiana, McNamara and Mathew found that 15,259 rentals occurred during the first 14 weeks of their bikesharing program. This program had 77 bikes and 13 locations. The most-used bike was rented 450 times within that period, even though some bikes remained idle for as long as 100 days. The peak day had 52 bikes out of 77 that were checked out. Weekends had a very low frequency of bike usage.20
On the Danforth Campus of Washington University in Saint Louis, Heda determined that 13 bike stations equipped with 350-400 bikes best served student travel.21 This number
of bikes was higher than the average number reported by Kyung, who had found that among the respondent universities, 37% (15 universities) had 50 or more bikes, 8% had more than 200 bikes in their systems, and 18% had 50-100 bikes. Regarding the number of stations, two extremes were observed: 53% of the universities had fewer than or equal to five bike stations, while the rest had seven or more. Most universities (33%) had 10-20 bikes at one station.22
FINANCIAL ASPECTS OF CAMPUS BIKESHARING PROGRAMS
Using survey methods, Ashley found that faculty, staff, and administrators were willing to pay a higher membership fee than students. Most respondents would prefer a monthly or yearly subscription-based service with the option to pay using cash or credit cards.23
Respondents in a study by Bhowmick and Varble mostly indicated they preferred a daily charge of $3 and the yearly charge of $20-$50.24 Roughly the same amount for a
membership fee was reported by Zonobi and Melara, who found that most of the students and employees were willing to pay up to $3 a day and $29 a month for usage.25 Kyung
reported that for most universities (40%), there were no membership fees charged, and the university helped subsidize the cost of the program.26 Only 3% of the universities
collected membership fees from the student fees in order to fund the program. Other funding sources included private companies and student congresses, among others. The initial capital to establish a bikesharing program ranged from less than $4,000 (for bike renting only) to greater than $200,000 (bikes rented out for a short period of time like 30 minutes with GPS tracking), and most of the universities (53%) were in the range of $0-$100,000. The annual operating cost for most of existing bikesharing programs (57%) was found to be $65,000 or less.27 Ashley indicated that an IT-based bikesharing system
using cell phones would cost $1,100 per bike for purchase; approximately $100/bike for shipping and onsite assembly; $8/bike/month for wireless connectivity and hosting; and 10% of revenues booked on the platform.28 With three levels of varying technology options
for 32 bikes proposed by Bhowmick and Varble, the startup costs and operating costs were estimated to be from $21,896-$163,668 for high-tech bikes and from $2,480-$5,240 for low-tech bikes. The study pointed out that the program revenue would come from a user subscription, with additional sources from sponsors.29 Work, et al., estimated the total
cost for 24 bikes to be $118,345, while the expected annual revenue was forecasted at $702,000.30 Heda estimated the capital cost ranging between $425,000-$475,000 and the
yearly operating cost to be $140,000. The largest portion of the capital cost was estimated to be for equipment purchase and installation.31
IV. GOALS OF A BIKESHARING PROGRAM AT UNLV
AND PERFORMANCE METRICS TO ASSESS
PROGRAM IMPLEMENTATION
A bikesharing program at a university may serve a variety of trip purposes: 1. Part of a commute to campus (for work or school);
2. Travel between offices for employees;
3. Travel between classes on campus for students; and 4. Travel between the university and nearby community.
The primary goal of the bikesharing program at UNLV is to reduce road congestion by increasing usage of public transportation by providing the infrastructure for the last mile traveled. A secondary goal is to improve productivity on campus. By reducing travel time on campus, people can save time for other activities. The availability of a bikesharing program may also mitigate demand for parking by providing an alternative mobility option to single-occupant vehicle travel.
To measure the performance of the bikesharing system in reducing road congestion, the following metrics could be used:
• Commute trips using the bikesharing program made during peak and non-peak periods.
• Bus stops from which commute trips are made using the bikesharing program. • Areas in the Las Vegas Valley from which commute trips are made using the
bike-sharing program.
• Monthly and yearly trends of bikesharing commute trips.
In addition to these performance measures, other macroscopic measures of the bikesharing system for commuting are:
• Number of bikesharing stations accessible from a bus stop.
• Number of bus stops from which a traveler to UNLV could access a bikesharing station.
• Number of faculty and students who take buses to campus. • Number of trips made by UNLV faculty and students to campus.
The data for these performance measures can be obtained from such sources as the bus management system maintained by the bus operating agency in the Las Vegas area. To measure the performance of the bikesharing system for on-campus travel, the following metrics could be used:
• Total number of daily, monthly, and annual trips made on campus.
• Trip patterns from origin to destination, by time periods during the day, of faculty, students, or others.
• Travel time by bikes.
In addition to performance measures related to congestion and productivity, there are performance measures related to the system facilities.32
Fleet Performance and Safety
• Number of bicycles that are in service.
• Number of bicycles that are inspected/repaired each month. • Number of bicycles that are damaged each month.
Fleet Utilization
• How often stations are full or empty. • How long stations are full or empty.
• Frequency of rebalancings (e.g. during a specific time period). • Number of trips each bike made.
• Duration of idle time for a bike during a trip.
Customer Service
• Number of incoming calls. • Number of lost calls.
Membership
• Total number of users.
V. FORECASTING DEMAND FOR A BIKESHARING
PROGRAM AT UNLV
In this section, a survey is described, including how it was developed and distributed. Descriptive statistics are presented about the responses to the survey. The factors causing people to choose to use the bikesharing program are analyzed based on the survey data using a probit discrete choice model. Actual demand was estimated based on UNLV’s population of faculty, staff, and students, as well as the percentage of the population likely to use the bikesharing program.
The demand for a bikesharing program at UNLV was estimated based on a stated-preference method. According to Kroes and Sheldon, the stated-stated-preference method enables the researcher to extract individual preferences for alternatives with which he or she may not have any experience or for which the alternatives do not exist yet.33 Numerous
methods fall under the stated-preference method, including contingent valuation, group valuation, and discrete choice experiments.
One of the advantages of this method is that it allows researchers to have relatively good-quality information at a relatively low cost. In travel-demand studies, the stated-preference method has been used to determine commuter behavior with respect to introduced or improved transportation systems.34 However, use of stated-preference data in forecasting
does have some limitations because it is hypothetical and is less likely to account for all types of practical constraints.35
Using the stated-preference method for this study, a survey was conducted and a choice model was developed for data analysis. Given this methodology, the following steps were used to estimate the demand for a bikesharing program at UNLV.
1. A survey was conducted; this involved designing, distributing, and collecting the surveys. After the surveys were collected, they were processed for analysis.
2. Demand analysis was conducted that pertained to the factors that might influence respondents as to their likeliness and frequency of using the bikesharing program at UNLV. Ordered probit models were developed to measure these factors.
3. Demand was estimated based on UNLV’s population of faculty, staff, and students, as well as the percentage of the population likely to use the bikesharing program. The percentage was determined based on the respondents’ statements as to their willingness to use the bikesharing system and the uncertainty of those statements. The uncertainties were determined based on the range of trips made by the bike-sharing programs at other universities.
SURVEY DESIGN, DISTRIBUTION, AND COLLECTION
In designing the survey, questionnaires were developed to solicit the likeliness that an individual might choose the bikesharing program for either commuting or on-campus
education level, income level, and home location by zip code. Questions regarding background information of the people being surveyed included their current mode of transportation to the university. The survey had a description of the bikesharing program, and respondents were asked whether they would use the program for commuting and on-campus travel. In addition, they were asked about the purposes for choosing to use the bikesharing system.
Figure 3 shows the locations of the potential bikesharing stations for both commuting and the on-campus travel that was presented in the survey. Based on the map, if respondents expressed a willingness to use the bikesharing system, they were asked at which locations they might pick up and drop off the bikes as well as the number of trips they would make. For on-campus travel, questions were asked about the trip purposes, such as going to class or attending meetings.
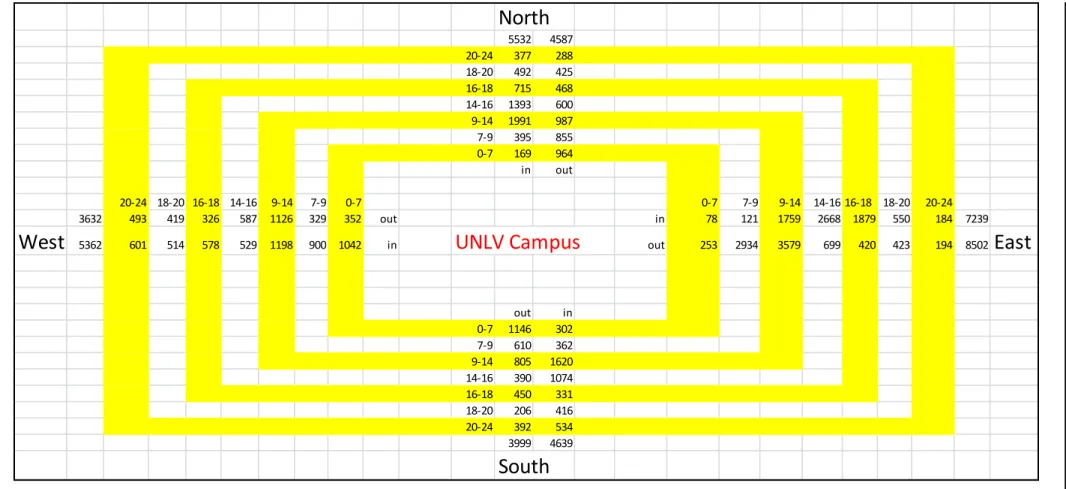
Bikesharing stations on the periphery of the campus were chosen because of their connection to transit services as well as the number of autos in and out of campus in each direction. The number of bus stops within a 400-meter radius of the station was used to measure bus connectivity. The traffic flow of automobiles in and out of campus represented the potential that people would shift their travel mode from auto to public transportation. Traffic flows in and out of the campus (shown in Figure 4) were obtained from the travel-demand model of the Regional Transportation Commission of Southern Nevada.
The potential stations on campus were identified based on data about student enrollment and building occupancy of faculty and staff (see Appendix F). These data were used to determine the percentage of building utilization falling within the service area of each bike station. Distribution of stations inside the campus was based on the following factors:
• Walking Distance. A walking distance of 400 meters was assumed for a user to have access to a given bike station.
• Accessibility. A selected station should be accessed easily by users from any direction.
• Building Service Type. The service area of any selected bike station should consist of buildings that provide several different functions such as libraries, classroom complexes, offices for faculty, staff and students, and residential buildings. This would ensure that all bike stations could service the intended users of the university: faculty, staff, and students.
Survey responses regarding the likelihood of using the bikesharing program can be used to analyze the characteristics of the people who would use the system. When combined with the frequency of the trips respondents indicated they would make, the demand can be estimated. Information on where they checked a bike out and in can be used to determine the origin and destination of their trip, and then to determine the location of the bikesharing stations.
Figure 3. Proposed Locations for Bikesharing Stations on the Main Campus of UNLV
Mineta National
T
ransit Research Consortium
Forecasting Demand for a Bikesharing Program at UNL
V 18-20 492 425 16-18 715 468 14-16 1393 600 9-14 1991 987 7-9 395 855 0-7 169 964 in out 20-24 18-20 16-18 14-16 9-14 7-9 0-7 0-7 7-9 9-14 14-16 16-18 18-20 20-24 3632 493 419 326 587 1126 329 352 out in 78 121 1759 2668 1879 550 184 7239
West
5362 601 514 578 529 1198 900 1042 inUNLV Campus
out 253 2934 3579 699 420 423 194 8502East
out in 0-7 1146 302 7-9 610 362 9-14 805 1620 14-16 390 1074 16-18 450 331 18-20 206 416 20-24 392 534 3999 4639South
The research team first developed the questionnaire, which was reviewed by a professional who had extensive experience in conducting surveys. After it was revised several times, it was approved by UNLV’s Institutional Review Board before it was distributed to the faculty, staff, and students.
The survey was distributed by using Qualtrics software.36 The survey designed in this study
was coded in Qualtrics such that a uniquely identifiable web link was provided to those being surveyed. The people who received an announcement requesting their participation in the survey were able to log onto the link and fill out and submit the survey electronically. Announcements about the survey were sent to the university population in various ways.
• First, the announcement was made on UNLV Today (http://www.unlv.edu/news/ unlvtoday), an electronic newsletter sent out to faculty and staff. Viewers could choose to participate in the survey right away or sometime later.
• Second, the announcement was sent to the entire university population by email to make sure that each member of the UNLV community had the opportunity to participate. Email announcements were sent out three times: first by the communications director at UNLV’s College of Engineering, followed by counterparts in other colleges and schools of the university. Unfortunately, during the time of sending out these notices, there was a transition from one person to another in the position of communications director at the College of Engineering; however, both distributed the announcement the same way.
• Third, the students associated with transportation studies were highly encouraged by their faculty to participate in the survey.
FINDINGS
Descriptive Statistics of Survey Responses
After four months of sending out the survey (August to December 2015), researchers collected 241 responses and analyzed them in this study. The survey was distributed to the entire university of 31,500 faculty, staff and students. Even with a small response rate of 0.76, the sample size was sufficient to conduct demand analysis. These 241 respondents included 38 faculty members, 74 staff, 110 full-time students, six part-time students, and five other people not in these categories. Among the responses, 113 were males and 122 were females; six respondents did not reveal their gender. Regarding age, about 80% of the respondents were 50 or younger, and most respondents (80) were between 21 and 30 years old, as shown in Table 1. This observation is consistent with the age distribution among the university community.
Table 1. Age Distribution of the Respondents
Age Category Count %
<20 32 13 21-30 80 33 31-40 52 22 41-50 35 15 51-60 26 11 61-70 9 4 >71 3 1 No response 4 2 241
Table 2 presents the education profile of the respondents. Of the 231 respondents who answered this question, 16 had a high-school education, 41 had a bachelor’s degree, and 51 had other college degrees; 35% of the respondents (82) did not reveal their education levels. The implicit observation is that most of them were undergraduate students since they either had a high-school education, college credits, or some other degree.
Table 2. Education Profile of the Respondents
Education Level Count %
Grade 12 or less 0 0
High-school graduate 16 7
Some college credit 2 1
Assoc./tech school degree 3 1
Bachelor’s degree 41 18
Graduate degree 3 1
Some other degree 51 22
Prefer not to answer 82 35
No response 33 14
231
The survey responses revealed the annual incomes of the respondents clustered around two ranges, a lower level of around $10,000-$19,000 and a higher level of around $75,000-$99,999 (see Table 3). The lower level may represent students and the higher level faculty and staff.
Table 3. Income Profile of the Respondents Income Count % Less than $10,000 28 12 $10,000 to $19,999 33 14 $20,000 to $29,999 17 7 $30,000 to $39,999 10 4 $40,000 to $49,999 19 8 $50,000 to $59,999 13 6 $60,000 to $74,999 21 9 $75,000 to $99,999 25 11 $100,000 to $124,999 4 2 $125,000 to $149,999 1 0 $150,000 to $199,999 3 1 $200,000 or more 3 1
Prefer not to answer 14 6
Do not know 5 2
No response 35 15
231
Among the respondents who answered this question, 184 (74%) drove to the university, 19 (8%) biked, and 11 (5%) walked. Only eight (3%) used the bus and two were in the “Other” category, one of them using a motorcycle (see Table 4). On average, these respondents took 24.16 minutes to get to the campus, regardless of the modes they took. The standard deviation of the travel time was found to be 14.48 minutes.
Table 4. Respondents’ Distribution by Current Mode of Transportation
Mode Count % Car 184 76 Bus 8 3 Bike 19 8 Walking 11 5 Other 2 1 No response 7 3 231
Among 241 respondents, 231 respondents lived off campus and 10 lived on campus. Among the respondents who lived off campus, 105 were full-time students. The presence of a high percentage of student respondents who live off campus and whose current mode of transportation to UNLV is by car implies that UNLV is a commuter school.
Figure 5 shows the distribution of respondents according to the zip codes of their residences. It can be observed that their locations covered almost every part of the Las Vegas metropolitan area. However, most respondents (74) came from the zip codes that
Figure 5. Distribution of the Respondents by Zip Code
Whether users have an office on campus is important in understanding the possible origins and destinations of the users of a bikesharing program. The survey revealed that among the 241 respondents, 154 (64%) had offices on campus and 70 (30%) did not. Among those 154 respondents who had an office on campus, 37 (24%) were faculty, 69 (45%) were staff, 40 (26%) were full-time students, and 1% were part-time students.
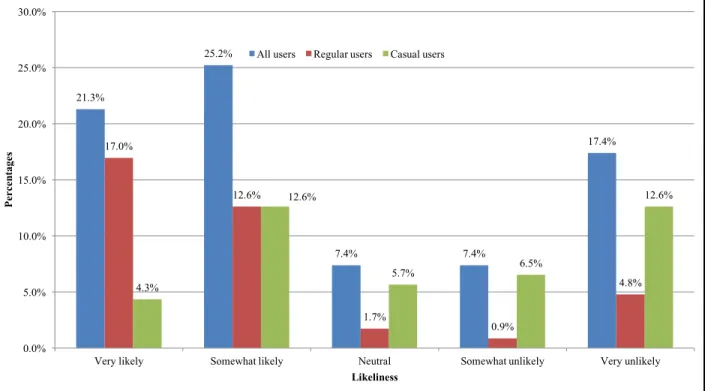
Whether it was likely that the respondents would use the bikesharing program was the most important part of the questionnaire. The responses indicated that of the 231 respondents, 50 chose “Very Likely” and 66 chose “Somewhat Likely” to use a bikesharing program for commuting. The total of these two groups of respondents are about 50% of all those who participated in the survey; this percentage is much higher than those choosing “Somewhat Unlikely” and “Very Unlikely” (10% + 27% = 37%). The same trend was observed for on-campus activities. About 66% of the respondents either were very likely or somewhat likely to use the bikesharing system for their day-to-day movements within the campus (Table 5).
Table 5. Likeliness to Use a Bikesharing Program
Commuting On Campus Activities
Likelihood Count % Count %
Very likely 50 22 88 37 Somewhat likely 66 29 69 29 Neutral 21 9 22 9 Somewhat unlikely 23 10 14 6 Very unlikely 62 27 25 10 No Answer 9 4 13 5 231 231
The on-campus trips could occur in varying frequencies. Table 6 indicates that about 30% of the respondents would make such an on-campus trip once a day, making the bikesharing program significant at UNLV.
Table 6. Frequency of Use of the Bikesharing Program
Count %
Once a month 29 13
Once a week 67 29
Once a day 61 26
More than once a day 25 11
No response 49 21
231
The respondents indicated that on-campus trips would be for various purposes, the most popular being attending meetings and going to classes. Going to the library also was noticeably popular. The other trip purposes, as shown in Table 7, include going to work out, going to have lunch, trips for work, and other miscellaneous activities. These trips are popular off campus as well and would benefit from the bikesharing program.