University of Connecticut
OpenCommons@UConn
Doctoral Dissertations University of Connecticut Graduate School7-8-2016
Semi-automated Ultrasensitive Electrochemical
Microfluidic Immunoarray for On-line Capture
and Detection of Cancer Protein Biomarkers
Brunah Akinyi OtienoUniversity of Connecticut - Storrs, [email protected]
Follow this and additional works at:https://opencommons.uconn.edu/dissertations Recommended Citation
Otieno, Brunah Akinyi, "Semi-automated Ultrasensitive Electrochemical Microfluidic Immunoarray for On-line Capture and Detection of Cancer Protein Biomarkers" (2016).Doctoral Dissertations. 1197.
i
Semi-automated Ultrasensitive Electrochemical Microfluidic
Immunoarray for On-line Capture and Detection of Cancer
Protein Biomarkers
Brunah Akinyi Otieno, Ph.D.
University of Connecticut, 2016
Early cancer diagnoses promise to improve treatment outcomes and patient survival rates. However, current cancer diagnostics often rely on finding a tumor, making early detection difficult and possibly compromising therapy outcomes. Screening for cancer without tumor detection can be based on assays of body fluids such as serum or plasma for cancer biomarker proteins to provide an instantaneous record of a patient’s disease status. Measurement of these biomarker proteins should be accurate, sensitive, cheap and preferably at point-of-care (POC) for translation to the clinic. In addition, due to low predictive power of some biomarker proteins and their over-expression by multiple cancer types, it is essential to measure panels of biomarker proteins as opposed to a single biomarker for reliable diagnosis of cancer. Simultaneous measurement of the levels of a panel of biomarker proteins can lead to more accurate diagnoses and offer clarity about disease characteristics and progression that may help guide treatment strategies.
The long-term goal of this thesis research is to provide multiple biomarker-based diagnostics to enable accurate early detection of cancer and therapy
ii monitoring. A simple, low-cost, 8-electrode semi-automated modular microfluidic system for on-line capture and electrochemical detection of panels of cancer protein biomarkers was designed and validated. Proteins that were validated include oral cancer biomarkers (IL-6 & IL-8) and oral mucositis biomarkers (IL-6, TNF-α, IL-1β and CRP). This thesis also describes our first electrochemical assay for parathyroid hormone related peptide (PTHrP); a paraneoplastic peptide responsible for hypercalcemia in cancer patients and also implicated in cancer metastasis. Also described in the dissertation, is a novel 16-electrode electrochemical set up for simultaneous detection of upto 8-prostate cancer biomarkers, many of which are thought to be specific for aggressive prostate cancer. Measurement of these small panels of selective biomarkers holds remarkable promise for future cancer diagnostics and personalized cancer therapies and most importantly in identifying aggressive vs indolent forms of prostate cancer.
iii
Semi-automated Ultrasensitive Electrochemical Microfluidic
Immunoarray for On-line Capture and Detection of Cancer
Protein Biomarkers
Brunah Akinyi Otieno
B.S. Industrial Chemistry, University of Nairobi, 2009
A Dissertation Submitted in Partial Fulfilment of the Requirements for the Degree of Doctoral of Philosophy at the University of Connecticut
iv
Copyright by
Brunah Akinyi Otieno
v
Approval Page
Doctor of Philosophy Dissertation
Semi-automated Ultrasensitive Electrochemical Microfluidic
Immunoarray for On-line Capture and Detection of Cancer
Protein Biomarkers
Presented by
Brunah Akinyi Otieno, BSc
Major Advisor………..
Dr. James F. Rusling
Associate Advisor………..
Dr. Douglas Adamson
Associate Advisor………..
Dr. Alfredo-Angeles M. Boza
University of Connecticut 2016vi
Dedicated to
My Parents
Consolata and Paul Otieno &
My Husband Stephen M. Opimbi
vii
Acknowledgement
Though only my name appears on the cover of this dissertation, many people have contributed and extended their valuable assistance to its production. I owe my gratitude to all those people who have made this dissertation possible and because of whom my graduate experience has been one that I will cherish forever.
My deepest gratitude is to my advisor, Dr. James F. Rusling for his patience, motivation, enthusiasm, and immense knowledge. His guidance helped me in all the time of research and writing of this thesis. I could not have imagined having a better advisor and mentor for my PhD program. Jim taught me how to question thoughts and express ideas. I am grateful to him for holding me to a high research standard and enforcing strict validations for each research result, and thus teaching me how to do research. His patience and support helped me overcome many crisis situations and finish this dissertation. His insightful comments and constructive criticisms at different stages of my research were thought-provoking and they helped me focus my ideas. I am also thankful to him for reading my reports, commenting on my views and helping me understand and enrich my ideas. I am deeply grateful to him for the long discussions that helped me sort out the technical details of my work. I hope that one day I would become a good mentor as Jim has been to me. Besides my advisor, I would like to thank the rest of my thesis committee: Prof. Douglas Adamson, Dr. Alfredo M. Boza,
viii and Dr. Edward Neth, for their encouragement, insightful comments, and hard questions.
My sincere thanks also goes to Prof. Donal Leech for facilitating my stay in National University of Ireland, Galway (NUIG) for the US-Ireland collaborative project. Thanks for offering me a conducive environment to perform research for 3 months. I also thank his students Conan, Dr. Peter, Cindy and Richard for the warm welcome to NUIG and being supportive throughout my stay in Ireland. I would also like to thank our visiting researchers Dr. Ronaldo Faria and Dr. Alina Latus for their guidance and support in completing the project in chapter two of this thesis.
I would like to thank Dr. Dan Eustace for his professional development class that enlightened me on career development and enabled me secure a position at my dream company. Many thanks to Charlene Fuller and Daniel Delab for their assistance with placing orders and designing microfluidic devices respectively.
I thank former and present labmates in JFR Lab: Dr. Colleen Krause, Dr Dhanuka, Abby, Amit, Mohammed, Min, Itti, Gayatri, Jen, Karteek, Spundana, Boya, Di, Snehasis, Islam, Dr. Bishop, Dr. Kiran and Dr. Chandra for the stimulating discussions, and for all the fun we have had in the last five years. In particular, I am grateful to Dr. Colleen Krause for enlightening me the first glance of research, for the sleepless nights we were working together before deadlines, and for being my best friend to date.
ix Last but not the least, I would like to thank my family: my parents Consolata and Paul Otieno, for giving birth to me at the first place and supporting me spiritually throughout my life. My siblings Milly, Zephan, Juve and Antonia, thank you for your unending support and prayers. I also would like to thank my husband, Stephen Opimbi for his immense love and support throughout my PhD program. Glory be to the Almighty God.
x
Table of Contents
Approval page………v Dedication……….vi Acknowledgement………...vii Table of Contents………..x List of Schemes………...xv List of Figures……….xvi List of Tables……….xxiv Chapter 1: Introduction……….11.1 Goal and Significance………1
1.2 Cancer Biomarkers………5
1.2.1 Cancer Protein Biomarkers……….6
1.3 Platforms for Cancer Biomarker Detection………..10
1.3.1. Enzyme-Linked Immunosorbent Assay (ELISA)………...10
1.3.2 LC-MS-based Proteomics & Commercial Assays……….11
1.3.3 Electrochemical Methods………..13
1.4 Microfluidics for Biomarker Detection………..18
1.5 On-line Protein Analyte Capture………..21
xi
1.7 References………..27
Chapter 2: On-line Protein Capture on Magnetic Beads for Ultrasensitive Microfluidic Immunoassays of Cancer Biomarkers………35
2.1 Abstract………35
2.2 Introduction………...36
2.3 Experimental Section……….39
2.3.1 Chemicals and Materials………...39
2.3.2 Antibodies and Proteins……….40
2.3.3 Human Serum Samples and Conditioned Media………..40
2.3.4 Instrumentation………...40
2.3.5 Preparation of Ab2 -magnetic particle -HRP (Ab2-MP-HRP)………43
2.3.6 Array Preparation and Characterization……….43
2.3.7 On-line protein analyte capture and detection………...44
2.4 Results……….46
2.4.1. Array Characterization………...46
2.4.2. Immunoarray Calibration………...47
2.4.3. Determination of the cross-reactivity of the analytes………51
2.4.4. Detection of IL-6 and IL-8 in mixtures……….53
2.4.5. Oral Mucositis Biomarkers………55
2.4.6. Assay Validation……….57
2.4.6.1. Assay Validation with Conditioned Media from Oral Cancer Cells………...57
xii 2.4.6.2. Assay validation with Human Serum Samples from H&N
Cancer Patients………..59
2.5 Discussion………61
2.6 Summary………..64
2.7 References………..65
Chapter 3: Ultrasensitive Multiplexed Detection of Parathyroid Hormone-related Peptides (PTHrP) Using Gold Nanoparticle Immunoarrays…………73
3.3 Abstract………73
3.2 Introduction………..74
3.3 Experimental Section……….77
3.3.1 Chemicals and Materials………...77
3.3.2 PTHrP peptides and Antibodies………...78
3.3.3 Immunoradiometric assay (IRMA) for PTHrP………78
3.3.4 Human Serum Samples………79
3.3.5 Array Fabrication………79
3.3.6 Derivatization of Magnetic Beads………81
3.3.7 Detection of PTHrP isoforms and fragments……….82
3.4 Results………84
3.4.1 Single Peptide Detection………...84
3.4.2 Multiplexed Peptide Detection………..88
3.4.3 Validation using Cancer Serum Samples………...90
xiii
3.5 Discussion………94
3.6 References………..97
Chapter 4: Ultrasensitive Electrochemical Microfluidic Immunoarray for Assessment of Aggressive vs Indolent forms of Prostate Cancer………..104
4.1 Abstract………..104
4.2 Introduction………105
4.3 Experimental Section………...109
4.3.1 Antibodies and Proteins…...109
4.3.2 Human Serum Samples………..110
4.3.3 Chemicals and Materials……….110
4.3.4 Preparation of Magnetic-bead Conjugates (Ab2-MP-HRP)………111
4.3.5 Array Fabrication………..111
4.3.6 Single Detection of Protein Biomarkers………112
4.3.7 Multiplexed Detection of Protein Biomarkers………...113
4.4 Results………...116
4.4.1 Optimization of the Biomarker Panel……….116
4.4.2 8-Electrode System: Single Biomarker Detection………...118
4.4.3 16-Electrode System………120
4.4.3.1 Single Biomarker Detection………120
4.4.3.2 Multiplex Biomarker Detection………...123
4.5 Discussion……….126
xiv Chapter 5: Bioconjugation of Antibodies and Enzyme Labels onto Magnetic
Beads ………132
5.1 Abstract………..132
5.2 Introduction………133
5.3 Bioconjugation of Magnetic beads……….136
5.4 Preparation of dual-labeled magnetic beads………...138
5.4.1 Tosyl-activated Magnetic Beads………138
5.4.2 Streptavidin-coated Magnetic Beads………141
5.5 Characterization of magnetic bead bioconjugates………..143
5.5.1 2,2′-Azino-bis(3-ethylbenzothiazoline-6-sulfonic acid) (ABTS) Enzymatic Assay………..144
5.5.2 Bicinchoninic acid (BCA) Protein Assay………...146
5.6 Integration of magnetic beads into Immunoassay………..149
xv
List of Schemes
Scheme 1.1: ELISA Scheme; Antigen is added to ELISA plate coated with primary antibody, followed by addition of secondary antibody conjugate by enzyme label. Generation of signal is by addition of a substrate that forms a colored product that can be measured by an optical plate reader……….11 Scheme 1.2: Generation of signal from HRP. H2O2 activates HRP to ferryloxyHRP (1) form which further oxidizes hydroquinone to benzoquinone (2). Signal is generated via a two electron transfer reaction regenerating hydroquinone (3)……….16
xvi
List of figures
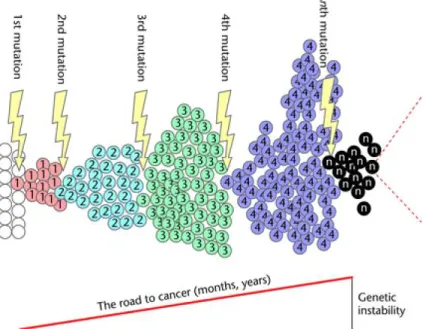
Figure 1.1: Clonal expansion of mutation leading to formation of tumours
(Adapted from reference 3)……….2
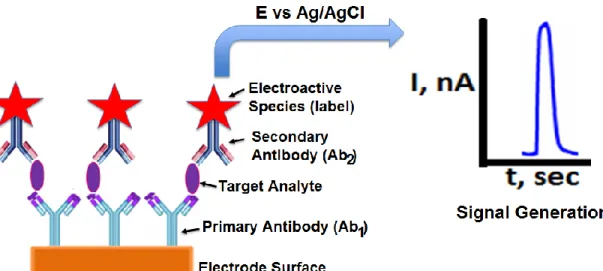
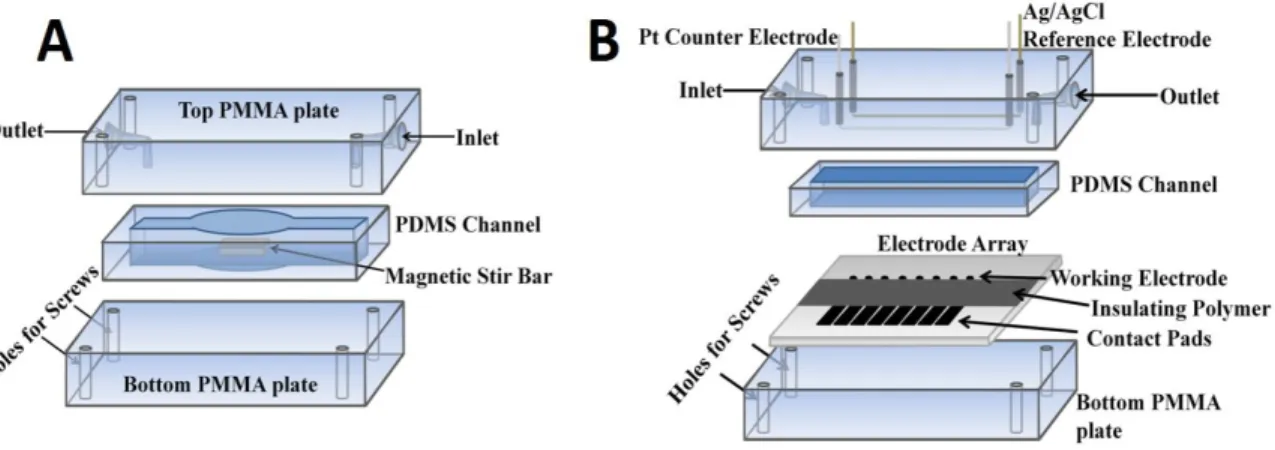
Figure 1.2: Illustration of electrochemical method for protein biomarker detection. Signal generated is proportional to the concentration of the target analyte. Labels commonly employed include horseradish peroxidase (HRP) and alkaline phosphatase………14 Figure 1.3: AuNPs Immunosensor for amperometric detection of cancer protein biomarkers using magnetic bead conjugates labeled with thousands of Ab2 and HRPs………17 Figure 1.4: (A) Electrochemical microfluidic set up for off-line detection of cancer protein biomarkers. (B) Detection chamber housing the Ab1-modified 8-electrode array………..20 Figure 1.5: (A) Conceptual instrumentation and strategy for ultrasensitive amperometric detection by microfluidic immunoarray and (B) photograph of capture chamber in which target proteins will be captured on-line from the sample by heavily labeled HRP-antibody-magnetic beads to form protein-bead bioconjugates………..23 Figure 2.1: Components of (A) capture chamber in which target proteins are captured on-line from the sample and (B) detection chamber that houses the 8-electrode array………41
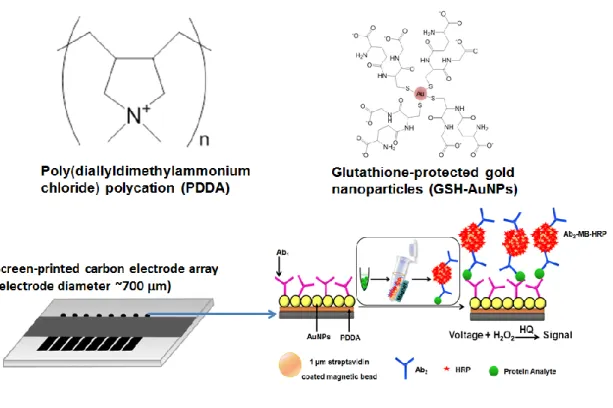
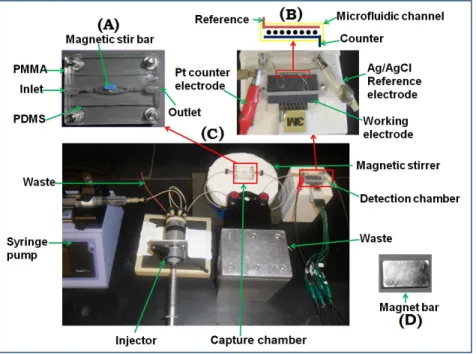
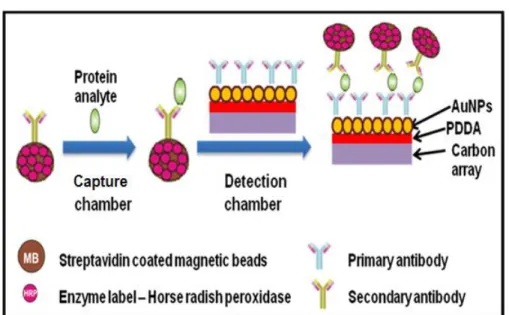
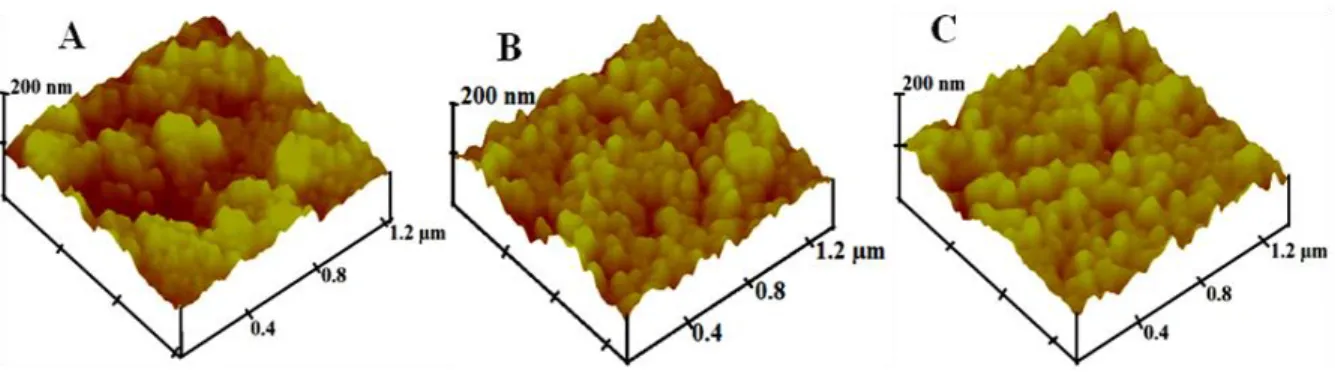
xvii Figure 2.2: Photographs of microfluidic system for on-line protein capture and detection using magnetic beads. (A) Capture chamber in which target proteins are captured on-line from the sample by heavily labeled HRP-antibody-magnetic beads to form protein-bead bioconjugates. These are washed, and then flowed into the detection chamber (B) in the modular microfluidic system (C). The magnet (D) traps bioconjugate beads in the channel during injection of sample and washing, and is removed for transfer of beads to the detection chamber….42 Figure 2.3: Conceptual strategy for ultrasensitive amperometric detection by microfluidic immunoarray. Protein analytes are captured on-line on Ab2-MP-HRP bioconjugates in capture chamber. The protein-Ab2-MP-HRP is then magnetically separated and washed in the chamber before being transported into the detection chamber………..45 Figure 2.4: High resolution tapping mode AFM images of one of the array sensor electrodes of (A) bare screen printed carbon, (B) Carbon/PDDA/GSH-AuNPs and (C) Carbon/PDDA/GSH-AuNPs/Ab1………47 Figure 2.5: Amperometric responses for individual standard solutions of IL-6 and IL-8 in undiluted calf serum at -0.2 V vs. Ag/AgCl developed by injecting a mixture of 1 mM HQ and 0.1 mM H2O2 for (A) IL-6 and (C) IL-8, also showing calibration plots for (B) IL-6 and (D) IL-8 standards. Error bars represent standard deviations (n=8) for the eight electrodes of a single immunoarray……….50 Figure 2.6: Amperometric signals for (A) on-line vs off-line capture protocol for control, (B) individual standard solutions of IL-6 and (C) IL-8 in undiluted calf
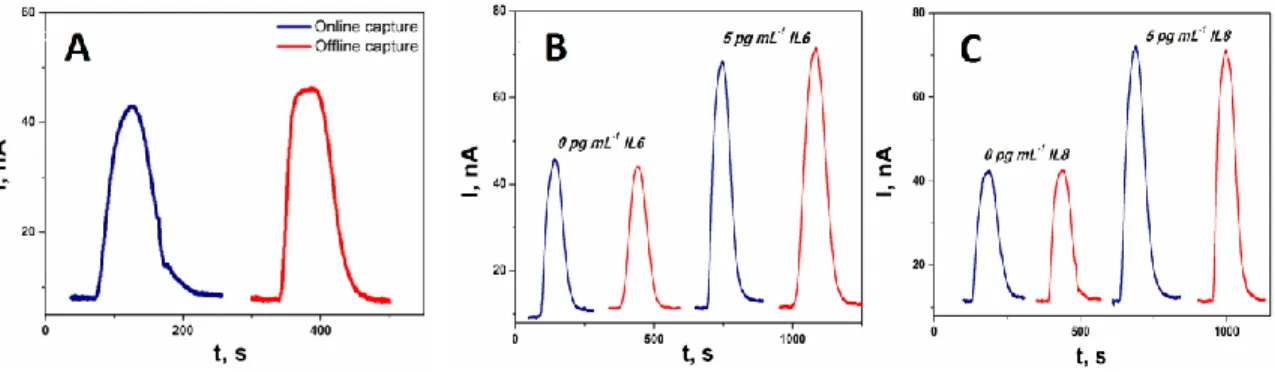
xviii serum at -0.2 V vs Ag/AgCl developed by injecting a mixture of 1 mM HQ and 0.1 mM H2O2 on different days with different arrays………51 Figure 2.7: Cross reactivity of the analyte with non specific antibodies. The array was coated with BSA, IL-8 and IL-6 primary antibodies. (A) 5pg mL-1 IL-6 and (B) 5 pg mL-1 IL-8 was injected and captured by the conjugate before being flown into the detection chamber. (C) Determination of specificity of the protein analyte on a single array. The first four electrodes show the amperometric response for IL-6 while the last four electrodes show the amperometric response for IL-8…..53 Figure 2.8: Amperometric responses for standard protein mixtures in undiluted calf serum at -0.2 V vs Ag/AgCl developed by injecting a mixture of 1 mM HQ and 0.1 mM H2O2 for (A) IL-6 and (C) IL-8, also showing calibration plots for (B) IL-6 and (D) IL-8. Error bars represent standard deviations (n=4) for the four IL-6 or IL-8 antibody-modified electrodes on a single immunoarray………..54 Figure 2.9: Duplicate responses measured simultaneously for (A) control mixture of 0 fg mL-1 for IL-6, TNF-α, CRP and IL-1β, and (B) standard mixture of 18 fg mL-1 IL-6, 12 fg mL-1 TNF-α, 15 fg mL-1 CRP, and 22 fg mL-1 IL-1β, illustrating reproducibility and selectivity………56 Figure 2.9.1: Amperometric responses for standard protein mixtures in 5-fold diluted calf serum for (A) IL-6, (C) TNF-α, (E) CRP, and (E) IL-1β, developed by injecting a mixture of 1 mM HQ and 0.1 mM H2O2 at -0.2 V vs. Ag/AgCl and the corresponding calibration plots for (B) IL-6, (D) TNF-α, (F) CRP, and (H) IL-β…57
xix Figure 2.9.2: Correlation plots of immunoarray assay results for conditioned media of HaCat, HN12, HN13 and Cal27 cell lines vs. standard ELISA assays for (A) IL-6 and (B) IL-8. Error bars represent standard deviations for the immunoarray for n=4, and where not apparent are smaller than the point size...58 Figure 2.9.3: (A) Immunoarray and ELISA assay results from serum samples of Head and neck cancer patients for IL-6, TNF-α, CRP, and IL-1β. S1-S4 corresponds to patient samples spiked with 50, 100, 200, and 500 pg/mL respectively. (*) corresponds to values below the detection limits of ELISA and (#) corresponds to values above the dynamic range of the microfluidic immunoarray. (B) Linear correlation plots of immunoarray results against those from individual ELISAs for human serum samples from cancer patients for IL-6, TNF-α, CRP, and IL-1β. ELISA assays for CRP represent a single trial………...61 Figure 3.1: A photograph of Dimatix Inkjet Materials Printer from Fujifilm and printed gold nanoparticles (AuNPs) arrays on surface of Kapton Sheet………...80 Figure 3.2: Immunoarray set-up for on-line peptide capture: (A) microfluidic device and (B) detection pathway………83 Figure 3.3: Optimization of Ab1 and Ab2 concentration using a control and standard concentrations of 2.5, 5 pg mL-1 for (A) PA104, (B) PA6, (C) PA158, (D) IgY3103, (E) IgY3104, and (F) MA45. Optimal concentrations for both Ab1 and Ab2 are circled……….86 Figure 3.4: Responses for (A) 1-33 obtained at -0.3 V vs Ag/AgCl. Calibration plots for PTHrP peptide fragments in 5x diluted calf serum: (B) 1-33, (C) 1-86, (D)
xx 151-169, (E) 140-173 and (F) intact PTHrP 1-173 (n=8)……….88 Figure 3.5: A) Multiplexing strategy for the peptide fragments on a single 8- electrode inkjet-printed AuNPs array. B) Representative amperometric response for detection of a mixture of 1-173 and 1-86 on a single 8-electrode array……..89 Figure 3.6: Amperometric responses for standard peptide mixtures in 5x diluted calf serum at -0.3 V vs Ag/AgCl for (A) intact PTHrP 1-173 using PA104, (C) 1-86 peptide fragment (E) intact PTHrP 1-173 using PA6 and also showing calibration plots for intact PTHrP 1-173 (B & F) and 1-86 fragment (D) (n=3)……….90 Figure 3.7: Distributions of PTHrP levels in serum and plasma from cancer patients (37) and cancer-free individuals (22) for (A) 1-86; (B) PTHrP 1-173; (C) bar graph comparing IRMA and immunoarray (1-86 & 1-173) results for PTHrP (n=12) and (D) correlation plot of IRMA and immunoarray data (1-86 & 1-173) (n=57). Asterisk (*) denotes value below IRMA LOD………92
Figure 3.8: Receiver operating characteristic (ROC) curves for (A) serum assays for 1-173 (red) with AUC 0.94, 95.5% specificity and 82.9% sensitivity & 1-86 (blue) with AUC 0.96, 100% specificity and 80% sensitivity; and (B) normalized value for both 1-86 and 1-173 with AUC 0.96, 100% specificity and 80% sensitivity……….94 Figure 4.1: (A) Illustration of the microfluidic set up for on-line capture and detection of cancer protein biomarkers. (B) Protein analytes are captured onto the Ab2-MP-HRP in the capture chamber to form protein-bead bioconjugates. (C)
xxi Amperometric signal generation by injecting a mixture of 1 mM HQ, electron mediator, and 0.1 mM H2O2 into the detection chamber………113 Figure 4.2: (A) Photograph of the automated 16-electrode microfluidic system featuring (B) a two-channel capture chamber with ports to hold the magnet bar and (C) a two-channel detection chamber housing two 8-electrode arrays……114 Figure 4.3: Multiplexing strategy for the 8-panel protein on the 16-electrode system. High and low concentration proteins in serum are assayed on separate channels of the system………115 Figure 4.4 A-H: Optimization of Ab1 and Ab2 concentration using a control and standard concentrations of 2.5, 5 or 10 pg mL-1 for (A) CD-14 Ab2, (B) CD-14 Ab1, (C) IGFBP-3 Ab2, (D) IGFBP-3 Ab1, (E) ERG Ab2, (F) ERG Ab1, (G) GOLM Ab2, and (H) GOLM Ab1. Optimal concentrations for both Ab1 and Ab2 are circled……….117 Figure 4.4 I-P: Optimization of Ab1 and Ab2 concentration using a control and standard concentrations for (I) IGF-1 Ab2, (M) IGF-1 Ab1, (J) PEDF Ab2, (N) PEDF Ab1, (K) VEGF-D Ab2, (O) VEGF-D Ab1, (L) PSA Ab2, and (P) PSA Ab1. Optimal concentrations for both Ab1 and Ab2 are circled………...118 Figure 4.5 A-H: Calibration plots for individual protein in 5x diluted calf serum at - 0.2 V vs Ag/AgCl for (A) CD-14, (B) IGFBP-3, (C) ERG, (D) GOLM; and also showing amperometric responses for (E) CD-14, (F) IGFBP-3, (G) ERG, (H) GOLM……….119
xxii Figure 4.5 I-N: Calibration plots for individual protein in 5x diluted calf serum at - 0.2 V vs Ag/AgCl for (I) PEDF, (J) VEGF-D, (K) IGF-1, and also showing amperometric responses for (L) PEDF, (M) VEGF-D, (N) IGF-1……….120 Figure 4.6 A-H: Amperometric responses for individual protein in 5x diluted calf serum at -0.2 V vs Ag/AgCl for (A) PSA, (B) GOLM, (C) VEGF-D, (D) IGF-1; and also showing calibration plots for (E) PSA, (F) GOLM, (G) VEGF-D, (H) IGF-1………..122 Figure 4.6 I-P: Amperometric responses for individual protein in 5x diluted calf serum at -0.2 V vs Ag/AgCl for (I) IGFBP-3, (J) PEDF, (K) ERG, (L) CD-14; and also showing calibration plots for (M) IGFBP-3, (N) PEDF, (O) ERG, (P) CD-14………123 Figure 4.7: Calibration plots for a mixture of protein analytes in 5x diluted calf serum at -0.2 V vs Ag/AgCl for (A) IGFBP-3, (B) ERG, (C) GOLM, (D) PSA, (E) CD-14, (F) IGF-1, (G) PEDF and (H) VEGF-D………125 Figure 5.1: Variety of commercially available functionalized MBs with coatings of either organic functional group to attach biomolecules or biomolecules that can bind specific moieties………..137 Figure 5.2: (A) The covalent attachment of antibodies to the tosyl functionalized magnetic particles. The tosyl groups act as leaving groups for surface amine groups present on antibodies to attach. (B) The complete conjugation protocol for both the attachment of antibodies as well as HRP enzyme labels………..139
xxiii Figure 5.3: The non-covalent attachment of antibodies and biotin-Horseradish Peroxidase labels to the surface of streptavidin-coated MBs…….142 Figure 5.4: Formation of the 2,2’-azino-bis(3-ethylbenzthiasoline-6-sulfonic acid (ABTS) radical catalyzed by horseradish peroxidase in the presence of hydrogen peroxide……….144 Figure 5.5: The formation of the Bicinchoninic acid (BCA)-copper complex for the BCA total protein assay. This assay proceeds in two steps; the first being the reduction of Cu2+ by antibodies in a basic environment and the second step involves the reduced Cu+ chelating with two molecules of bicinchoninic acid…147 Figure 5.6: The workflow for the Bicinchoninic acid (BCA) total protein assay including the formation of the working reagent, and the development of a standard curve from a range of antibody concentrations………..148 Figure 5.7: Calculating the total antibody concentration from subtracting the absorbance of the magnetic beads from that of the magnetic beads containing the antibody………...149
xxiv
List of Tables
Table 1.1: List of FDA approved protein markers currently used in clinical practice………...7
Table 3.1: Characterization of Magnetic Bead Conjugate………..82 Table 3.2: Antibody and Peptide Pairing for Sandwich Assay………85 Table 3.3: Serum Samples Data……….91 Table 3.4: Correlation plot table………..92 Table 4.1: Detection limits and sensitivities of the 8-protein panel on the 16- electrode system………..125 Table 5.1: Reagents/Sample Volume for ABTS Assay……….145
1
CHAPTER ONE
Introduction
1.1 Goal and Significance
Despite tremendous efforts to develop strategies against cancer-related mortality, cancer still remains a major public health problem in the United States and throughout the world. It is the second leading cause of death in the United States after heart disease.1 Cancer arises in 1 out of 3 individuals and affect people of all ages and certain types of cancer arises more according to the gender, age or geo-graphical location globally.2 According to the National Cancer Institute one out of every four deaths occurring daily in the US is due to cancer. In 2016 alone, 1,685,210 new cancer cases are projected to occur in the US which translates to 4,600 new cancer diagnoses each day.1 The lifetime probability of being diagnosed with an invasive cancer is 42% in men and 38% in women. It is also estimated that 595,690 Americans are expected to die in 2016, corresponding to about 1,600 deaths per day.1 These deaths arise mostly from cancers of the lung and bronchus, prostate, breast and colorectal cancer which accounts for 46% of all cancer deaths.1
Cancer is a multi-gene, multi-step disease originating from a single abnormal cell of clonal origin with an altered DNA sequence (mutation).3 Uncontrolled proliferation of these abnormal cells leads to successive rounds of mutation and natural selection resulting in formation of tumors (Figure 1.1).
2 Subsequent mutation leads to malignant tumor which breaks through the basal membrane and spread to distant locations.3-5
Figure 1.1: Clonal expansion of mutation leading to formation of tumors (Adapted from reference 3).
Initiation and progression of cancer depends on both external factors/ environmental factors (diet, lifestyle and exposure to ultraviolet radiation or carcinogenic pollutants) and internal factors within the cells (inherited mutations, hormones, immune conditions, and mutations that occur from metabolism).1,3 These factors act together or in sequence, resulting in abnormal cell behavior and excessive proliferation. As the causes of cancer are so diverse, there are many types of cancer. There are more than 200 types and sub-types of cancer affecting more than 60 human organs.4 The dysregulation in normal signaling pathway in cancer patients leads to inactivation of tumor suppressor genes and
3 activation of oncogenes.6 However, in terms of diagnosis, no single gene is universally altered during this process, and the patterns of change differ in tumors from different organs, as well within tumors from the same location. In addition, approximately 90% of all cancer-related deaths occur from metastasis and not directly from the primary tumor site.7 Therefore, there is urgent need to develop tools for early diagnosis of cancer to improve treatment outcomes and patients’ survival rate.
Existing methods of screening for cancer often rely heavily on finding and imaging a tumor. Imaging modalities such as magnetic resonance imaging (MRI), positron emission tomography (PET), and computed tomography (CT), use contrast materials to distinguish between different anatomical features of tumor.2, 8-10 These techniques determine the precise location of tumor thereby aiding in directing treatment options, monitoring cancer therapy and recurrence of the disease. Unfortunately, some tumors fail to show a marked difference from surrounding healthy tissue due to uptake of the contrast agent. In addition, some
of the techniques lack the sensitivity to detect small (<1 cm) and low grade
tumors leading to false negative results. Furthermore, most of these techniques
are also expensive and hence might not be available or affordable in low
resource settings.11-13 Other techniques employed for screening of cancer rely on
traditional methods based on cell morphology using staining and microscopy.6
These are invasive techniques based on taking a biopsy and then examining the tissue using cell fixation and morphology approaches to identify and detect
4 cancer cells. These tests, however, are not individually conclusive as tissue removal can miss cancer cells at the earlier onset of the disease and further research is needed to develop tests to identify the malignancy without the need for invasive examinations.6
The goal of this dissertation was to develop and validate a simple,
low-cost technique that allows patients to be screened for cancer without undergoing
any invasive procedure. The methodology is based on assaying bodily fluids such asserum or plasma to measure the levels of biomolecules that are over- or under-expressedduring early cancer stages.14,15 These biomolecules also known as cancer biomarkers can deliver a “snapshot” of disease status in patients. The technique addressed in this thesis for detection of these cancer biomarkers, employs different aspects of automation, microfluidics, nanotechnology and novel labeling methods in conjunction with electrochemical detection. First, the semi-automatedmicrofluidic device was first optimized and validated with experimental samples consisting of conditioned media from human oral cancer cells, followed by real-time monitoring of small biomarker proteins panel for oral cancer and prostate cancer in human serum and plasma. The clinical data obtained from the semi-automated device along with the low cost of the assay holds excellent promise for cancer diagnosis and therapy monitoring.
5 1.2 Cancer Biomarkers
According to National Health Institute (NIH), a biomarker is defined as “a characteristic that is objectively measured and evaluated as an indicator of normal biologic processes, pathogenic processes, or pharmacologic responses to a therapeutic intervention.”16 According to the definition, a cancer biomarker is a biological molecule found in blood, other body fluids or tissues that is indicative of the presence of cancer in body. It might be a molecule secreted by a malignancy itself, or it can be a specific response of the body to presence of cancer. Cancer biomarkers typically differentiate an affected patient from a person without a disease. The alterations could be due to a number of factors, including germline or somatic mutations, transcriptional changes and post translational modifications.
There is tremendous variety of biomarkers, including DNA, DNA modifications, RNA, proteins, hormones and related molecules, molecules of the immune system, oncogenes and other modified molecules.6,17 Cancer biomarkers can also be a collection of alterations, such as gene expression, proteomic and metabolomics signatures. Biomarkers can be detected in circulation (whole blood, serum or plasma), or excretions or secretions (stool, urine, sputum or nipple, discharge) and thus easily assessed non-invasively, or can be tissue driven and require either biopsy or special imaging for evaluation. Genetic biomarkers can be inherited and detected as sequence variations in
6 germ line DNA isolated from whole blood, sputum, or buccal cells or can be somatic and identified as mutations in DNA derived from tumor tissue.18
Cancer biomarkers have many potential applications in oncology, including risk assessment, screening, differential diagnosis, determination of prognosis, prediction of response to treatment, and monitoring status of the disease, either to detect recurrence or determine response or progression to therapy. In addition, biomarkers can be used in combination with imaging
techniques to detect cancer in vivo and assess response to therapy.17 Because
of the criticalrole that biomarkers play at all stages of disease, it is important that they undergo rigorous evaluation, including analytical validation, clinical validation, and assessment of clinical utility, prior to incorporation into routine clinical care.18
1.2.1 Cancer Protein Biomarkers
One most important class of cancer biomarkers include proteins that are elevated or depressed in serum or plasma patients and their levels indicate the presence of cancer in the body.19 These proteins are often specific to one or several types of cancer and the levels of such proteins can give clear indication of the patient’s status.20 Cancer biomarker proteins have been identified for almost every major type of cancer, however only a few of the biomarkers have been approved by FDA (Table 1.1).
7 Table 1.1: List of FDA approved protein markers currently used in clinical practice
Protein Biomarkers
Clinical use Cancer Specimen Year
Approved Cancer antigen-125 (CA-antigen-125) + Human epididymis protein 4 (HE4) Prediction of malignancy, monitoring disease progression, response to therapy Ovarian cancer Serum, Plasma 2011
HE4 Monitoring recurrence or
progression of disease Ovarian Serum 2008 Alpha-Fetoprotein (AFP) Staging of non-seminomatous testicular cancer
Risk assessment for development of disease Hepatocellular Testicular Serum, plasma, amniotic fluid 2005
CA19-9 Monitoring disease status Pancreatic Serum,
Plasma
2002
CA15-3 Monitoring of disease
response to
therapy/assessment of therapy
Breast cancer Serum,
Plasma
1997
CA27.29 Monitoring disease
response to therapy
Breast cancer Serum 1997
Free PSA Discriminating cancer from
benign disease Prostate cancer Serum 1997 Thyroglobulin (Tg)
Aid in monitoring Thyroid Serum, 1997
Total PSA Screening & monitoring
disease
Prostate Serum 1986
Carcinogenic embryonic antigen (CEA)
Aid in management and prognosis Pancreatic cancer Serum, Plasma 1985
Many of these proteins are secreted into the blood at higher than normal levels when cancers begin to develop and are useful for diagnosis even before
the onset of tumours.14 For example prostate specific antigen (PSA) is a serum
protein biomarker recommended by the American cancer society as an early screening tool for prostate cancer. PSA is produced by the cells of the prostate
8 gland and is typically elevated in the presence of prostate cancer. A PSA serum concentration of 4−10 ng mL−1 suggests the possibility of early stage prostate cancer, while normal levels are typically 0.5−2 ng mL−1 and late stage prostate cancer is characterized by values above 100 ng mL-1.14,19 Interleukin-6 (IL-6) on the other hand is a multifunctional cytokine associated with several different cancers, including head and neck squamous cell carcinoma (HNSCC). Mean serum IL-6 levels in healthy individuals are typically less than 6 pg mL−1, whereas in patients with HNSCC, the levels are 20 pg mL−1 or greater. Serum IL-6 is also elevated in colorectal, gastrointestinal, and prostate cancers.21 Protein
biomarkers are also used to monitor response to therapy and recurrence of disease in ovarian, pancreatic and colon cancer, through measuring the proteins cancer antigen (CA125), CA19-9 and carcinoembryonic antigen (CEA), respectively.17
However, single biomarker proteins typically have insufficient positive predictive value e.g about 70% for PSA which is one of the better single biomarkers.22 PSA has low specificity to prostate cancer as the levels can also be elevated above the threshold in benign prostate hyperplasia (BPH), a condition in which the prostate enlarges, prostatitis (prostate inflammation) and urinary infection. In addition, PSA fails to discriminate between aggressive tumors from low-risk ones and between malignant disease and other benign prostate conditions, and as such, over-diagnosis and over-treatment represent critical consequences of PSA-based screening. Failure to distinguish between
9 indolent and more aggressive forms of cancer is also a common problem with other clinically used single biomarkers, including CA 125 for ovarian cancer, CA 19-9 for pancreatic cancer and CEA for colon cancer.20 Owing to low inherent predictive ability of some biomarkers and their overexpression by multiple cancer types, highly reliable prediction for a specific cancer ultimately require measuring a number of relevant biomarker proteins for each cancer. Multiple protein measurements have been shown to improve both the specificity and sensitivity of the diagnostic tests.15,20
For example, detecting 5 or more biomarkers for a given cancer by liquid chromatography-mass spectrometry (LC-MS) has provided >99% reliable diagnostics.6,23 Lumachi and his co-workers used simple multianalyte immunoassay for measurement of five protein biomarkers CEA, CA 19-9 and 72- 4, cytokeratin-19 fragment (CYFRA 21-1), and osteopontin, comparing their expressions in patients with colorectal cancer and age- and sex-matched patients suffering from confirmed benign colorectal diseases (controls). Single marker measurements showed low specificity and sensitivity; however, simultaneous measurements of all five markers achieved 74.1% sensitivity and 94.3% specificity in patients with colorectal cancer.24 Karl and colleagues evaluated expression of known markers hemoglobin (iFOBT), hemoglobin-haptoglobin, calprotectin, carcinoembryogenic antigen, and the novel fecal markers tissue inhibitor of metalloproteinase-1 (TIMP-1) and S100A12. The combination of S100A12, immune-FOBT, and TIMP-1 reached sensitivity greater
10 than 80% at a high specificity (98%), giving a novel noninvasive colorectal cancer screening tool.25 Also, when human Kallikrein 6 (hK6) is combined with CA-125, at 90% specificity, sensitivity increases to 72% (for all patients) and to 42% in stage I or II of ovarian cancer.26 The diagnostic sensitivity of serum hK6 alone at 90% and 95% specificity is 52% and 47%, respectively, in the whole patient population (n=238). For early stage disease (stage I or II), sensitivity is approximately 21% to 26%. However, measurements of the multiple biomarker proteins need to be done at high accuracy and cheaply at point-of-care, e.g. in a physician’s office or clinic, to reduce costs, minimize sample decomposition, facilitate-on the-spot diagnosis, and alleviate patient stress.15
1.3 Platforms for Cancer Biomarker Detection
1.3.1 Enzyme-Linked Immunosorbent Assay (ELISA)
Currently, most clinical protein biomarker detection is done using an enzyme-linked immunosorbent assay (ELISA). Since its introduction in 1971, ELISA has remained the gold standard method for protein measurements.27 In ELISA, primary antibodies are attached onto a 96-well plate to selectively capture the analyte protein from the sample. After washing, a secondary antibody with a label attached is added, and binds selectively to the protein on the surface. A substrate that reacts with enzyme label is then added to produce a colored complex detected optically (Scheme 1.1). Success of ELISA stems from enzyme-based amplification mode and ease of use, along with the specificity and
11 sensitivity of antibody-antigen interactions common to all immunoassays.28 ELISA-type approaches have been quite useful in assays utilizing immunoarrays. However, with the demand for multiplexing capability, shorter analysis time, smaller sample volume and higher sensitivity, other techniques are being explored for protein determinations.29,30
Scheme 1.1: ELISA Scheme; Antigen is added to ELISA plate coated with primary antibody, followed by addition of secondary antibody conjugate by enzyme label. Generation of signal is by addition of a substrate that forms a colored product that can be measured by an optical plate reader.
1.3.2 LC-MS based Proteomics & Commercial Assays
Liquid chromatography coupled with mass spectrometry (LC-MS)-based proteomics can achieve multiple biomarker measurements approaching acceptable sensitivity. However, the current analysis technology is too expensive, time consuming and technically complex for routine clinical diagnostics.17,31 At present, LC-MS-based proteomics is more suited for biomarker discovery research. Alternatively, analyzers based on antibody-coated
12 microarrays are being developed in 96- or 384-well plate format (Quansys Biosciences, SA Biosciences). Analyte proteins are captured by primary antibody or aptamers on each spot on the array and after washing with buffer designed to minimize non-specific binding, a labeled secondary antibody dispersion is added to bind to the analyte proteins. A substrate is then added to react with enzyme label to generate optical or electrical signal. These arrays are highly selective and sensitive, easy to use, less costly and have multiplexing capabilities.
Currently, there are several commercially available automated and semi-automated analyzers for multiplexed protein measurements of upto 10 selected target proteins per sample with detection limits ranging from 1-100 pg mL-1 in serum.15 These analyzers are based on surface plasmon resonance (Horiba Inc, BIO-RAD), fluorescence (Luminex, Myriad RBM), electrochemiluminiscence (Roche Diagnostics, Mesoscale Discovery) measurement technologies. However, these commercial instruments are not suitable for point of care applications in resource limited settings as they require specialized consumables including sample well plates, chips, and reagent kits which are very costly. Fluorescence-based detection strategies on the other hand require laser sources and precise alignment of optical components.19 Therefore, there is still a need for a simple, low-cost device for multiple protein measurements that could be employed in resource limited settings.
13 1.3.3 Electrochemical Methods
Electrochemical methods have recently attracted considerable interest because of their sensitivity, low cost and inherent minitiarization. In 1980s, Heineman and Halsall pioneered enzyme-linked electrochemical immunoassays for small molecules and proteins.32 In their approach, antibody-antigen binding events and enzyme substrate reactions were separated in space and time from detection of electroactive products. Electroactive products formed from the enzyme label alkaline phosphatase are transported by a chromatographic or fluidic system to the detecting electrode. Advances have included interdigitated electrodes to achieve high sensitivity and incorporation into microfluidic devices. Excellent detection limits in the pg mL-1 to ng mL-1 range have been obtained for proteins and small molecules depending on the design and nature of the electrochemical detector.33-35
Since the introduction of enzyme-linked electrochemical immunoassays by Heineman, various electrochemical methods such as voltammetry (linear sweep, differential pulse, square wave) and amperometry have been widely applied for sensitive detection of cancer protein biomarkers.19 These methods employ a detection antibody (Ab2) labeled with an electroactive species that is allowed to bind with the analyte (Figure 1.2). The analyte bound on the labeled-Ab2 is then introduced onto primary antibody (Ab1)-modified electrode surface to complete the sandwich assay. The concentration of the targeted protein biomarker is quantified by applying a potential and measuring the resulting current at the
14 electrode. The applied potential drives the redox reaction of the labeled electroactive species and provides a current signal that is proportional to the concentration of the protein analyte.19,33
Figure 1.2: Illustration of electrochemical method for protein biomarker detection. Signal generated is proportional to the concentration of the target analyte. Labels commonly employed include horseradish peroxidase (HRP) and alkaline phosphatase.
In order to increase the sensitivity of the electrochemical immunoassays, nanomaterials such as gold nanoparticles, carbon nanotubes (CNTs), magnetic beads and quantum dots have been incorporated into the assays as substrates for the capture antibodies or for target antigens.14,15,19,33 Signal amplification for target protein detection can be achieved by loading greater numbers of biomolecules or multi-enzymes onto nanomaterials. These approaches greatly
15 enhance sensitivity by providing a large number of labels for each protein bound on the sensor surface. Nanostructured sensor surfaces can also provide additional increases in sensitivity by providing high surface areas enabling attachment of a large number of capture antibodies, and by facilitating better access of protein analytes to these antibodies.19,33
Our laboratory has employed enzyme-coated magnetic beads along with sensors nanostructured with gold nanoparticles and CNTs to achieve high sensitivity. Gold nanoparticle immunosensor was fabricated by depositing a dense 5 nm layer of glutathione-decorated gold nanoparticles onto a 0.5 nm polycation layer, on a pyrolytic graphite.36 Detection limit of 0.5 pg mL-1 was achieved using 1 μm magnetic bead-Ab2-horseradish peroxidase (HRP) bioconjugates, coated with 7500 HRPs per bead. Good correlation was found between the immunosensor level of PSA in patient samples with the standard ELISA. Immunosensor responses were measured by rotating disk amperometry, using H2O2 to activate HRP to ferryloxyHRP species and hydroquinone as an electron mediator, which resulted in a steady state current proportional to protein concentration (Scheme 1.2).
Immunosensor for PSA in serum using multi-labeled CNT-HRP-Ab2 particles using this approach gave detection limits of 4 pg mL-1.37 SWCNT immunosensors were also used to measure PSA levels in 1000 prostate cancer cells laser dissected from prostate tissue. These immunosensors achieved a detection limit of 0.5 pg mL−1 for IL-6 released from a variety of oral cancer cells
16 into cell growth media.38 SWCNT forests provided 5 to 10-fold better sensitivity than immunosensors without nanotubes because of a large increase in density of Ab1 compared to that on a flat immunosensor.33
Scheme 1.2: Generation of signal from HRP. H2O2 activates HRP to ferryloxyHRP (1) form which further oxidizes hydroquinone to benzoquinone (2). Signal is generated via a two electron transfer reaction regenerating hydroquinone (3).
We recently employed AuNPs immunosensors for amperometric detection of PSA and IL-6 with magnetic bead conjugates labeled with 90,000 Ab2 and ~200,000 HRPs. With this method, PSA and IL-6 were analysed down to 0.1 pg mL-1 and 0.25 pg mL-1 respectively, in 5000-fold diluted calf serum.39 Increasing the number of labels on the magnetic bead surfaces to 400,000 HRPs, increase the sensitivity of the assay further (Figure 1.3). Limits of detection of 10 fg mL-1,
17 15 fg mL-1, 8 fg mL-1, and 60 fg mL-1 were reached for IL-6, IL-8, vascular endothelial growth factor (VEGF) and VEGF-C respectively in 5000-fold diluted calf serum.40 In collaboration with Munge et al, an unprecedented DL of 1.0 fg mL−1 for IL-8 using magnetic bead bioconjugates with a half-million HRP units each was achieved. An added advantage is that tens of thousands of antibodies can be included on 1 μm beads, promoting binding of analyte proteins to the beads at concentrations well below what can be achieved with a single antibody.41
Figure 1.3: AuNPs Immunosensor for amperometric detection of cancer protein biomarkers using magnetic bead conjugates labeled with thousands of Ab2 and HRPs.
18 1.4 Microfluidics for Biomarker Detection
Since its introduction in 199042, microfluidics also known as lab-on-chip
(LOB) or micro total analysis (mTAS), has attracted a lot of interest and grown explosively. Microfluidic technology possesses remarkable features for simple, low-cost and rapid disease diagnosis, such as; (1) increased surface-to-volume ratio for efficient mass transport in immunoreactions leading to fast analysis; (2) a miniaturized microchannel dimension to reduce sample and reagent consumption; (3) high portability along with automated integration with other functions such as valves, pumps, mixtures and detectors; and (4) analysis of complex biological fluids with high sensitivity for health care applications.43,44 An
enormous number of microfluidic devices have been developed for biomedical applications. These devices enable on-chip POC diagnosis and real-time monitoring of diseases from a small volume of body fluids. These microfluidic devices may act as a bridge to improve the global health care system with high efficiency and sensitivity, especially for remote areas with low-resource settings, such as the underdeveloped and developing countries, in home health care setting, and in emergency situations. Because of all these significant features, numerous microfluidic devices have been developed for biomarker detection in cancer diagnosis.43
Microfluidic chips for immunoassays are commonly fabricated from silicon, glass, and polymer materials.44 The first generation of microfluidic devices were made from silicon and glass by photolithography and wet-etching. However,
19 polymers such as polymethylmethacrylate (PMMA), cyclic olefin copolymer, polystyrene, and polydimethylsiloxane (PDMS) and paper-based microfluidic devices have emerged as alternative materials to silicon and glass due to the simple fabrication process (e.g., molding, printing) and low cost.45-47 Among the polymers, PDMS is the most popular material used for microfluidic immunoassays because of its flexibility, optical transparency, biocompatibility and low-autofluorescence properties. Furthermore, PDMS can be easily bonded to silicon, glass or another piece of PDMS through treatment with oxygen plasma.43,44
In recent years, great efforts have been devoted for the development of electrochemical detection-based microfluidic devices for detection of cancer biomarkers. For example, Li et al. developed an electrochemical ELISA on paper-based microfluidic devices.48 Paper-based microfluidic devices were fabricated by patterning chromatography paper using the photolithography technique. Working and counter electrodes were screen printed from graphite ink, and a reference electrode from silver/silver chloride ink. The electrochemical ELISA of IgG based on cyclic voltammetry (CV) was demonstrated with the LOD of 3.9 fM. Liu et al. developed a PMMA microfluidic chip coupled with a three-electrode electrochemical detection system to detect the trace level of AFP.49 For covalent immobilization of the AFP monoclonal antibody, PMMA microchannels were first modified with poly(ethyleneimine). The captured analyte, AFP, was finally bound to the HRP-conjugated AFP antibody for electrochemical detection.
20 When the substrate mixture of 2-amino hydroxybenzene and hydrogen peroxide was pumped into the PMMA microchannel, the HRP enzyme labeled on the AFP antibody within microchannels instantaneously catalyzed the substrate, and the generated electroactive 3-amino phenoxazine was detected using DPV. The immunochip had the LOD of 1 pg mL−1 for AFP with a detectable linear concentration range of 1–500 pg mL−1.
Figure 1.4: (A) Electrochemical microfluidic set up for off-line detection of cancer protein biomarkers. (B) Detection chamber housing the Ab1-modified 8-electrode array.
Our first microfluidic electrochemical immunoassay for multiplexed detection of cancer biomarkers was made up of a molded PDMS channel sandwiched between two PMMA plate and interfaced with a pump and sample
21 injector (Figure 1.4). The detection chamber was 63 μL volume in size and easily housed the 8-electrode array. Prior to incorporation of the array onto the detection chamber, the array was coated sequentially with a layer of PDDA, AuNPs and Ab1 as described in Figure 1.3. Protein analyte were captured off-line by magnetic bead conjugate and then introduced into the detection chamber to be captured by the primary antibody on the surface of the array. Detection of the target analyte was performed amperometrically by injecting a mixture of hydroquinone and hydrogen peroxide. This microfluidic device was employed for detection of oral cancer and prostate cancer biomarkers.38,39 For POC applications, the assays needs to be automated such that it only requires loading of reagents and samples.
1.5 On-line Protein Analyte Capture
Point-of-care devices require simple, low cost, adequately sensitive and technically undemanding automated methodology for personalized cancer diagnostics and therapy.14,15,19 However, most immunoassay techniques employ manual off-line protein analyte capture. Protein analytes are captured from serum by magnetic bioconjugates in small vials, outside microfluidic device, prior to being introduced to the Ab1-modified array (Figure 1.3). In addition, most immunoassay steps are performed manually limiting their applications for POC applications.
This thesis addresses for the first time, development and validation of a simple, low-cost, semi-automated microfluidic device for cancer biomarker
22 protein detection.50 The microfluidic immunoassay system incorporates an on-line protein capture chamber into the previously reported modular device by Chikkaveeraiah et al. (Figure 1.4).39 This chamber feature layer of molded, flexible PDMS sandwiched in between two flat, machined PMMA plates. The assembly is bolted together tightly to form an oval cylinder channel 1.5 mm wide and 100 ± 2 μL in volume housing a tiny magnetic stir bar (Figure 1.5). Flow out of the channel is directed to waste or to the detection chamber by a switch valve. Protein analytes are captured from biomedical samples by magnetic bead conjugates in the on-line capture chamber. The protein-magnetic bead conjugate is then magnetically separated, washed and introduced into the detection chamber housing an 8-electrode screen printed carbon arrays coated with glutathione protected gold nanoparticles (GSH-AuNPs).
Inclusion of the on-line protein capture module provides a more automated strategy compared to the earlier device that required off-line capture since capture and washing are done in the microfluidic system, not manually as previously (Figure 1.4). In addition, most immunoassay steps are incorporated into the microfluidic device, requiring only loading of reagents, samples and wash solutions by the operator. The assay requires relatively short time of 30 min, which is less than 50 min for the off-line capture assay and much less than standard ELISA (>2 hrs) and other commercial detection methods. Thus, assay time and level of automation begin to approach the needs of POC applications.
23 Figure 1.5: (A) Conceptual instrumentation and strategy for ultrasensitive amperometric detection by microfluidic immunoarray and (B) photograph of capture chamber in which target proteins will be captured on-line from the sample by heavily labeled HRP-antibody-magnetic beads to form protein-bead bioconjugates.
1.6 Summary/Overview of dissertation
In this Ph.D. research thesis, the main goal was to develop a low-cost semi-automated point-of-care diagnostic devices that can be used for rapid and sensitive measurement of protein biomarkers for various types of cancer. The immunoassay devices should ideally be affordable to use in any biomedical laboratory for mass screening of patient population especially in resource limited settings. This thesis is composed of 5 chapters.
Chapter 1 provides introduction to protein cancer biomarkers and various platforms employed for detection of the cancer protein biomarkers. This chapter also highlights electrochemical based protein detection strategies that are
24 currently implemented in the sensitive detection of biomolecules & biomarker proteins and also the importance of integration of microfluidics into immunoassay devices. The chapter also includes a summary of the goals of various projects in the thesis and the research background which served as a concrete foundation to the work presented in this thesis.
Chapter 2 describes a novel simple, low-cost semi-automated modular microfluidic device for on-line capture and detection of oral cancer protein biomarkers and oral mucositis biomarkers. This system incorporates an on-line capture chamber where protein analytes are captured from biomedical samples by magnetic bead conjugates. Ultralow detection limits of 5 fg mL-1 and 10 fg mL -1 were achieved for simultaneous detection of two oral cancer biomarkers and four oral mucositis biomarkers respectively. Accuracy and diagnostic utility of these microfluidic arrays were demonstrated by measuring the levels of the oral cancer biomarkers in conditioned media of oral cancer cell lines. The levels of oral mucositis biomarkers were also measured in serum of head and neck cancer patients undergoing radiotherapy and compared with standard ELISA to demonstrate the accuracy of the immunoarray. The use of microfluidic immunosensors to measure concentrations of elevated biomarkers holds promise for accurate, low cost, and rapid determination of oral cancer and also determination of projected risk of oral mucositis that can be used by dentists and oncologists for patient management.
25 Chapter 3 describes the first application of the on-line modular microfluidic device for detection of a peptide, parathyroid hormone-related peptide (PTHrP). PTHrP is recognized as the major a causative agent of humoral hypercalcemia of malignancy (HHM) and it has also been implicated in tumor progression and metastasis of many human cancers. The first ultrasensitive multiplexed assay to measure intact PTHrP 1-173 as well as circulating N-terminal and C-terminal peptide fragments is described in this chapter. Using, ink-jet printed gold nanoparticles immunoarray, limits of detection (LOD) of 3 fg/mL (~1000 fold lower than IRMA) were achieved for simultaneous detection of PTHrP isoforms and fragments in 30 min. Good correlation for patient samples was found with immunoradiometric assay (IRMA) (n=57); r2=0.99 assaying PTHrP 173 and 1-86 fragment. Analysis by ROC gave area under the curve of 0.96, 80-83% clinical sensitivity and 96-100% clinical specificity. This new ultrasensitive, multiplexed assay for PTHrP and fragments is promising for clinical diagnosis, prognosis and therapeutic monitoring from early to advanced stage cancer patients and to examine underlying mechanisms of PTHrP overproduction.
Chapter 4 describes a novel 16-electrode immunoarray set-up for simultaneous detection of upto 8 cancer protein biomarkers to aid in identifying aggressive from indolent forms of prostate cancer. The system consists of a two-channel reaction chamber and a two-two-channel detection chamber for detection of 4 protein biomarkers on each channel. The protein panel includes; PSA, vascular endothelial growth factor-D (VEGF-D), pigment epithelial derived factor (PEDF),
26 insulin growth factor-1 (IGF-1), insulin growth factor binding protein-3 (IGFBP-3), monocyte differentiation antigen CD-14 (CD14), V-Ets avian erythroblastosis virus E26 oncogene homolog ETS-related gene (ERG), and Golgi membrane protein 1 (GOLM-1); many of which are thought to be specific for aggressive prostate cancer. Detection limit in the pM range was achieved for multiplexed detection of the cancer biomarker proteins from as little as 5 μL. Measurements of this panel of selected biomarkers will be tested with prostate cancer patient samples in future to assess its diagnostic capability in discriminating aggressive from indolent forms of prostate cancer.
Chapter 5 describes the importance of incorporating nanomaterials in immunoassay. It also gives detailed description of the methods used in our laboratory to functionalize magnetic beads with antibodies and enzyme labels for ultrasensitive detection of protein analytes. In addition, it describes strategies for characterizing the magnetic bead bioconjugates employed in chapters 2, 3 and 4.
27 1.7 References
1. Siegel, R. L.; Miller, K. D.; Jemal, A., Cancer statistics, 2016. CA. Cancer J. Clin. 2016, 66, 7-30.
2. Altintas, Z.; Tothill, I., Biomarkers and biosensors for the early diagnosis of lung cancer. Sens Actuators B Chem. 2013, 188, 988-998.
3. Hejmadi, M.V; Introduction to cancer biology ISBN: 978-87-7681-478-6 2 edition Pg1-48
4. Rasooly, A.; Jacobson, J., Development of biosensors for cancer clinical testing. Biosens. Bioelectron. 2006, 21, 1851-1858.
5. Hanahan, D.; Weinberg, R. A., The hallmarks of cancer. Cell 2000, 100 (1), 57-70.
6. Tothill, I. E., Biosensors for cancer markers diagnosis. Semin. Cell Dev. Biol.
2009, 20, 55-62.
7. Soper, S. A.; Brown, K.; Ellington, A.; Frazier, B.; Garcia-Manero, G.; Gau, V.; Gutman, S. I.; Hayes, D. F.; Korte, B.; Landers, J. L.; Larson, D.; Ligler, F.; Majumdar, A.; Mascini, M.; Nolte, D.; Rosenzweig, Z.; Wang, J.; Wilson, D., Point-of-care biosensor systems for cancer diagnostics/prognostics.
Biosens.Bioelectron. 2006, 21, 1932-1942.
8. Adams, S.; Baum, R. P.; Stuckensen, T.; Bitter, K.; Hor, G., Prospective comparison of 18F-FDG PET with conventional imaging modalities (CT, MRI, US) in lymph node staging of head and neck cancer. Eur J. Nucl Med. 1998, 25, 1255-60.
28 9. Schmidt, G. P.; Haug, A. R.; Schoenberg, S. O.; Reiser, M. F., Whole-body MRI and PET-CT in the management of cancer patients. Eur. Radiol. 2006, 16, 1216-25.
10. Blodgett, T. M.; Meltzer, C. C.; Townsend, D. W., PET/CT: form and function.
Radiology 2007, 242, 360-85.
11. Kovacs, A. F., Remarks on sentinel node biopsy in head and neck cancer. Br. J. Cancer 2005, 92, 206-7.
12. Jodlowska, E.; Czepczynski, R.; Wyszomirska, A.; Jarzabek, G.; Kedzia, W.; Ruchala, M., Application of positron emission tomography (PET/CT) in diagnosis of breast cancer. Part I. Diagnosis of breast cancer prior to treatment. Contemp Oncol (Pozn) 2016, 20, 8-12.
13. Cooper, K. L.; Meng, Y.; Harnan, S.; Ward, S. E.; Fitzgerald, P.; Papaioannou, D.; Wyld, L.; Ingram, C.; Wilkinson, I. D.; Lorenz, E., Positron emission tomography (PET) and magnetic resonance imaging (MRI) for the assessment of axillary lymph node metastases in early breast cancer: systematic review and economic evaluation. Health Technol Assess. 2011, 15, 1-134.
14. Rusling, J. F., Multiplexed electrochemical protein detection and translation to personalized cancer diagnostics. Anal Chem. 2013, 85, 5304-10.
15. Rusling, J. F.; Kumar, C. V.; Gutkind, J. S.; Patel, V., Measurement of biomarker proteins for point-of-care early detection and monitoring of cancer.
29 16. Atkinson, A. J.; Colburn, W.A.; DeGruttola, V. G.; DeMets, D.L.; Downing, G.J.; Hoth, D. F.; Oates, J. A.; Peck, C. C.; Schooley, R. T.; Spilker, B. A.; et al. Biomarkers and SurrogateEndpoints: Preferred Definitions and Conceptual Framework. Clin Pharmacol Ther. 2001, 69, 89–95.
17. Hanash, S. M.; Pitteri, S. J.; Faca, V. M., Mining the plasma proteome for cancer biomarkers. Nature 2008, 452, 571-579.
18. Henry, N. L.; Hayes, D. F., Cancer biomarkers. Mol Oncol. 2012, 6, 140-146. 19. Chikkaveeraiah, B. V.; Bhirde, A. A.; Morgan, N. Y.; Eden, H. S.; Chen, X.,
Electrochemical immunosensors for detection of cancer protein biomarkers.
ACSnano 2012, 6, 6546-61.
20. Mani, V.; Chikkaveeraiah, B. V.; Rusling, J. F., Magnetic particles in ultrasensitive biomarker protein measurements for cancer detection and monitoring. Expert Opin. Med. Diagn. 2011, 5, 381-391.
21. Riedel, F.; Zaiss, I.; Herzog, D.; Gotte, K.; Naim, R.; Hormann, K., Serum levels of interleukin-6 in patients with primary head and neck squamous cell carcinoma. Anticancer Res. 2005, 25, 2761-5.
22. Ward, A. M.; Catto, J. W.; Hamdy, F. C., Prostate specific antigen: biology, biochemistry and available commercial assays. Ann. Clin. Biochem. 2001,
38, 633-51.
23. Li, J.; Zhang, Z.; Rosenzweig, J.; Wang, Y. Y.; Chan, D. W., Proteomics and bioinformatics approaches for identification of serum biomarkers to detect breast cancer. Clin Chem. 2002, 48, 1296-304.