LSU Master's Theses Graduate School
2013
Modeling, Simulation and Analysis of Renewable
Energy Production Systems: Application to
Multi-Product Biorefineries
Aryan Geraili Nejadfomeshi
Louisiana State University and Agricultural and Mechanical College, [email protected]
Follow this and additional works at:https://digitalcommons.lsu.edu/gradschool_theses Part of theChemical Engineering Commons
Recommended Citation
Geraili Nejadfomeshi, Aryan, "Modeling, Simulation and Analysis of Renewable Energy Production Systems: Application to Multi-Product Biorefineries" (2013).LSU Master's Theses. 1488.
APPLICATION TO MULTI-PRODUCT BIOREFINERIES
A Thesis
Submitted to the Graduate Faculty of the Louisiana State University and Agricultural and Mechanical College
in partial fulfillment of the requirements for the degree of
Master of Science in
The Cain Department of Chemical Engineering
by
Aryan Geraili Nejadfomeshi B.S., University of Tehran, 2010
Acknowledgements
I would like to thank my advisor Prof. Jose Romagnoli for his guidance, support, and supervision. His encouragement and trust in my abilities were a vital support to complete this study.
I wish to thank Dr. Sarker and Dr. Hung for accepting to serve on my committee. Finally, the endless patience and support of my family, especially my parents must also be appreciated.
Table of Contents
Acknowledgements ... iii
List of Tables ... vi
List of Figures ... viii
Nomenclature ... x Abstract ... xii 1. Introduction ... 1 2. Background ... 5 3. Biochemical pathway ... 12 3.1 Pretreatment ... 12
3.2 Enzymatic hydrolysis and fermentation ... 16
3.3 Purification and concentration ... 18
3.4 Heat and power generation ... 20
3.5 Waste water treatment ... 20
4. Methodology ... 21
4.1 Simulation procedure ... 23
4.2 Process description ... 24
4.3 Economic Analysis ... 34
5. Results and discussion ... 36
5.1 Detoxification technology options ... 36
5.2 Solid liquid separation process ... 38
5.3 Kinetic model results ... 38
6. Conclusions ... 56 References ... 58 Vita ... 62
List of Tables
Table 1: Dry weight composition of lignocellulosic feedstocks, %wt.(Mosier et al., 2005)... 7
Table 2: Alternative pretreatment technologies impact on biomass structure ... 14
Table 3: Corn stover composition ... 22
Table 4: Process data for dilute acid pretreatment ... 25
Table 5: Dilute acid pretreatment main reactions ... 26
Table 6: Kinetic model for enzymatic hydrolysis(Kadam et al., 2004) ... 29
Table 7: Kinetic model for ethanol fermentation(Leksawasdi et al., 2001) ... 30
Table 8: Alternative process configurations ... 34
Table 9: Ammonia Condition and overliming process data ... 36
Table 10: Comparison of alternative technologies for conditioning ... 36
Table 11: Comparison of alternative technologies for Solid separation ... 39
Table 12: Raw materials and product unit prices in scenario 1 ... 41
Table 13: Annual production cost in scenario1 ... 42
Table 14: Annual revenue, profit and capital cost in scenario 1 ... 42
Table 15: Raw materials and product unit prices in scenario 2 ... 45
Table 16: Annual production cost in scenario 2 ... 45
Table 17: Annual revenue, profit and capital cost in scenario 2 ... 46
Table 18: Raw materials and product unit prices in scenario 3 ... 48
Table 19: Annual production cost in scenario 3 ... 49
Table 21: Raw materials and product unit prices in scenario 4 ... 52 Table 22: Annual production cost in scenario 4 ... 52 Table 23: Annual revenue, profit and capital cost in scenario 4 ... 53
List of Figures
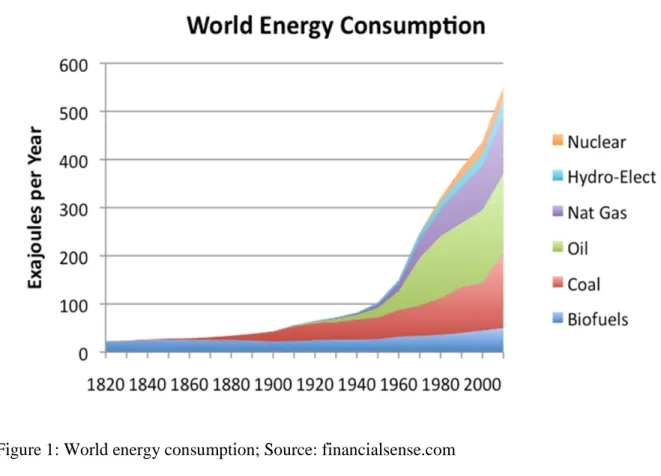
Figure 1: World energy consumption; Source: financialsense.com ... 1
Figure 2: Renewable energy production as a percentage of total energy; Source: EIA.gov ... 3
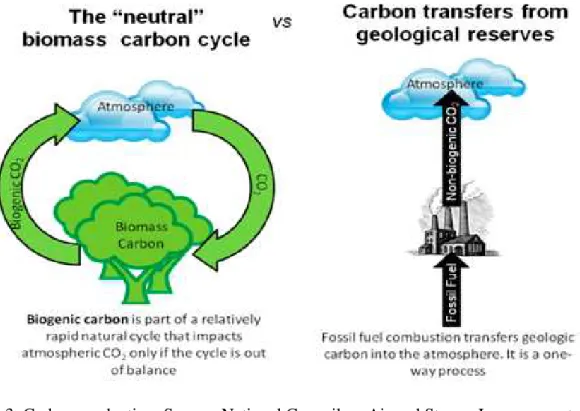
Figure 3: Carbon production; Source: National Council on Air and Stream Improvements... 6
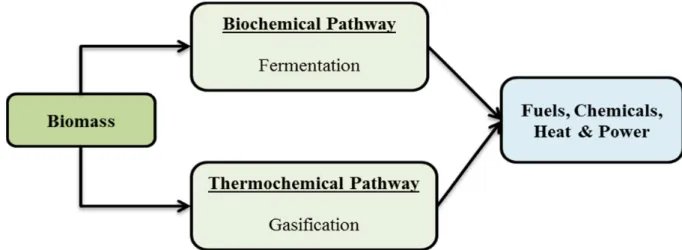
Figure 4: Biomass conversion pathways ... 9
Figure 5: Thermochemical conversion pathway ... 10
Figure 6: Biochemical conversion pathway ... 10
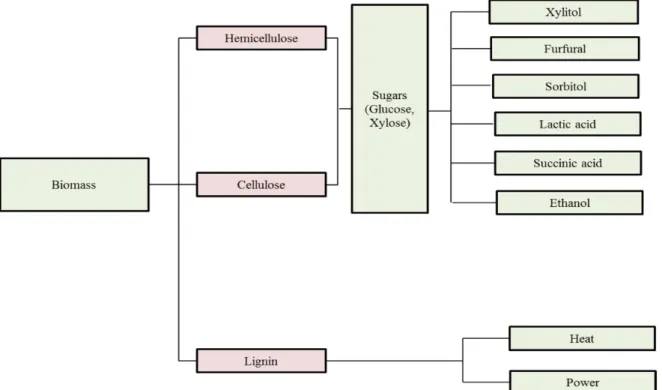
Figure 7: Potential products from biomass ... 11
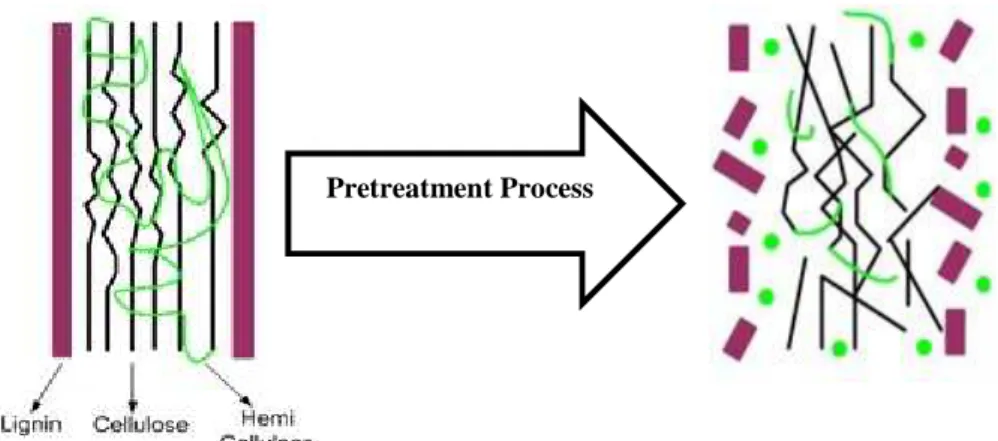
Figure 8: Biomass structure before and after pretreatment ... 13
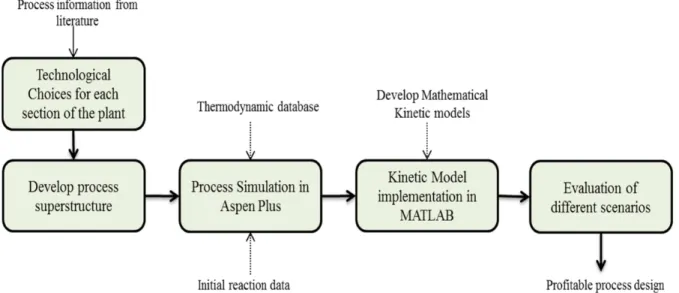
Figure 9: Schematic diagram for methodological approach ... 22
Figure 10: Overview of the biorefinery process ... 23
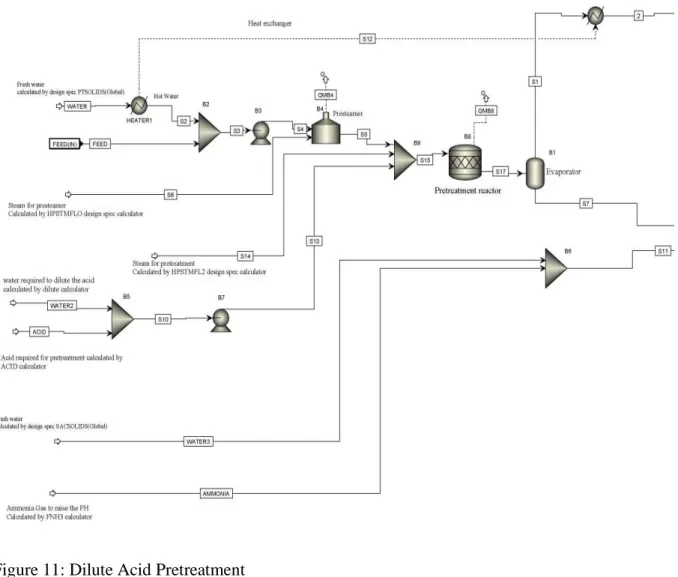
Figure 11: Dilute Acid Pretreatment ... 25
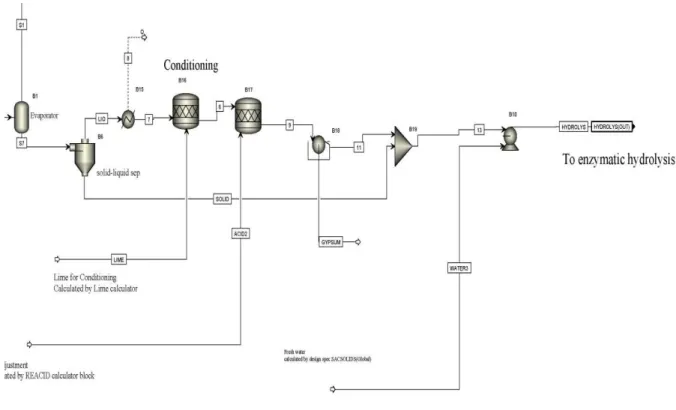
Figure 12: Overliming conditioning ... 27
Figure 13: Ammonia conditioning ... 27
Figure 14: Ethanol purification ... 31
Figure 15: General block diagram by solid separation after enzymatic hydrolysis ... 32
Figure 16: Process flowsheet for succinic acid production ... 33
Figure 17: Sugar and solid recovery for alternative conditioning technologies ... 37
Figure 18: Sugar conversion in ethanol fermentation for two alternative solid separation ... 39
Figure 19: Enzymatic hydrolysis in SHCF ... 40
Figure 20: Sugar fermentation in SHCF ... 40
Figure 22: Production costs for scenario 1 ... 43
Figure 23: Distribution of equipment cost for scenario 1 ... 44
Figure 24: Distribution of operating cost for scenario 2 ... 46
Figure 25: Production costs for scenario 2 ... 47
Figure 26: Distribution of equipment cost for scenario 2 ... 47
Figure 27: Distribution of operating cost for scenario 3 ... 50
Figure 28: Production costs for scenario 3 ... 50
Figure 29: Distribution of equipment cost for scenario 3 ... 51
Figure 30: Distribution of operating cost for scenario 4 ... 53
Figure 31: Production costs for scenario 4 ... 54
Figure 32: Distribution of equipment cost for scenario 4 ... 54
Nomenclature
Enzymatic hydrolysis
Rs substrate reactivity
α relating substrate reactivity with degree of hydrolysis, dimensionless = 1
Cs substrate concentration at a given time , g/Kg
S0 initial substrate concentration , g/ Kg
r1 cellulose to cellobiose reaction rate, g/ Kg. h
K1r reaction rate constant 1,g/mg.h = 22.3
CEiR bound Concentration of enzyme type i, g/Kg
CG2 cellobiose concentration, g/kg
CG glucose concentration, g/kg
CXy xylose concentration , g/kg
K1IG2 inhibition constant for cellobiose 1,g/kg = 0.015
K1IG inhibition constant for glucose 1,g/kg = 0.1
K1IXy inhibition constant for xylose 1,g/kg = 0.1
r2 cellulose to glucose reaction rate, g/Kg
K2r reaction rate constant 2,g/mg.h = 22.3
K2IG2 inhibition constant for cellobiose 2,g/kg = 132
K2IG inhibition constant for glucose 2,g/kg = 0.04
K2IXy inhibition constant for xylose 2,g/kg = 0.2
r3 cellobiose to glucose reaction rate, g/Kg
K3r reaction rate constant 3, ℎ = 285.5
K3M substrate(cellobiose) saturation constant, g/kg = 24.3
K3IG inhibition constant for glucose 3 , g/kg = 3.9
K3IXy inhibition constant for xylose 3, g/kg = 201.0
E1max maximum enzyme 1 that can be adsorbed on substrate, g/g = 0.06
E2max maximum enzyme 2 that can be adsorbed on substrate, g/g substrate = 0.01
K1ad dissociation constant for enzyme 1, g protein / g substrate = 0.4
K2ad dissociation constant for enzyme 2, g protein / g substrate = 0.1
CEiF free enzyme concentration , g/kg
Kir(T) reaction constant at temperature
Ea activation energy, cal/mol = -5540
R universal gas constant , cal/ mol.K = 1.9872
T temperature , kelvin
Ethanol fermentation
r4 cell growth rate on glucose, g/ Kg. h
µm,g maximum specific growth rate in cell growth(glucose as substrate),1/h = 0.31
CG glucose concentration, g/kg
K4g monod constant for growth on glucose, g/kg = 1.45
CEt ethanol Concentration, g/kg
CEtx,g threshold Ethanol Concentration in cell growth(glucose as substrate), g/kg= 28.9
CEtmax,g maximum ethanol concentration in cell growth(glucose as substrate), g/kg = 57.2
K4Ig inhibition constant for growth on glucose, g/kg = 200
Cxy xylose concentration, g/kg
K5xy monod constant for growth on glucose, g/kg = 4.91
CEtx,xy threshold Ethanol Concentration in cell growth(xylose as substrate), g/kg= 26.6
CEtmax,xy maximum ethanol concentration in cell growth(xylose as substrate), g/kg = 56.3
K5Ixy inhibition constant for growth on xylose, g/kg = 600
r6 total cell growth rate, g/kg.h
CX Cell concentration, g/kg
α weighing factor for glucose consumption, dimensionless = 0.65
r7 glucose consumption rate, g/kg.hr
qsmax,g overall maximum specific glucose utilization, g/g.hr = 10.9
K7g substrate limitation constant in glucose consumption, g/kg = 6.32
CEtis,g threshold Ethanol Concentration in glucose consumption, g/kg= 42.6
CEtmax,g maximum ethanol concentration in glucose consumption, g/kg=75.4
K7Isg substrate Inhibition constant in glucose consumption, g/kg = 186
r8 xylose consumption rate, g/kg.hr
qsmax,xy overall maximum specific xylose utilization, g/g.hr = 3.27
K8xy substrate limitation constant, g/kg = 0.03
CEtis,xy threshold Ethanol Concentration in xylose consumption, g/kg= 53.1
CEtmaxsxy maximum ethanol concentration in xylose consumption, g/kg= 81.2
K8Isxy substrate Inhibition constant in xylose consumption, g/kg = 600
r8 Ethanol formation rate by glucose fermentation, g/g.hr
qpmax,g overall maximum specific ethanol production by glucose fermentation , g/g.hr = 5.12
K9g substrate limitation constant in glucose fermentation, g/kg = 6.32
CEtip,g threshold Ethanol Concentration in glucose fermentation, g/kg = 42.6
CEtimaxp,g maximum ethanol concentration in glucose fermentation, g/kg = 75.4
K9Ipg substrate Inhibition constant in glucose fermentation, g/kg = 186
r10 ethanol formation rate by xylose fermentation, g/g.hr
qpmax,xy overall maximum specific ethanol production by xylose fermentation , g/g.hr = 1.59
K10xy substrate limitation constant in xylose fermentation, g/kg = 0.03
CEtip,xy threshold Ethanol Concentration in xylose fermentation, g/kg = 53.1
CEtmaxp,xy maximum ethanol concentration in xylose fermentation, g/kg = 81.2
K10Ipxy substrate Inhibition constant in xylose fermentation, g/kg = 600
Abstract
The primary purpose of this research is to investigate the design and modelling of fully integrated processes which utilize renewable feedstock as raw materials and evaluate the alternative technology and possible process integration options for biorefinery processes to select the optimal configuration based on the production yields and economical profit criteria. The case study considered in this work is a lignocellulosic biorefinery plant which has different technology choices for each section of the process and the ability to produce multi-products from lignocellulosic raw materials.
We analyzed different scenarios by simulating the superstructures in Aspen Plus. To incorporate more non-linarites in the process and put more realism in simulations, complex kinetics of bio-reactions are modeled in Matlab based on the experimentally calculated kinetics from literature. To reduce the toxicity of hydrolysates generated from pretreatment, detoxification is necessary as the by-products can have negative impact on downstream process sections such as enzymatic hydrolysis and fermentation. Two technology options are considered for detoxification process in our study. Additionally, two alternative solid separation routes are proposed and evaluated. Sustainable biorefinery requires a portfolio of products to produce different bio-fuels and bio-chemicals. In this work, one of the proposed scenarios considers succinic acid as a co-product of the plant.
Final results show the optimal biorefinery process by evaluating the alternative process configurations based on the product yields and economic parameters. Succinic acid production makes a huge increase in the profitability of the plant. Ammonia conditioning is selected as detoxification technology, and separating solids after the first distillation column is the preferable technology.
1. Introduction
Over the last century, world energy consumption has increased progressively owing to the growing demand by burgeoning industrial societies in emerging markets and the rising world population (Figure 1). The current global state of energy supply is highly dependent on fossil fuels. Owing to finite nature of fossil fuels, rapid increase in their prices and concerns about their environmental impact, efforts around the world to develop and commercialize alternative transportation fuels and chemicals have intensified (Cardona & Sanchez, 2007). Energy sources have been split into three categories: fossil fuels, renewable sources and nuclear sources. Fossil fuels include coal, petroleum and natural gas.
Renewable energy in its broad sense is energy that is derived from natural resources such as sunlight, wind, water, and geothermal heat; these resources have shorter cycles of replenishment and are provided by nature on a “near-continuous” basis. Renewable energy, as a final product, comes in 2 essential forms; (1) electricity that is transported geographically using fixed transportation mediums such as utility grids and wires, and (2) transportation fuels, such as biodiesel, ethanol and butanol, whose mediums (vehicles) are mobile in nature. Once we have categorized the type of renewable energy, we can start to focus on the renewable resources that are currently utilized to produce these energies. Solar, wind, water, and hydrothermal sources in their native forms are used mostly to produce electricity. Renewable energy as a percentage of total energy supplied in the United States has been stuck at around 7-12 percent, although with recent initiatives and policies there seems to be a breakout in the trend with a larger percentage of our total energy supply coming for renewable (Figure 2).
In order to democratize the use of renewable energy specifically as transportation fuels, a seamless transformation where the renewable resources are converted from their native forms to a more usable and convertible form, is necessary. Fortunately nature provides such a transformative process through the use of photosynthesis, where carbon inputs are chemically altered into organic compounds using energy from sunlight. These compounds, primarily in the form of sugars and lipids, are used to form the structure and backbone of almost all plants and trees we see around us. The question then becomes, what processes and technologies are needed to harvest this natural energy and convert them into usable forms for use as portable, transportation fuels in an economically viable and environmental and socially responsible manner.
Figure 2: Renewable energy production as a percentage of total energy; Source: EIA.gov
The objective of this research is to investigate the design and modelling of fully integrated processes which utilize renewable feedstock as raw materials and evaluate the alternative technology and possible process integration options for biorefinery processes to select the optimal configuration based on the environmental impacts and economical profit criteria. The case study considered in this work is a lignocellulosic biorefinery plant which has different technology choices for each section of the process and the ability to produce multi-products from lignocellulosic raw materials.
Chapter 2 introduces the concept of biorefinery process and different platforms for biofuel production by considering the limitations in each process pathway. In chapter 3, biochemical production pathway in biofuel production and all the alternative technology options
for each section of the plant are explained. The proposed methodology in this study to evaluate different scenarios by considering detailed modeling, simulation, and economic evaluation is explained in chapter 4. Finally, in chapter 5 results obtained by evaluation of different scenarios based on production and economic criteria are represented to select the preferable technology and modifications for each section of the plant.
2. Background
The biorefinery system is based on biomass as feedstock for production of bio-based products such as biofuels and bio-chemicals. Biomass is the term used to describe all biologically produced matter based in carbon, hydrogen and oxygen. Its energy is derived from plant and animal material such as wood from natural forests, waste from agricultural and forestry processes and industrial, human or animal wastes. The concept of a biobased facility had been prevalent in the United States and the world in general, for hundreds of years. Paper and sugar mills are quintessential examples of bio-facilities where renewable raw materials such as wood pulp and sugarcane are converted to value-added products. The use of composting facilities and waste digesters in farms and rural areas around the world has been a source of sustainable generation of electric power from renewable resources for decades. In recent times, the emphasis on biobased production using renewable resources has significantly broadened its footprint to incorporate production of fuels, power and chemicals derived from a wider variety of renewable resources (Naik et al., 2010). Some renewable transportation fuels that are already in the commercial production phase include first generation ethanol (corn ethanol) and biodiesel (from vegetable oils and animal fats). The biofuels produced from renewable resources could help to reduce the world’s dependence on oil and also reduce CO2 production. These biofuels have the potential to cut CO2 emission because the plants they are made from use CO2 as they grow; therefore the released CO2 is biogenic carbon which is initially sequestered from the atmosphere by photosynthetic processes occurring during plant growth (Figure 3).
Biomass as mentioned before includes plant materials such as trees, grasses, agricultural crops, and animal manure. Solar energy is captured in biomass as fixed carbon by photosynthesis in which carbon dioxide (CO2) is converted to organic compounds.
Figure 3: Carbon production; Source: National Council on Air and Stream Improvements
This process is the initial step for biomass growth as it is shown in the following equation(Klass, 1998):
CO2 + H2O + light + chlorophyll CH2O+ O2
In photosynthesis reaction, inorganic materials are used to produce organic compounds
and release oxygen. The primary organic compounds building block in biomass is (CH2O).
Biomass can be divided in two main groups: crop biomass and wood biomass. Crop biomass includes corn, sugarcane, sorghum, soybeans, etc. Some examples of wood biomass include grasses, stalks, stover, etc. Wastes from municipal areas and animal are also considered in the second type of biomass (wood biomass). The primary constituents of crop biomass are glucose and starch. On the other hand, wood biomass contains cellulose, hemicellulose and lignin. Cellulose is the polymeric form of glucose (6 carbon sugar), and hemicellulose is the polymeric form of xylose (5 carbon sugar). The agricultural residues and energy crops such as switch grass
are known as lignocellulosic biomass resources. The main components of lignocellulosic (cellulosic) materials are cellulose, hemicellulose and lignin. Generally, lignocellulosic materials contain 30-50 % cellulose, 20-30% hemicellulose, and 20-30% lignin. The compositions of different lignocellulosic materials are represented in Table 1. Lignin is a complex polymeric compound that helps to bind the cellulose/hemicellulose mixture; its molecular structure is very random and disorganized.
Table 1: Dry weight composition of lignocellulosic feedstocks, %wt.(Mosier et al., 2005)
Feedstock Glucan (cellulose) Xylan (hemicellulose) Lignin
Corn Stover 37.5 22.4 17.6
Corn fiber 14.28 16.8 8.4
Popular 49.9 17.4 18.1
Wheat straw 38.2 21.2 23.4
Switch grass 31.0 20.4 17.6
Many countries are producing biofuels worldwide; currently practiced technologies in biofuel industry are primarily based on feedstocks from food crops such as grains, sugar cane and vegetable oils. However, these processes have concern since there is a competition for their utilization in food production chains and biorefinery processes. These types of biofuel production technologies are called first generation biofuels. Brazil and United States ethanol production from biorefinery plants are growing rapidly. In Brazil, sugar cane is used as the feedstock and corn is the main feedstock in the United States. Owing to increased sugar cane production to more than offset amount of sugar diverted to ethanol production in Brazil, this bioethanol production technology has little impact on food supplies and costs. However, in the United States corn grain is an important food and animal feed commodity, therefore, concerns
about food supply chains and prices have been raised. The main disadvantage of first generation biofuels is the food-versus-fuel debate.
To overcome these concerns and the overall limitation of the feedstocks utilized for the first generation biofuels, advanced or second generation biofuels are required to produce alternative fuels from renewable resources which are more efficient. The feedstocks utilized in second generation biofuels are lignocellulosic waste materials, residues and energy crops which include the nonfood cheap and abundant materials. These types of biofuels have the advantage of being produced from waste materials that do not compete with the food value chains. However, at present the production of second generation biofuels are not cost effective due to the technological barriers and yield issues. To overcome these problems, development and optimization demand is still required for these production technologies before their commercial production.
Second generation conversion platforms can broadly be subdivided into 2 major pathways: (1) biochemical conversion pathways based on fermentation, and (2) thermo-chemical conversion pathways based on heat-based technologies like gasification and pyrolysis (Figure 4). Each pathway has been shown to have great promise, but each suffers from separate issues that prevent their commercial scale up.
Thermochemical conversion platform, Figure 5, is based on gasification technology that involves:
• conversion of biomass in a steam and oxygen rich atmosphere to produce a carbon rich
gas known as syngas, which is a mixture of carbon monoxide, carbon dioxide, and hydrogen
Figure 4: Biomass conversion pathways
• Upgrade this gas catalytically to mixture of alcohols including methanol, ethanol,
propanol, and butanol that are then separated and distributed for end-use fuel and chemical applications
• A heat and power recovery system to make the plant self-sufficient in terms of heat and
power requirements
Biochemical conversion pathway, Figure 6, consists of the processes to convert the polymers in the complex structure of the biomass to sugars and converting the sugar to the products subsequently.
In this platform a flexible production route is provided to produce a range of bio-based fuels and chemicals. An overview of the potential products in the biorefinery process is shown in Figure 7. The major steps utilized in the conversion chain from feedstock to value-added fuels and chemicals include:
• Fractionation and hydrolysis of polymeric lignocellulosic feedstock to yield five and six
Figure 5: Thermochemical conversion pathway
• Sugar fermentation to yield ethanol and other co-products of the plant
• Recovery and purification of products to reach the purity required for the products for the
end-use applications
Figure 6: Biochemical conversion pathway
• Waste water treatment and recycling the purified water back to process to be reutilized
• Steam and power generation in the boiler and steam turbines to make the plant self-sufficient and sale of excess power to grid as a by-product of the plant
Figure 7: Potential products from biomass
The intermediate product in the thermochemical pathway and biochemical pathways are syngas and sugars, respectively. Thermo-chemical pathways require a large investment of capital, energy optimization and heat integration of process operations, and efficient downstream clean up and conversion processes to convert gasification/pyrolysis effluents to biobased fuels and chemicals in a profitable manner. Biochemical conversion pathways suffer from issues including large capital requirements for plant establishment, and inability to replicate lab-scale process yields on a commercial scale, especially yields that involve biological technologies such as enzymes and micro-organisms.
3. Biochemical pathway
In this study, the sugar-based fermentation platform is selected as the production route to analyse different technology options and integration possibilities for each section of the process and also considering a product portfolio consisting of multi products in the biorefinery plant to investigate the profitability of the process based on appropriate technology and product portfolio selection. As mentioned before, biochemical conversion pathway consists of different sections to convert the biomass in the polymeric shape to the products. In this part each of these sections are explained in more detail and different options suggested as the operating route for each section are introduced.
3.1 Pretreatment
Carbohydrate polymers of cellulose and hemicellulose in biomass can be converted to alcohols and chemicals through fermentation technologies when these polymers are hydrolyzed into their component sugars. However, structural composition of lignocellulosic materials is recalcitrant to enzymatic hydrolysis due to the complexity of structural matrix and trapped carbohydrates in the lignocellulosic materials. To overcome this problem, pretreatment of biomass is always required to remove or modify the complex matrix of lignin and hemicellulose as represented in Figure 8. In general, pretreatment methods can be classified into three categories, (1) physical, (2) chemical and (3) biological. The overall purpose of pretreatment process is to break down the complex matrix formed by lignin and hemicellulose, disrupt the crystalline structure, convert part of hemicellulose to its monomeric sugars and reduce the degree of polymerization of cellulose. The nature and extent of such changes are dependent on the type of pretreatment technology implemented in the plant. For instance, some pretreatment technologies produce sugar degradation products such as furfural which has adverse effect on the
fermenting organism and the cellulose enzyme activity in enzymatic hydrolysis. An ideal pretreatment technique should be able to recover maximum available carbohydrates in biomass structure while minimizing the degradation of them and generation of inhibitors for the reactions in hydrolysis and fermentation. Pretreatment has been viewed as one of the most expensive processing steps within the conversion of biomass to fermentable sugar (Zheng et al., 2009) and also all the operations in the biorefinery process are affected by the choice of pretreatment technology selected (Da Costa Sousa et al., 2009).Therefore it is believed that this process can have great potential for the improvement of efficiency and reduction of production cost in biorefinery processes by considering the improvements and possible modifications to alternative technology options for pretreatment.
Figure 8: Biomass structure before and after pretreatment
Various pretreatment technologies have been studied to process biomass for biofuel production. Each of them has its intrinsic advantages and disadvantages. Some of these pretreatment methods are categorized based on characteristics that they have and their impact on biomass structure in Table 2.
Table 2: Alternative pretreatment technologies impact on biomass structure
Feedstock Increased Accessible
Surface area
Hemicellulose removal Lignin
Liquid hot water Yes Yes No
Dilute acid Yes Yes No
AFEX Yes Yes (minor) Yes
In the following section, some of pretreatment technologies are explained in detail: 3.1.1 Liquid hot water (LHW) pretreatment
This is one of the physical pretreatment technologies. Physical pretreatment methods include the reduction in biomass size, steam explosion and hydrothermolysis (Allen et al., 1996; van Walsum et al., 1996). LHW pretreatment utilizes pressure to maintain water in the liquid state at high temperatures. In this process, hot water contacts with biomass at temperatures of 200-230 °C. Water pretreatment reduces the need for detoxification and neutralization of the liquid since acid is not added in pretreatment process and also this process has the advantage of producing little or no sugar inhibitor for enzymatic hydrolysis and sugar fermentation (van Walsum et al., 1996).
3.1.2 Ammonia fiber explosion (AFEX)
AFEX is one of the physical-chemical pretreatment technologies which combines physical and chemical treatment options. Often, milder chemical conditions are used; however, operational conditions are more extreme, typically involving elevated pressure and temperature. In AFEX, biomass is exposed to hot liquid ammonia under high pressure for a period of time, and then pressure is suddenly released. This pressure reduction helps to increase the digestibility of biomass and break the physical structure of the crop. The composition of the AFEX pretreated material is essentially the same as original. The important advantages of AFEX are; (1) producing negligible inhibitors for the downstream biological processes; and (2) requiring no
particle size reduction(Mes-Hartree et al., 1988). However, ammonia must be recycled after this pretreatment to reduce the cost of pretreatment due to high ammonia cost and environmental protection. Therefore, the cost of this technology is negatively affected by ammonia cost and the cost of its recovery. In addition, AFEX performance loses its efficiency for feedstocks with high lignin content such as hardwood and newspaper (Mosier et al., 2005; Zheng et al., 2009).
3.1.3 Acid pretreatment
Acid pretreatment is one of technologies which have been explored extensively in recent years. Several acidic pretreatment technologies are available such as concentrated and dilute acid. The acid is used to hydrolyse the feedstock chemically. Dilute acid pretreatments typically use sulphuric acid as a catalyst to solubilize hemicellulose and lignin at low acid concentration (0.05-5%) and increase the digestibility of cellulose in enzymatic hydrolysis (Da Costa Sousa et al., 2009). High reaction rate, low acid consumption, and low cost of sulphuric acid are some of the advantages of dilute sulphuric acid pretreatment. However, this process has important limitations. Due to acid existence, this technology is very corrosive and it mandates to use expensive construction materials. In addition, degredation products such as furfural, 5-hydroxymethylfurfural, inhibitors such as acetic acid, and corrosion products are produced in this process (Yang & Wyman, 2008).
In biological pretreatment processes, microorganisms such as brown-, white- and soft-rot fungi are used to degrade lignin and hemicellulose in waste materials (Sun & Cheng, 2002). These pretreatment technologies have the advantage of low chemical and energy utilization in addition to mild operational conditions.
However, currently no biological pretreatment is available in industry due to very slow process and controllability issues (FitzPatrick et al., 2010; Yang & Wyman, 2008).
3.2 Enzymatic hydrolysis and fermentation
The main conversion steps for biofuel production from lignocellulosic materials include hydrolysis of cellulose to fermentable sugars, and fermentation of sugars to biofuels. The hydrolysis is usually catalysed by enzyme and fermentation is carried out by the yeast or bacteria. The important factors that affect the hydrolysis are: accessible surface area of biomass, cellulose fiber crystallinity, and lignin and hemicellulose content (Mcmillan, 1994). Based on the complex structure of lignocellulosic materials, when lignin and hemicellulose are present in the biomass structure, the accessibility of enzyme to cellulose is difficult. Therefore, hydrolysis efficiency will be reduced. Lignin and hemicellulose removal, and cellulose crystallinity reduction can occur in pretreatment as explained in the previous section which can significantly improve the hydrolysis.
3.2.1 Enzymatic hydrolysis
Enzymatic hydrolysis of cellulose is carried out by cellulase enzymes which are usually a mixture of several enzymes. In hydrolysis, the cellulose is converted into glucose sugars ((C6H10O5)n+nH2O nC6H12O6). At least three groups of enzymes are involved in the hydrolysis
process: (1) endoglucanase (EG, endo-1,4-D-glucanohydroase, or EC 3.2.1.4) which attacks
regions of low crystallinity in the cellulose; (2) exoglucanase or cellobiohydrolase ( CBH, 1,4-β
-D-glucan cellobiohydrlase, or EC 3.2.1.91.) which degrades the molecule further by removing
cellobiose units from the free chain-ends; (3) β-glucosidase (EC 3.2.1.21) which hydrolyzes
cellobiose to produce glucose (Coughlan & Ljungdahl, 1988). There are also some enzymes in
cellulase mixture to attack hemicellulose such as glucuronidase, acetylesterase, β-xylosidase and
gluco-mannanase(Duff & Murray, 1996). Substrate, cellulase activity, and reaction conditions (temperature, pH) are the factors that affect enzymatic hydrolysis efficiency.
3.2.2 Ethanol fermentation
The monomeric sugars produced in enzymatic hydrolysis and pretreatment should be fermented to ethanol and other biofuels in fermentation. In recent years, a considerable amount of research has been done to develop yeast which can utilize the sugars with reasonable yields and rates (Olsson et al., 1995; Zhang et al., 1995). Recombinant strains, which are developed by genetically engineered yeasts which produce ethanol from glucose, are able to ferment glucose and xylose simultaneously, co-fermentation, such as the strain developed by Zhang et al. (1995).
When enzymatic hydrolysis and fermentation are performed sequentially, the process is called separate hydrolysis and co-fermentation (SHCF). However, the two process steps can be performed simultaneously which means that saccharification and fermentation occur at the same time (SSCF).
3.2.3 Succinic acid fermentation
One of the advantages of the biorefinery processes is the capability to produce higher value, lower volume co-products. Succinate was suggested as a co-product to improve the economics of industrial ethanol fermentations (Lynd et al., 2002).
Succinic acid is an important four carbon platform chemical that can be produced by the
microorganisms such as Anaerobiospirillum succiniciproducens and Manheimia
succiniciproducens from renewable resources. At present, succinic acid is largely produced from maleic anhydride which is a petrochemical product from butane. Succinic acid is utilized in the production of pharmaceuticals, surfactants, detergents, and ingredients to stimulate animal and plant growth. A large scale process focused on co-production of biofuels is to produce ethanol and succinic acid in separate fermentations but in the same facility. One of the innovative
integrations suggested by co-production of ethanol and succinic acid is the utilization of CO2
waste from the ethanol fermentation in succinic acid production (Zeikus et al., 1999). 3.3 Purification and concentration
Product stream from fermentation, also called beer, is a mixture of desired product, undesired product, cell mass and water which needs to be purified and concentrated. The technologies for purification depend on the type of products recovered. All the technologies in downstream processing use one or several differences in the chemical and physical properties of the desired product from other materials. For instance, in cases where fermentation products are more volatile than water, recovery by distillation is the technology of choice. In this study a multi-product plant including ethanol and succinic acid as the final products is considered.
3.3.1 Bioethanol purification
When ethanol is produced from renewable biomass, it is called bioethanol. Bioethanol utilization as biofuel has the advantages of being both a renewable and also an environmentally-friendly fuel source. Alternative technology options are suggested for bioethanol recovery such as distillation, and pervaporation.
Difference in the volatilities of substances in the fermentation broth is the prerequisite for separation by distillation columns. Typically, feed is preheated and then enters to a continuous column which consists of stages. The volatile compound evaporates and the vapour moves upward and leaves the column at the top. The high-boiling compounds remained in the liquid phase move downward, and leave the column at the bottom. In bioprocesses, it is employed for the recovery of large-volume, low-boiling products such as ethanol.
Membrane systems, such as pervaporation, have become viable alternative to traditional separation methods such as distillation columns which are energy intensive (Van Hoof et al.,
2004). In pervaporation, membranes are utilized with liquid feed on one side, and a low pressure permeated gas on the other side. Due to lower required heat input in pervaporation, this process can save on cost associated with the heat and steam needed for the reboiler of distillation columns. However, membrane cost and life expectancy of the membrane are two important factors which should be considered to compare the efficiency of this separation technology with distillation column.
3.3.2 Succinic acid purification
In succinic acid fermentation based processes, Considerable cost is associated with purification, more than 60% of the total production costs (Bechthold et al., 2008). Separation of by-products produced in succinic acid fermentation such as acetic acid, formic acid, and lactic acid have a crucial effect on process cost. Several possible alternative technology options exist for the recovery of succinic acid from fermentation broth including electro-dialysis, precipitation, extraction, and crystallization.
Glassner and Datta (1992) investigated a purification process by a conventional electrodialysis followed by water-splitting electrodilysis. In this process most of the salt cations are removed and a high purity acid stream is produced. The precipitation technology for succinic acid purification was investigated by Datta et al. (1992). In their method, succinic acid precipitates into the fermentation broth by addition of calcium dihydroxide. Calcium succiniate is recovered by filtration and converted to succinic acid by adding sulphuric acid. Extraction of succinic acid with an amine based extractant has been shown in the work by Huh et al. (2006). In this process selective separation of the desired product, succinic acid, from fermentation broth containing mixed acids is based on a reversible reaction between extractant and extracted carboxylic acid. In the work by Li et al. (2010) a one step recovery method for succinic acid
purification is investigated which selectively crystallizes succinic acid based on the variation of succinic acid solubility at different PHs.
3.4 Heat and power generation
The goal of this section of the biorefinery process which consists of combustor, boiler, and turbogenerator is to burn various organic materials collected from the biorefinery plant to produce steam and electricity. The organic materials utilized in the burner include all the solids recovered from the process such as lignin, and unconverted cellulose and hemicellulose, biogas from anaerobic digestion, and sludge from aerobic digestion in waste water treatment. The advantages of including combined heat and power generation section in the process are; producing required steam and electricity of the plant which helps the biorefinery process to be self-sufficient in energy, reducing the solid waste disposal cost, and generating additional revenue by selling the excess electricity produced as a by-product of the plant.
3.5 Waste water treatment
Treating the waste water streams generated in the biorefinery process is necessary to pure the water to quality levels required for recycle. Waste water treatment process helps to reduce the requirement for fresh make-up water and discharge to environment. Waste water which is a combination of water coming from different sections of the process area is processed by anaerobic digestion and aerobic digestion to digest the organic matters in the water. Anaerobic digestion produces biogas which is rich in methane, and after that aerobic digestion produces water which is relatively clean and can be used again in the process. In addition to purified water, sludge is also produced in aerobic waste water treatment. Sludge and biogas will be utilized in the combustion section.
4. Methodology
In this section, a methodology is proposed to analyze different process configurations by considering alternative technology options, modification to process sections, and implementation of possible process integrations. Figure 9 represents a general schematic structure of this methodological approach. As this diagram shows in the first step information for process conditions of all the possible technology options are gathered from literature data. By considering the limitations in the biorefinery process, the technology options for each section of the process are selected to design different super structures of the biorefinery plant. At this stage we have different scenarios which can be analyzed and compared with each other. Based on the selected scenarios and initial information obtained from literature data for conversion of the reactions in bio-reactors, different process configurations are simulated in Aspen Plus. Kinetic models for the complex reactions occurring in the bioreactors obtained from literature are implemented in Matlab to consider the nonlinearities of the bio-reactions in biorefinery and make the simulation results more accurate. Aspen plus software is linked to Matlab by utilizing ActiveX Automation interface technology.
An overview of the biorefinery process including all the alternative technology options for each section of the process is presented in Figure 10. The technologies utilized in this study are obtained from National Renewable Energy Laboratory (NREL) reports (Humbird et al., 2011; Kazi et al., 2010) and proposed models of (Li et al., 2010; Vlysidis et al., 2011) which are modified to include the complex kinetics for the main biological reactions obtained from
Figure 9: Schematic diagram for methodological approach
The proposed biorefinery process is assumed to utilize corn stover as the lignocellulosic feedstock which is composed of mainly cellulose, hemicellulose and lignin. Cellulose and hemicellulose are organic compounds with the formula (C6H10O5)n and (C5H8O4) m respectively. These materials are the polymeric molecules of six and five carbon sugars (glucose and xylose). The composition of raw material employed in this study is shown in Table 3. Table 3: Corn stover composition
Component Wt% Glucan 37.00 Xylan 22.80 Lignin 15.76 Ash 4.93 Protein 3.10 Arabinan 3.10 Galactan 1.43 Mannan 0.30 Extractives 9.00 Sucrose 0.77 Acetate 1.81
Figure 10: Overview of the biorefinery process
4.1 Simulation procedure
This section describes the development of industrial scale process simulation of alternative aforementioned biorefinery processes. Process modeling and simulation helps to
identify potential improvements as well as possible difficulties. Several process simulators,
which are used to develop detailed process models, are commercially available including Aspen Plus, Aspen HYSYS, and SuperPro Designer. Simulations of technological configuration were carried out by Aspen Plus software from Aspen Tech. This software was employed to solve the mass and energy balances and to calculate the thermodynamic properties of the streams involved in the process. The physical-property data for the components were obtained either from Aspen plus databank or from NREL’s databank on biomass for wood components such as cellulose and hemicellulose (Wooley & Putsche, 1996). For flash calculation the nonrandom two liquid
(NRTL) activity coefficient model is utilized together with Hayden-O’Connel equation of state to account for dimerization of components such as acetic acid. The plant is assumed to be capable of processing 2000 dry tons of raw materials per day which is the same for all the process configurations studied.
4.2 Process description
This section describes the detailed development of industrial scale biorefinery process based on different possible configurations for each section of the plant. Although the feedstock utilized in these simulations is corn stover, these biorefinery plants are designed in Aspen Plus to be capable of simulating the process with other lignocellulosic materials with different compositions. The biorefinery process has five main sections, pretreatment, fermentation, purification, heat and power generation, and waste water treatment. The simulation and process condition of the plant is explained in detail in the following section:
4.2.1 Pretreatment section
For this study, in pretreatment section, the preferred scheme incorporated to all the analyzed configurations is assumed to be dilute acid. This implemented pretreatment technology shown in Figure 11 catalyzes the polymeric sugars in biomass structure by utilizing dilute acid and heat from steam. First the biomass combines with hot water at 95 °C to reach the goal of having 30% total solids in the hydrolysate in B2, and then it enters to presteamer B4 which heats
up the biomass up to 100 °C. Diluted sulfuric acid with water is sent to pretreatment reactor B8.
After the pretreatment, the hydrolysate slurry is flash-cooled, vaporizing a large amount of water and some of the acetic acid and furfural in B1. The flash vapor is condensed and sent to waste water treatment. Operating condition for dilute acid is shown in Table 4 and the main reactions occurring in this pretreatment technology are represented in Table 5.
Figure 11: Dilute Acid Pretreatment
Table 4: Process data for dilute acid pretreatment
Agent Dilute Acid
Sulfuric acid loading 22 g/kg dry biomass
Sulfuric acid concentration 1.1 wt%
Temperature 158 °C
Pressure @ bubble point of mixture
Hemicellulose conversion 90%
Residence time 5 minutes
Table 5: Dilute acid pretreatment main reactions
Reaction Conversion
Cellulose + H2O Glucose 10 %
Hemicellulose + H2O Xylose 90%
Acetate Acetic acid 100 %
To reduce the toxicity of hydrolysates generated from pretreatment, detoxification is necessary as the by-products can have negative impact on downstream process sections such as enzymatic hydrolysis and fermentation. Many conditioning processes involving chemical, physical and biological methods have been proposed to reduce hydrolysate toxicity prior to fermentation (Larsson et al., 1999). Two technology options are considered for detoxification process in our study: (1) ammonia conditioning, and (2) Overliming
4.2.1.1. Overliming. This process is most widely used for hydrolysate conditioning. In this conditioning technology, as shown in the Figure 12, the hydrolyzate slurry obtained from pretreatment reactor is sent to a pressure filter, B6, to separate the solid and the liquid portions of hydrolysate to facilitate the conditioning of liquid portion. After the separation step, material is overlimed in B16 reactor to raise the PH. The PH of overliming process is the key factor for improving the hydrolysate fermentability. In this study selected PH for detoxification model is 10 based on the optimal value obtained by Mohagheghi et al. (2006). The liquid is re-acidified to adjust to a value appropriate for fermentation by adding sulfuric acid, B17. Lime and sulfuric acid reactions occur based on this equation: “CaO + H2SO4 H2O + CaSO4” and produced gypsum (Calcium sulfate) is precipitated and removed in the second soli-liquid separation, B18. The hydrolyzate is recombined with the solids and passed to enzymatic hydrolysis reaction. All the gypsum was assumed to be removed by solid/liquid separation step.
Figure 12: Overliming conditioning
4.2.1.2 Ammonia Conditioning. In this alternative process, Figure 13, the hydrolysate slurry is cooled to 75 °C in conditioning reactor, where a mixture of ammonia and water is used to raise PH from 1 to 5-6 and dilute the slurry to 20 wt% total solids to guarantee the miscibility in enzymatic hydrolysis. Due to the high miscibility of ammonia in the pretreated mixture, there is no requirement to separate the solid and liquid fractions for conditioning process.
4.2.2 Hydrolysis and fermentation
After pretreatment, enzymes are utilized to convert the residual cellulose into monomeric sugars and then these sugars are fermented to products by yeast. To incorporate the complexity of biological reactions occurring in enzymatic hydrolysis and ethanol fermentation, experimentally-derived kinetic models are utilized to simulate the reactions in these processes. Each kinetic model is explained in the following section:
4.2.2.1 Enzymatic hydrolysis kinetic model. A multi-reaction kinetic model (Kadam et al., 2004) is implemented to describe the enzymatic hydrolysis of feedstock. The mathematical representation of the kinetics is presented in Table 6. This model includes reactions for:
1. Substrate reactivity (Equation 1) which considers the reduction in the rate of hydrolysis
as saccharification progresses because of the change in crystalline structure of cellulose or substrate accessibility.
2. Decomposition of cellulose to cellobiose (Equation 2) and glucose (Equation 3) which
happens on the surface of cellulose.
3. Cellobiose hydrolysis to glucose (Equation 4) which occurs in the solution and is a
homogenous reaction which follows Michaelis-Menton kinetics.
4. Enzyme adsorption (Equation 5) which follows the Langmuir type isotherms
5. Temperature effects on hydrolysis (Equation 6) based on Arrhenius model which is valid
in a limited range of temperature where the enzyme is active.
Cellulose is hydrolysed to glucose and cellobiose by utilizing the combination of endo-β
-1, 4-glucanase (EG), exo-β-1, 4-cellobiohydrolase (CBH), and cellobiose is hydrolysed to
Table 6: Kinetic model for enzymatic hydrolysis(Kadam et al., 2004) = 1 = 1 + + + 2 = ( + ) 1 + + + 3 = 1 + + ! + 4 " = #$%&' $&( " ) 1 + $&( " 5 *$ (+ ) = *$ (+ ) , . /+ + 0-" 6
Langmuir isotherms are used to explain the adsorption of cellulose enzyme and the
model distinguishes between the CBH/EG and β-glucosidase enzymes. Sugar inhibitions
considered in this model assumes that the hydrolysed sugars can bind to the active site of the substrate and decrease the formation rate of enzyme-substrate complex which is a competitive mode of inhibition.
4.2.2.2 Ethanol fermentation kinetic model. The kinetic model implemented in this study for ethanol production (via sugar fermentation) is based on the two-substrate developed model of Leksawasdi et al. (2001), by consuming a recombinant bacteria Z.mobilis ZM4 (pZB5), which is capable of fermenting glucose and xylose simultaneously (co-fermentation). The mathematical representation of the fermentation kinetics is presented in Table 7. The model is based on the following reactions:
1. Cell growth on glucose (Equation 7) and xylose (Equation 8) which incorporates the
2. Glucose and xylose consumptions (Equation 10 and Equation 11) which are considered in separate equations by incorporating the inhibition effects.
3. Ethanol production (Equation A.14) which incorporates the production from glucose
(Equation 12) and xylose (Equation 13) by considering the weighting factor (α).
Table 7: Kinetic model for ethanol fermentation(Leksawasdi et al., 2001)
1= 2%,4 14+ 51 − 7− 7$',4 78-9,:− 7$',4 ; 5 1 4 1 4+ ; 7 <= 2%,' ' <' + ' 51 − 7 − 7$',' 78-9,9=− 7$',' ; 5 < ' < ' + ' ; 8 >=??@ = . 1. + (1 − ). < . 9 B= − . CDEFG, H B4+ 451 − 7− 7$ ,4 78-9I,:− 7$ ,4; 5 B 4 B 4+ 4; 10 J= −(1 − ). CDEFG, GK ' J' + ' 51 − 7− 7$ ,' 78-9I9=− 7$ ,' ; 5 J ' J ' + ' ; 11 L= CMEFG, H 4 L4+ 451 − 7− 7$N,4 78-9O,:− 7$N,4; 5 L N4 L N4+ 4; 12 = CMEFG, GK ' ' + ' 51 − 7− 7$N,' 78-9O,9=− 7$N,' ; 5 N' N' + ' ; 13 =??@ = .7 L. + (1 − ). . 14
Due to simultaneous cell growth on both of the substrates (glucose and xylose), there is
competition to contribute (via cell growth) to ethanol production. The weighting factor (α)
represents the relative consumption rates of the two sugars (Equation A.9 and Equation A.14).
The best value for the weighting factor (α) was determined to be α = 0.65 (Leksawasdi et al.,
2001).
4.2.3 Ethanol purification
Purified ethanol to an acceptable level for industrial applications, 99.5 wt%, is achieved by utilizing two distillation columns and a molecular sieve adsorption. As is shown in Figure 15
bottom of the column in the heat exchanger. Ethanol and CO2 are removed as vapor side products
and the bottom stream contains unconverted insoluble solids, dissolved solids, and most of the water. Insoluble solids are separated in the pressure filter, B21, and sent to combustion section to produce steam and electricity required for the plant and the water containing soluble solids is directed to waste water treatment section to remove the organic compounds from water and recycle it back to supply the process water demand. The vapor stream containing ethanol is fed to the second column, B7, which is called rectification column to purify the ethanol up to its azeotropic point, 92.5 %wt. Additionally, molecular sieves are used to reach the purity required for industrial scale applications of ethanol which is a system of columns packed with beds of adsorbents to selectively separate ethanol, water mixture and obtain a 99.5% purity of ethanol.
One of the modifications considered in this study was to separate the residual soluble and insoluble solids after enzymatic hydrolysis instead of separating them after beer column, Figure 14. In this scenario, the pressure filter will be after hydrolysis and bottom product of the beer column will be directly fed to waste water treatment section.
Figure 15: General block diagram by solid separation after enzymatic hydrolysis 4.2.4 Succinic acid purification
For succinic acid purification, Figure 16, cellular debris is separated from the fermentation effluent by centrifugation, B1, which is followed by an evaporator, B2 that vaporizes most of the water and organic acids which have lower boiling points than succinic acid. The concentrated stream obtained from bottom of the evaporator is sent to a crystallizer, B4 which separates succinic acid from other organic acids and trace water based on differential solubilities. While formic, acetic and lactic acids are water-miscible at pH from 1-14 at temperatures above 0°C, succinic acid solubility decreases sharply when the temperature decreases (Li et al., 2010). Therefore, succinic acid can be selectively separated from other acids using solubility-driven crystallization. Pure succinic acid crystals are obtained via another centrifugation operation, B5, and finally a dryer is used to reduce the moisture in the crystals, B6, to purify it to acceptable end use purity (> 90% by mass).
Process integration suggested by Zeikus et al. (1999) is utilized in this work to capture the carbon dioxide produced during ethanol fermentation and use it in succinic acid fermentation (as a carbon source). This can have a 2-fold benefit on plant economics and emissions – (1) reduces the carbon footprint of the biorefinery as it permanently sequesters ethanol-derived CO2 into succinic acid molecules, and (2) reduces the amount of carbon dioxide that is required as a purchased input for succinic acid production.
Different technology options and possible modifications for each section of the plant result in alternative biorefinery superstructures. In this study, four scenarios are considered for process configurations based on alternative technology options which are illustrated in Table 8: Figure 16: Process flowsheet for succinic acid production
4.3 Economic Analysis
In this study we have also carried out an economic analysis of the alternative process configurations. In the following section the costing strategy of entire plants is discussed including both capital and operating costs.
4.3.1 Capital cost
Initial capital cost estimation for the biorefinery processes in this study is performed by exporting the simulation from Aspen Plus to Matlab model and calculating the equipment purchase cost and the additional costs. Equipment cost data are obtained from literature (Humbird et al., 2011; Kazi et al., 2010; Vlysidis et al., 2011). The additional costs are related to the total equipment cost through certain factors. Approximate costs of the equipment are calculated in Matlab based on the cost of similar item obtained in literature. When the size or capacity of the similar item is different, six-tenths rule is used to calculate the new price.
P = Q( P Q)
.>
Where CB is the approximate cost of equipment having size SB. CA is the known cost obtained
from literature for the size of SA.
Table 8: Alternative process configurations Flowsheet
options
DA AM OL SHCF S/L sep 1 S/L sep 2 ETOH SACID
Scenario 1 -- -- --
Scenario 2 -- -- --
Scenario 3 -- -- --
Scenario 4 -- --
DA: Dilute acid; AM: Ammonia conditioning; OL: Overliming; SHCF: Separate Hydrolysis and co-fermentation; SSCF: Simultaneous Saccharification and co-fermentation; S/L sep 1: Solid separation after hydrolysis; S/L sep 2: Solid separation after beer column; ETOH: Ethanol; SACID: Succinic acid
4.3.2 Operating cost
To estimate the annual production cost (CAPC ), Mass and energy balance results from
Aspen Plus simulation are exported to Matlab model by taking into account the cost of raw
materials (CRM), utility cost (CU), and some extra costs (CE) which are essential for plant
operation.
QRS = . + T+
Raw material cost is determined in Matlab by the exported feed rates of the raw materials
per year multiplied by their prices. To calculate CU, annual energy consumption is used which are
calculated from the energy balances inside Aspen Plus. The important extra costs considered in this study are the labor and maintenance costs which are related to feedstock amount and total equipment costs, respectively, through certain factors.
5. Results and discussion
In this section the results for alternative technology options and possible process integrations implemented in the hypothetical biorefinery plant are presented and compared based on their energy, utility consumption and product yields.
5.1 Detoxification technology options
In scenario 1 and 2 the configurations for all the technology options in the process are equal except the detoxification section. The process data for both of these technology options are shown in Table 9. In Scenario 1, ammonia conditioning is implemented as the degradation removal process and in scenario 2 overliming is selected. The results of the simulation of models are represented in Table 10 and Figure 17.
Table 9: Ammonia Condition and overliming process data
Overliming Ammonia Conditioning
Agent Lime, Sulfuric
Acid
Ammonia
Ammonia ( To raise the PH to 5) 0 25 ton/day
Lime ( To raise the PH to 10) 66 ton/day 0
Sulfuric acid ( To adjust PH) 31 ton/day 0
PH 10 5
Water
(To control the solid for hydrolysate to 20 wt%)
2743 ton/day 2600 ton/day
Soli-liquid separation Yes No
Gypsum produced 7100 kg 0
Table 10: Comparison of alternative technologies for conditioning Conditioning
technology
Ethanol yield
(gal/dry ton feedstock)
Raw material Cost (MM$/yr)
Energy Cost (MM$/yr)
Overliming 56.80 48.8761 12.79
Figure 17: Sugar and solid recovery for alternative conditioning technologies
The conditioning with ammonia has the advantage of being mixed with dilution water. Therefore, the whole hydrolysate slurry can be treated at once and does not require solid-liquid separation steps. On the other hand, when lime is utilized in conditioning process to overlime the hydrolysate, pretreated biomass requires to be separated into ash solids and liquid fractions; the liquid fraction is conditioned by lime in which the PH is increased from 1 to 10 and then readjusted to 5 with additional sulfuric acid. Sugar can be lost to side reactions because of high PH in conditioning reactor and also some part of sugar is also lost during the solid-liquid separation process which precipitates the produced gypsum from lime and sulfuric acid. The main drawbacks of this conditioning process are the sugar degradation that occurs by the side reactions at high PH in addition to sugar loss during the gypsum separation process. Sugar losses and gypsum disposal cost are eliminated by replacing the overliming with ammonia conditioning. However, ammonia which is utilized to detoxify the pretreated slurry is more expensive than lime. Due to higher sugar loss in overliming process, as the results show in Table
0.84 0.86 0.88 0.9 0.92 0.94 0.96 0.98 1
Glucose Xylose Solid
Overliming
10 and Figure 17, hydrolyzate stream which enters the fermentation reactor has lower amount of sugar. Therefore, sugar fermentation occurs at a lower extent in comparison to ammonia conditioning and produced ethanol yield is smaller. On the other hand the utility and energy cost of the plant are better in comparison to ammonia conditioning due to higher cost of ammonia and smaller solid load to distillation column.
5.2 Solid liquid separation process
The results for scenarios 1 and 3, which have alternative options for solid separation, are represented in Table 11 and Figure 18. As the results show in Table 11, solid separation after enzymatic hydrolysis and before purification has the advantage of reducing the energy cost in distillation column, due to higher initial ethanol concentration and lower load of solid in the column. The main drawbacks for this technology option are: part of the produced sugars in hydrolysis and pretreatment are separated with the solids and are not utilized in the fermentation to produce the product, and furthermore, Solids are separated after hydrolysis and this makes the sugar, glucose and xylose, concentration higher in the inlet stream to fermentation tank. Based on the kinetic model developed in the previous section for fermentation, glucose and xylose have inhibitory effect on ethanol fermentation. Therefore, sugars are converted to ethanol in a lower extent in comparison to scenario 1, Figure 18. Due to sugar loss and lower sugar conversion, the final ethanol yield is lower than the scenario which separates lignin after beer column as it is shown in Table 11.
5.3 Kinetic model results
Implemented complex kinetics for hydrolysis and fermentation in Matlab are linked to the simulation in Aspen Plus.
Table 11: Comparison of alternative technologies for Solid separation Lignin separation Unit energy cost for
distillation ( MJ/gal ethanol)
Sugar loss (% wt)
Ethanol yield
(gal/dry ton feedstock)
After beer column 37.28 0 57.85
After enzymatic Hydrolysis
31.12 4.2 52.95
Figure 18: Sugar conversion in ethanol fermentation for two alternative solid separation
These kinetic models calculate the final concentration of products (glucose in hydrolysis and ethanol in fermentation), by solving the system of differential equations. For the process in which the proposed kinetic model for hydrolysis and co-fermentation are solved sequentially, SHCF, obtained results are presented in the following figures (Figure 19 and Figure 20):
0 0.1 0.2 0.3 0.4 0.5 0.6 0.7 0.8 0.9 1 Glucose Xylose
After Beer Column
After Distillation Column
Figure 19: Enzymatic hydrolysis in SHCF
Figure 20: Sugar fermentation in SHCF 0 10 20 30 40 50 60 70 80 0 10 20 30 40 50 60 70 80 C o n ce n tr a ti o n ( g /L ) Time Glucose Cellulose 0 10 20 30 40 50 60 0 5 10 15 20 25 C o n ce n tr a ti o n ( g /L ) Time Glucose Xylose Ethanol
5.4 Economic evaluation
All the considered biorefinery process configurations are economically evaluated and compared. To evaluate the profitability of different schemes, the annual profit is calculated based on the difference between annual revenues generated and annual production cost.
5.4.1 Scenario 1
Simulation was performed in Aspen Plus and the results of the streams in the flowsheet based on the calculated mass and energy balances in simulation are exported to Matlab model by utilizing the ActiveX Automation interface technology. Ethanol yield in this scenario is 57.85 gal per dry ton of feedstock. Waste water treatment and combustion sections are not considered in capital cost calculations since for roughly similar design options, as the ones considered here, they are expected to be comparable. The main sections in capital cost calculation include pretreatment, hydrolysis, fermentation, and purification. Table 12 shows the prices assumed for the raw materials and products in calculation of economic parameters in this scenario based on the values obtained from literature. Annual production cost, shown in Table 13, includes all the raw materials cost, utility cost (which in this study is assumed to be the total steam required in the plant), and labor and maintenance cost (which are calculated as a factor of total feedstock cost and capital cost of the process, respectively).
Table 12: Raw materials and product unit prices in scenario 1
Product/Raw material cost/selling price
Corn stover ( $/ton) 65.000
Sulfuric acid ( $/ton) 89.000
Enzyme ($/ton) 121.00
Ammonia ($/ton) 450.00
Water ($/gal) 0.0005
Ethanol ($/gal) 3.0000